

Musculoskeletal medical care expenditures are presented in two ways: (1) for all persons with a musculoskeletal disease, regardless of whether the musculoskeletal disease was the reason for the expenditure (total direct cost), and (2) as a measure of the expenditures beyond those expected for persons of similar characteristics but who do not have a musculoskeletal disease (incremental cost). Incremental cost is that share estimated to be directly related to the musculoskeletal condition. Both total and incremental costs are expressed as the average cost per person with a musculoskeletal disease and as the aggregate cost (sum) for all persons with a musculoskeletal disease.
Mean costs are presented for ambulatory care, inpatient care, prescription costs, and a residual for other costs, as well as the total cost. Medical care costs are expressed in both the current year dollars (ie, the year the data was collected) and in 2011 dollars to provide a standard of comparison across years.
Total and incremental costs for all musculoskeletal conditions and five subconditions are summarized in Table 10.6 PDF [1] CSV [2].
Overall, total average expenditures for persons with musculoskeletal diseases increased from $4,832 in 1996 to 1998 to $7,768 in 2009 to 2011, in 2011 dollars, a 60% increase. Ambulatory care had the largest share of total average per person costs for musculoskeletal diseases. (Reference Table 10.4 PDF [3] CSV [4])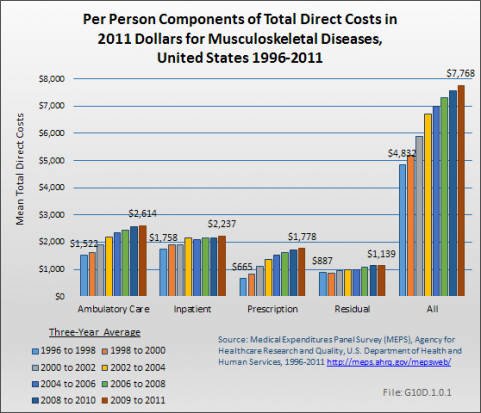
Per-person average expenditures for prescriptions had the largest increase among all components of musculoskeletal diseases, ranging from an increase of 102% for osteoporosis to an increase of 208% for injuries. Overall, prescription per person costs rose by 167% for all musculoskeletal diseases. Inpatient and residual costs showed the lowest increase between 1996 and 2011. 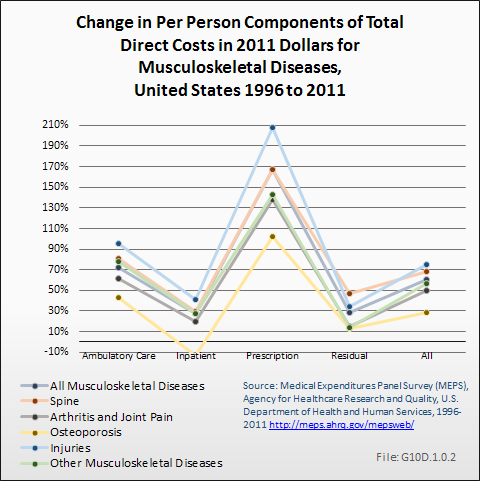
Incremental average expenditures for persons with musculoskeletal diseases almost doubled in real terms between 1996 to 1998 and 2009 to 2011, in 2011 dollars, from $1,280 in the earlier three-year period to $2,075 in the later one. Incremental costs for inpatient services for musculoskeletal diseases increased the most in relative terms, rising by 207% between 1996 and 2011. (Reference Table 10.5 PDF [5] CSV [6])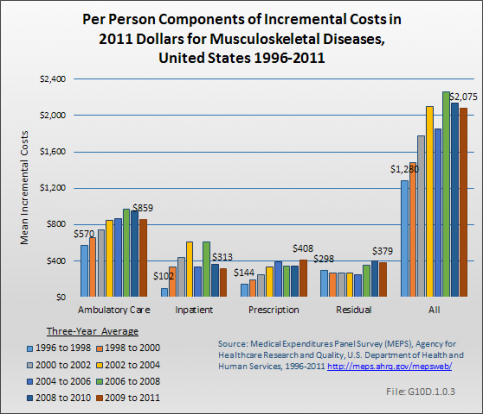
Data for specific musculoskeletal conditions has been analyzed through the 2009 to 2011 time period, and is shown in 2011 dollars. Total per person medical care expenditures rose for each of the major subconditions between 1996-1998 and 2009-2011. Osteoporosis, which rose from $8,572 to $10,978 per person had the lowest increase at 28%. Costs for injuries rose by 75%, from $4,053 to $7,104 per person, and was the largest relative due to increase. (Reference Table 10.4 PDF [3] CSV [4] and Table 10.7 PDF [7] CSV [8])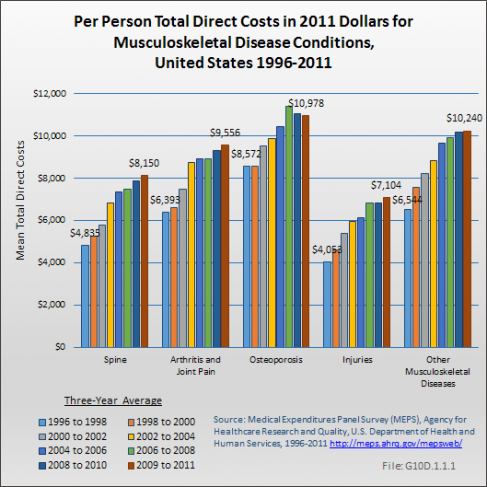
Incremental costs for arthritis and joint pain rose by 192% between 1996 and 2011, nearly four times the rate of increase for spine, injuries, and other musculoskeletal diseases. Incremental costs were not calculated for osteoporosis due to insufficient sample size. (Reference Table 10.5 PDF [5] CSV [6])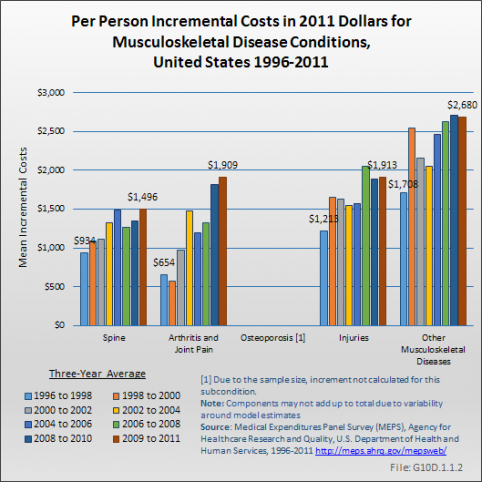
Expenditures for musculoskeletal diseases did not differ substantially by gender, race, and education level in 2011. On an unadjusted basis, women with musculoskeletal diseases had only 3% higher average expenditures than men. Nonwhites also had 3% higher expenditures than whites. On the other hand, non-Hispanics report 30% higher expenditures than Hispanics, and those who are married or divorced, separated, or widowed had substantially higher expenditures than those who have never married (presumably due to age). Persons who are divorced, widowed, or separated, at $8,951, had the highest unadjusted mean expenditures for musculoskeletal diseases.
Lack of insurance had the most profound impact on health expenditures for persons with musculoskeletal conditions. Expenditures on behalf of those without insurance, at $2,479, were only a third as large as those with private insurance ($7,842) and a quarter as much as those with public insurance ($10,142). Thus, lack of health insurance is associated with dramatically lower expenditure levels, inconsistent with the belief that persons who lack insurance are somehow able to obtain care. (Reference Table 10.8 PDF [9] CSV [10])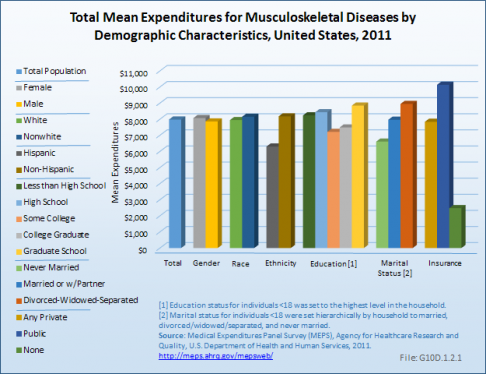
Total medical care expenditures for musculoskeletal diseases are disproportionately higher for persons 65 years of age or older, with a per-person cost of $11,708 in 2009 to 2011 compared to a per-person cost of $3,288 for persons less than 18 years, $4,658 for those 18 to 44 years, and $8,658 for those 45 to 64 years. (Reference Table 10.9 PDF [11] CSV [12])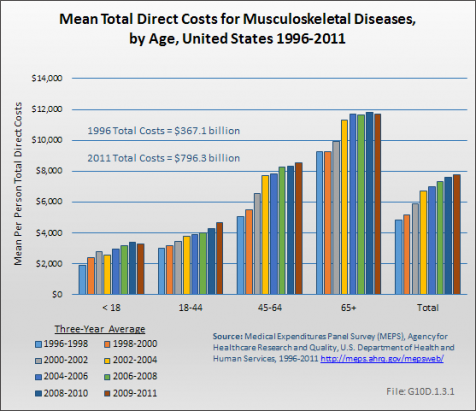
Although in the years 1996-1998, mean incremental costs for musculoskeletal disease were highest for the oldest cohort, age 65 years and older, by 1998 to 2000 costs for those ages 44 to 64 years were the highest. They have remained so since that time, and in 2009 to 2011 were 20% higher for this age group than the age 65 years and over group. (Reference Table 10.9 PDF [11] CSV [12] and Table 10.10 PDF [13] CSV [14])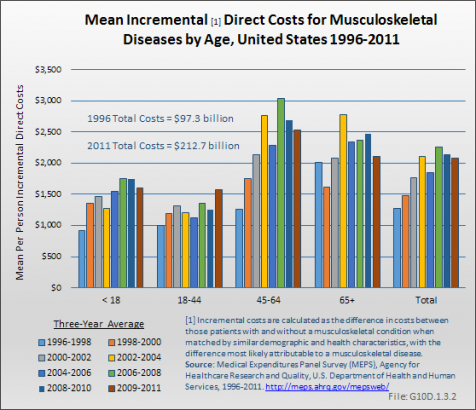
Aggregate total expenditures increased from $367.1 billion to $796.3 billion, in 2011 dollars, during this time frame, or more than doubling. In 1996 to 1998, aggregate total expenditures for persons with a musculoskeletal disease, whether for musculoskeletal disease or other conditions, represented 3.2% of the GDP in 2011 dollars. By 2009 to 2011, the proportion had grown to 5.2% of the GDP.
Aggregate incremental expenditures, due to the higher number of persons with a musculoskeletal condition and the increased incremental expenditures per person, increased from $97.3 billion in 1996-1998 to $212.7 billion, in 2009 to 2011 when expressed in constant (2011) dollars, or by about 119%. Incremental cost associated with a musculoskeletal condition represented the equivalent of 0.25% and 0.5% of the GDP in 2011 dollars, for the respective time frames.
Over the full time range of 1996 to 1999 through 2009 to 2011, the annual average rate of increase in total and incremental costs for musculoskeletal diseases has been 9%. (Reference Table 10.7 PDF [7] CSV; [8] Table 10.9 PDF [11] CSV [12]; Table 10.11 PDF [15] CSV [16]; Table 10.14 PDF [17] CSV [18])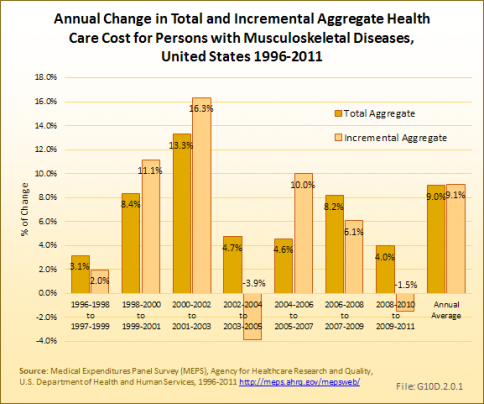
Because of the higher prevalence and relatively high level of expenditures per person, aggregate expenditures have consistently been greatest for arthritis and joint pain, accounting for $580.9 billion in health care costs in 2009 to 2011. Spine conditions, with an estimated $253.0 billion aggregate cost in 2009 to 2011, have held steady as the second most expensive musculoskeletal health care condition. Aggregate costs for injuries and other musculoskeletal conditions were $176.1 and $190.6, respectively, in 2009 to 2011. (Reference Table 10.6 PDF [1] CSV [2])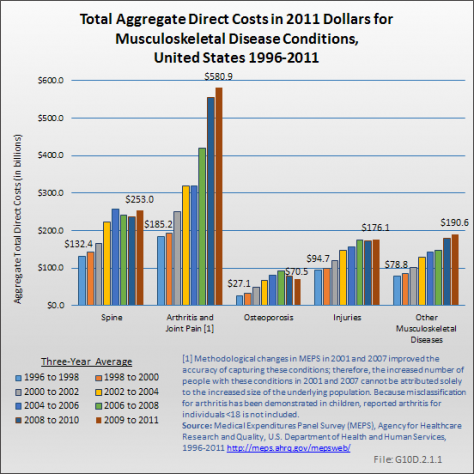
The magnitude of increase in aggregate total expenditures between 1996 to 1998 and 2009 to 2011 is greatest for the diseases within the category including osteoporosis (about 160%), but was substantial for all musculoskeletal diseases. The aggregate total cost of health care for spine conditions increased by more than 91%; musculoskeletal injuries by 86%; and other musculoskeletal diseases by about 142% over the period 1996 to 1991 through 2009 to 2001. (Reference Table 10.7 PDF [7] CSV [8])
Sampling variability limits inference about time trends in incremental expenditures associated with the subcondition groups. However, while estimates do not have the same precision as those for all musculoskeletal diseases, it is fair to conclude that 2009 to 2011 aggregate incremental expenditures, at $116.1 billion, were largest for arthritis and joint pain. (Reference Table 10.6 PDF [1] CSV [2])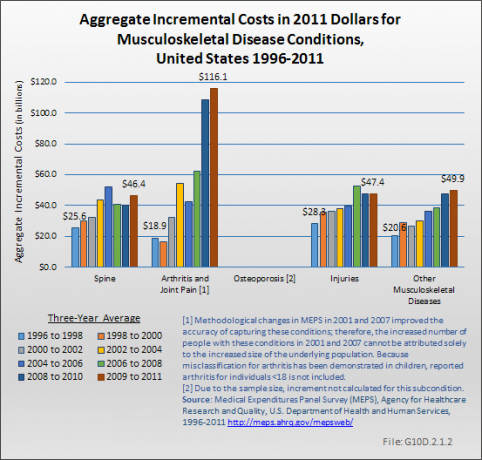
Using the more expansive definition of musculoskeletal diseases, aggregate total medical care expenditures on behalf of persons with a musculoskeletal disease were $1.068 trillion in 2009 to 2011.
Women account for both a higher proportion of the population with musculoskeletal disease and more than half of total costs. With 36% of women reporting musculoskeletal diseases compared to 30% of men, women accounted for 56% of aggregate costs in 2011.
Whites and non-Hispanics account for the majority of cost, with 84% and 92%, respectively. Although a similar share of one-third of all persons in all education levels report musculoskeletal diseases, due to lower numbers with higher education, these groups represent a smaller share of aggregate total cost.
About one in four persons with no insurance report musculoskeletal disease, but the much lower cost and smaller group of persons means that only 3% of aggregate total cost is represented by the uninsured. (Reference Table 10.8 PDF [9] CSV [10])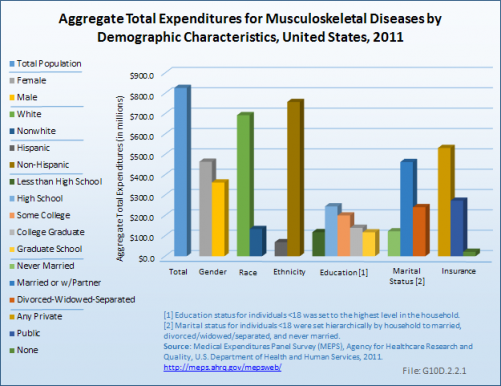
While persons age 65 years and older represent about 25% of all persons with a musculoskeletal disease, this age group accounted for 37%, or $294.1 billion, of total aggregate health care costs for musculoskeletal diseases in 2009 to 2011. However, incremental aggregate musculoskeletal health care for the 65 years and older population is estimated to comprise 25%, or $53.0 billion, of the total $212.7 billion aggregate incremental cost of these conditions, in part because in this age group, high medical care costs become the norm. Persons age 45 to 64 years represent 38% of persons these ages with musculoskeletal conditions, but 42% of aggregate medical care costs and 47% of aggregate incremental costs. (Reference Table 10.9 PDF [11] CSV [12] and Table 10.10 PDF [13] CSV [14])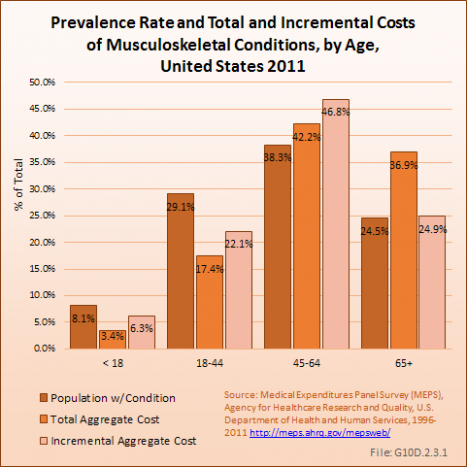
Estimated 2009 to 2011 aggregate total expenditures for persons age 18 to 64 years were $474.9 billion, or 60% of aggregate total health care expenditures for musculoskeletal diseases in that year. Thus, although musculoskeletal conditions are more prevalent with age, because of the size of the group 18 to 64 years, a majority of medical costs occur in the adult, nonelderly population. Only $27.4 billion of total aggregate musculoskeletal health care costs, or less than 4% of the total, went for persons under the age of 18 years.
The share of aggregate total and incremental costs accounted by persons 45 to 64 years has been growing over time, by 40% in relative terms for aggregate total costs (from 30% in 1996 to 1998 to 42% in 2009 to 2011) and by 68% in relative terms for incremental aggregate costs (from 28% in the first three years to 47% in the last three years). The share of total and incremental aggregate costs for all other age groups has been falling over this same period of time. The cumulative increase in aggregate cost has been 204% and 262%, respectively, for total and incremental costs from 1996 to 2011 for the 45- to 64-year age group, while all other age groups have increased between 60% and 92%. This reflects the importance of the size of the baby boom generation in overall musculoskeletal costs. However, that large cohort will soon be concentrated among the elderly and aggregate costs are likely to increase as a share of the total among those 65 years and older in the years to come. (Reference Table 10.10 PDF [13] CSV [14]; Table 10.11 PDF [15] CSV [16])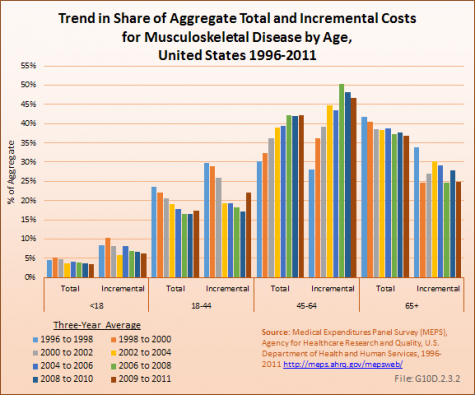
Links:
[1] https://bmus.latticegroup.com/docs/T10007.6.pdf
[2] https://bmus.latticegroup.com/docs/T10007.6.csv
[3] https://bmus.latticegroup.com/docs/T10005.4.pdf
[4] https://bmus.latticegroup.com/docs/T10005.4.csv
[5] https://bmus.latticegroup.com/docs/T10006.5.pdf
[6] https://bmus.latticegroup.com/docs/T10006.5.csv
[7] https://bmus.latticegroup.com/docs/T10008.7.pdf
[8] https://bmus.latticegroup.com/docs/T10008.7.csv
[9] https://bmus.latticegroup.com/docs/T10009.8.pdf
[10] https://bmus.latticegroup.com/docs/T10009.8.csv
[11] https://bmus.latticegroup.com/docs/T10010.9.pdf
[12] https://bmus.latticegroup.com/docs/T10010.9.csv
[13] https://bmus.latticegroup.com/docs/T10011.10.pdf
[14] https://bmus.latticegroup.com/docs/T10011.10.csv
[15] https://bmus.latticegroup.com/docs/T10012.11.pdf
[16] https://bmus.latticegroup.com/docs/T10012.11.csv
[17] https://bmus.latticegroup.com/docs/T10015.14.pdf
[18] https://bmus.latticegroup.com/docs/T10015.14.csv