 [4]
[4] 

The total economic impact of musculoskeletal diseases includes two types of costs: costs to treat individuals (direct medical costs) and costs paid indirectly by these individuals and society (lost wages).
Aggregate all-cause costs among persons with a musculoskeletal disease, including direct healthcare costs plus decreased or lost wages (indirect cost), was estimated to be $980.1 billion per year in 2012-2014. (Reference Table 8.14 PDF [1] CSV [2]). Aggregate incremental costs (i.e., those attributed to musculoskeletal disease) for direct and indirect costs sum to a $321.6 billion per year Tables 8.6.1 and 8.12). In other words, direct and indirect costs attributable to musculoskeletal disease account for a third of all-cause direct and indirect costs for this population.
Between the years 1996-1998 and 2012-2014, the Gross Domestic Product (GDP)1, in constant 2014 dollars, has risen from $12.0 trillion to $17.0 trillion, an increase of 42%. Over the same two time frames, total direct and indirect costs of musculoskeletal conditions rose from $411.9 billion to $980.1 billion. This is an increase of 138%, or more than three times the rate of increase for the GDP.
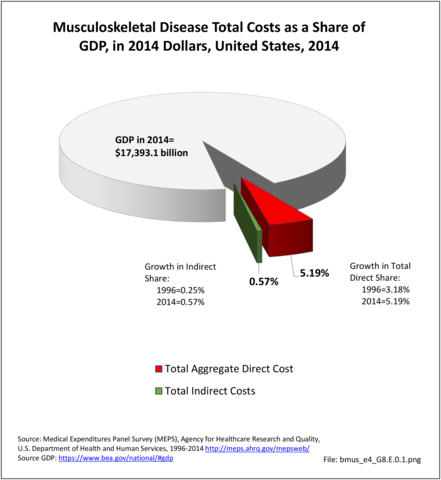
As a share of GDP, using the same 2014 dollars base, total direct and indirect costs for musculoskeletal conditions increased by 68%, from 3.44% to 5.76%. Indirect costs rose twice as fast as direct costs in relative terms. However, indirect cost are a much smaller share of total cost than direct costs, constituting 0.25% of GDP in 1996-1998 and 0.57% in 2012-2014. Direct costs rose from a 3.18% share to a 5.19% share over the same time period. (Reference Table 8.14 PDF [1] CSV [2])
Links:
[1] https://bmus.latticegroup.com/docs/bmus_e4_T8.14.pdf
[2] https://bmus.latticegroup.com/docs/bmus_e4_T8.14.csv
[3] https://bmus.latticegroup.com/file/bmuse4g8e01png
[4] https://bmus.latticegroup.com/docs/bmus_e4_G8.E.0.1.png
[5] http://www.bea.gov/national/xls/gdplev.xls