 [2]
[2] 

Race and ethnicity are important factors in the incidence of osteoporosis. The World Health Organization defines osteoporosis as a T score less than -2.5.1 African-Americans tend to have higher bone mass levels than Caucasians and Asians.2,3 In adults 50 years of age and older, approximately 10% of non-Hispanic white women have osteoporosis, compared with 6% of non-Hispanic black women and 10% of Hispanic women. It is estimated that an additional 50% of non-Hispanic white and Asian women have osteopenia, compared with 39% of black women and another 38% of Hispanic women.4,5
Osteoporotic fractures are a major health care concern due to their morbidity and mortality along with health expenditures. In 1995, the estimated health care costs associated with osteoporotic fractures was 13.8 billion.6 Decreased bone strength predisposes patients to an increased risk of fragility fractures, especially hip fractures. African-Americans have the lowest rates of hip fractures since they have the highest bone density.7 In a database study, Cheng et al reported that among traditional Medicare beneficiaries with fractures, osteoporosis was diagnosed nearly twice-as-often for white women compared with black women across all age groups.8 Ethnicity and race influenced the risk of fracture even after adjusting for multiple variables. Overall, the risk of fracture was 49% lower among African American women than among white women.9 Longer hip axis lengths have also been linked to an increased risk of hip fracture and hip axis lengths are reportedly shorter among African Americans and Asians, even after adjusting for height.10 African-American women who sustain an osteoporotic fracture, unfortunately, experience higher morbidity and mortality in comparison.11 This is possibly due to differences in hospital volume or it could reflect variations in care.
Race and ethnicity also are important factors in the screening and treatment of osteoporosis. In a retrospective review, Curtis et al found a significant disparity in recommendation for osteoporosis screening between AA and white women. Among Medicare enrollees, 33% of white women have screenings for BMD, but only 5% of African American women have such screenings.12 Among women with fractures, African Americans had a lower likelihood of both BMD testing and treatment.10,13 Hamrick et al reported that while 80% of white women received pharmacotherapy after osteoporosis diagnoses, only 68% of black women did.14 A cross sectional study by Curtis et al showed that African Americans are significantly less likely than Caucasians to receive osteoporosis medication. Minority women are less likely to receive hormone replacement therapy.15
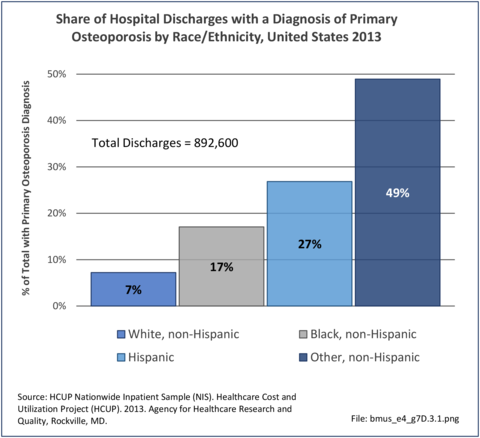
In 2013, 892,600 patients discharged from hospitals in the US had a primary (first) diagnosis of osteoporosis. The distribution of persons with a primary diagnosis of osteoporosis did not reflect other data that indicates lower rates of osteoporosis among non-Hispanic blacks and higher rates among non-Hispanic whites and those of Hispanic ethnicity. Among this group, only 7% were classified as non-Hispanic whites.
Within the same time period, 540,600 patients were discharged with a fragility fracture diagnosis, and may or may not have had a diagnosis of osteoporosis. Among those with a fracture diagnosis, 82% were non-Hispanic white persons, with all other racial/ethnic groups accounting for only 4%-5% of discharges with a fracture. (Reference Table 7D.5 PDF [3] CSV [4])
The differences in hospital discharges for osteoporosis and fragility fractures from known prevalence rates may reflect treatment rates among racial/ethnic groups and coding of fractures before the underlying cause of the fracture in medical records, particularly among non-Hispanic white patients.
Links:
[1] https://bmus.latticegroup.com/file/bmuse4g7d31png
[2] https://bmus.latticegroup.com/docs/bmus_e4_g7d.3.1.png
[3] https://bmus.latticegroup.com/docs/bmus_e4_t7d.5.pdf
[4] https://bmus.latticegroup.com/docs/bmus_e4_t7d.5.csv
[5] https://bmus.latticegroup.com/file/bmuse4g7d32png
[6] https://bmus.latticegroup.com/docs/bmus_e4_g7d.3.2.png