

More than three of every five unintentional injuries that occur annually in the United States are to the musculoskeletal system. Although the incidence of total unintentional injuries is difficult to estimate, numerous databases and reports since the early 1990s have shown that between 60% and 77% of injuries occurring annually involve the musculoskeletal system. (Reference Table 6.0 PDF [1] CSV [2])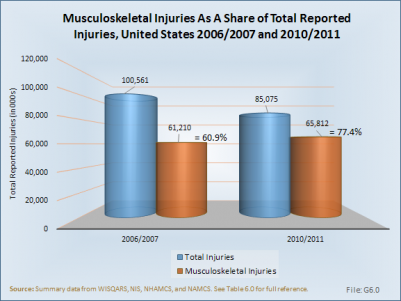
Musculoskeletal injuries are injuries occurring to the neck, spine, pelvis, and extremities. As defined by medical diagnosis codes, musculoskeletal injuries include fractures, derangements, dislocations, sprains and strains, contusions, crushing injuries, open wounds, and traumatic amputations. They are often caused by sudden physical contact of the body with external objects, but the most common cause is falls. Additional major causes of musculoskeletal injuries are sports injuries, playground accidents, motor vehicle crashes, civilian interpersonal violence, war injuries, stress injuries, overexertion, and repetitive workplace injuries.1
Musculoskeletal disorders (MSDs) are injuries or disorders of the muscles, nerves, tendons, joints, cartilage, and disorders of the nerves; tendons; muscles; and supporting structures of the upper and lower limbs, neck, and lower back that are caused, precipitated, or exacerbated by sudden exertion or prolonged exposure to physical factors such as repetition, force, vibration, or awkward posture.2
In 2010/2011, more than 65.8 million annual episodes of treatment for musculoskeletal injuries were recorded in physician offices, emergency departments, outpatient clinics, and hospitalizations. This compares to 85.1 million episodes of treatment for all kinds of injuries, including burns, poisoning, and drowning, a number that is down by 15% from the 2006/2007 reporting year.
A traumatic injury is defined as "an injury or wound to a living body caused by the application of external force or violence,"1 and includes injuries incurred in vehicular accidents, machinery, falls, sports, and other injuries caused by something outside a person’s body.
In 2012, 8.86 million persons reported seeking medical care for an injury during the prior three months. The number of self-reported injuries, even when extrapolated out to a full year, is much lower than the number of health care visits to physicians, emergency departments, outpatient clinics, and hospitals reported over the course of a year, suggesting that self-reported injuries are underreported. However, the proportion of these injuries that were musculoskeletal was similar to that reported by the national health care databases for injury-related health care visits, 72% and 77%, respectively. In addition, self-reported injuries reflected the distribution by demographic characteristics (i.e., sex, age, and race) in the same proportion as found in the general population and among health care visits in the national databases, confirming that musculoskeletal injuries occur to all people.
(Reference Table 6A.1.1.1 PDF [5] CSV [6])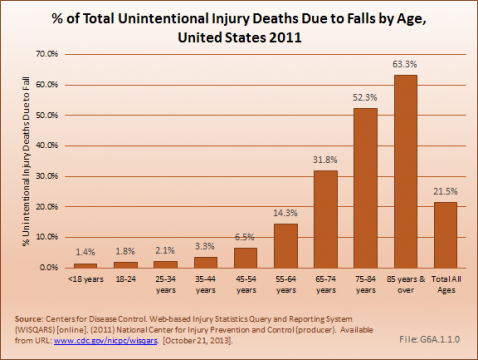
The type of self-reported injury reported varied somewhat by demographic group, particularly with respect to sex and age. Overall, the most common type of musculoskeletal injury for which medical attention was sought was a sprain or strain. This was particularly true for persons aged 65 to 74 years, and for females. People age 75 years and older were most likely to report a contusion, but this age group also reported higher proportions of fractures than other ages. Open wounds requiring medical attention were more likely to be reported by males and people 18 to 44 years than by other demographic groups. Sprains and strains as well as fractures were the most common musculoskeletal injury type reported for children ages 0 to 17 years; overall, children had a lower proportion of musculoskeletal injuries for which medical attention was sought than did other age groups. (Reference Table 6A.1.1.1 PDF [5] CSV [6])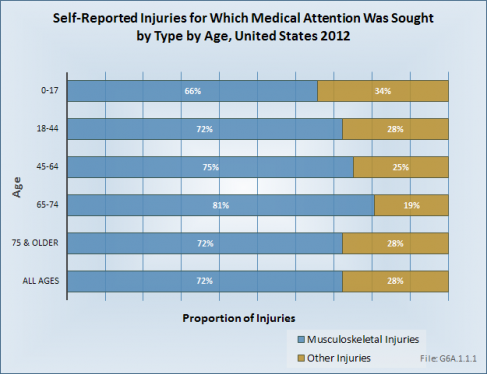
Injuries to the knee were the most common, accounting for 10% of all musculoskeletal injuries for which medical attention was sought. Knee injuries were slightly more likely to occur to young and middle age adults (18 to 64 years) than to children and older persons. Injuries to the back were the second most common injury for which medical attention was sought. People age 18 to 44 years were most likely to have a back injury, while children rarely reported injuries to the back. Children were most likely to have an ankle injury that required medical attention. About 40% of persons reported an injury in multiple anatomic sites that required medical attention. (Reference Table 6A.1.1.2 PDF [7] CSV [8])
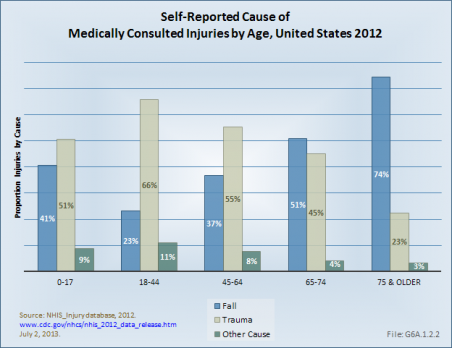
Although all are traumatic injuries, the NHIS separates falls from trauma caused by vehicular accidents, machinery, moving objects, and other types of traumatic injuries in self-reported data. Trauma was the most common cause of musculoskeletal injuries for which medical attention was sought, accounting for slightly more than half the injuries. This was particularly true for young adults age 18 to 44 years, when sports and activities can be the source of musculoskeletal injuries. However, for older persons, particularly those age 75 years and older, falls accounted for three in four injuries for which they sought medical attention. Males were also more likely to suffer an injury requiring medical attention as a result of trauma, while females reported falls and trauma about equally as the cause of the injury. (Reference Table 6A.1.2.1 PDF [9] CSV [10])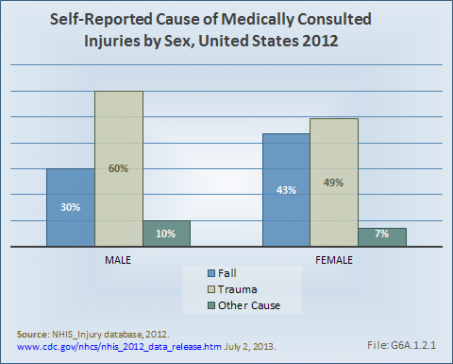
It has long been known that most accidents occur in or around the home. In 2012, people reported more than one-half of the injuries for which they sought medical treatment occurred in the home (31%) or outside the home or farm (21%). Other common places of injury are recreation sites, public streets, and sidewalks. The proportion of injuries that are musculoskeletal is highest for injuries incurred at recreation sites, including fields, courts, parks, lakes, and rivers. More than three of four injuries for these sites were musculoskeletal. Injuries occurring inside the home had the lowest ratio of being musculoskeletal. (Reference Table 6A.1.2.2 PDF [11] CSV [12])
The type of activity engaged in was not significantly different as a cause of musculoskeletal versus injuries to other body systems. More injuries occur when involved in non-sport leisure activities than any other activity. Sports and working in and around the home or other workplace are the cause of similar numbers of injuries for which medical care is sought. (Reference Table 6A.1.2.3 PDF [13] CSV [14])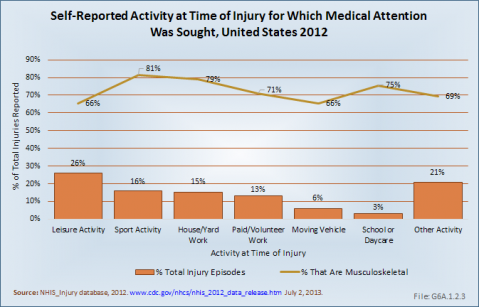
The annual National Health Interview Survey asks participants if they are limited in activities of daily living, such as the ability to dress oneself, to get in or out of bed or a chair, or to work due to health issues. For all health concerns,1 more than 13 in 100 people in the United States reported they had limitations in a prior three-month period due to health issues. Fractures accounted for 8% of the primary causes of limitation, resulting in limitation in 1 in 100 people in the United States. Among older women, those age 75 years and older, fractures rose to 10.3% of the total causes of limitations, but was only 6.4% for men. Fractures were responsible for limitations in daily activities in 14% of men in the age range of 45 to 64 years who reported limitations. Overall, women reported being limited due to fractures more often than men until they reached the age of 75 years or older. (Reference Table 6A.1.3.1 PDF [15] CSV [16])
Help required with routine needs was reported by 23% of people requiring help with activities of daily living; nearly one in three of those with a fracture reported needing help with routine needs. When broken down into specific types of help, help with personal care was identified more frequently than other types of care. Four of ten reported not being able to work at all due to health care issues, with half with a fracture unable to work. An additional one in four reported they were limited in the type of work that could be done. Walking without equipment was difficult for one-third of those with a medical problem, while one-half of those with a fracture required some sort of medical equipment to walk. (Reference Table 6A.1.3.2 PDF [17] CSV [18])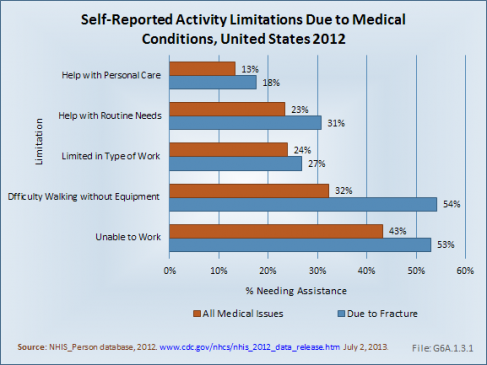
In order to compile a complete picture of the impact of musculoskeletal injuries, six major health care databases are used to estimate the number of visits to a health care provider in a specific year. Treatment episodes, for purposes of this study, have been defined as the accumulative total of cases for all diagnoses treated in physician offices, emergency departments, outpatient clinics, and hospital discharges. Diagnoses are based on variables within publicly available health care database that identify diagnoses or treatments based on ICD-9-CM codes submitted by health care providers. Databases used include from 3 to 25 diagnosis codes, or variables, per record. When analyzing the databases for a specific diagnosis or procedure, if any of the diagnosis variables in the database matches the code of interest, it is included in the total count. Hence, total numbers of injuries may exceed total records if more than one injury is sustained. In addition, health care visits, or episodes, are not the equivalent of patients, as there is some unknown probability that a person may have multiple visits over the year included in the database. While not an absolute, the numbers presented are a solid estimation of how a particular health care issue such as a musculoskeletal injury, compares to other health care issues.
Four of the databases included are produced by the National Center for Health Statistics (http://www.cdc.gov/nchs/index.htm [19]), a division of the Centers for Disease Control and Prevention, and include data on visits to physician offices (NAMCS), emergency departments (NHAMCS_ED), outpatient clinics (NHAMCS_OP), and hospital discharges (NHDS). These four databases include a representative sample that is weighted to reflect the U.S. population by demographic characteristics for the year from which the data is produced. The remaining two databases are produced by the Healthcare Cost and Utilization Project (HCUP: http://www.hcup-us.ahrq.gov/ [20] ) under the U.S. Department of Health and Human Services Agency for Research and Healthcare Quality. These two databases focus on hospital discharges (NIS) and visits to emergency departments (NEDS), and include millions of data points submitted by participating hospitals and emergency departments. HCUP data is also weighted for representativeness of the U.S. population. All databases are structured to provide only autonomous data. When the two databases were analyzed for hospital discharges and emergency department visits, they yielded similar results, supporting the validity of the findings reported.
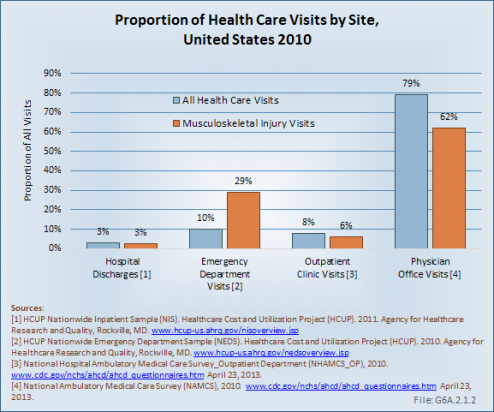
Musculoskeletal injuries accounted for 4% of health care visits to physician offices, outpatient clinics, and hospital discharges. Visits to emergency departments for musculoskeletal injuries accounted for 15% of all emergency department visits. Overall, more than 65 million health care visits were made in 2010 for musculoskeletal injuries. By far, the largest share of these visits was to physician offices, accounting for nearly 80% of all visits and for 62% of visits for musculoskeletal injuries. Emergency departments and outpatient clinics see similar percentages of total patients (10% [NHAMCS_ED] and 8% [NHAMCS_OP]), but emergency departments are more likely to see patients with a musculoskeletal injury. Hospital discharges account for about 3% of patient visits for all health care reasons and for musculoskeletal injuries. (Reference Table 6A.2.2.1 PDF [21] CSV [22])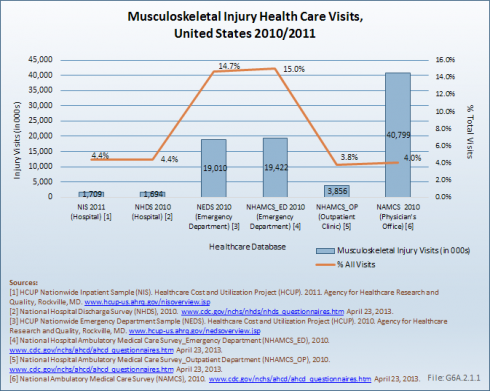
Three of four (77%) health care visits associated with an injury diagnosis are related to a musculoskeletal injury. The largest share is found in injury treatments in a physician's office, where four of five (81%) injuries treated are musculoskeletal. The smallest share, 68%, is for hospital discharges. (Reference Table 6A.2.2.4 PDF [23] CSV [24])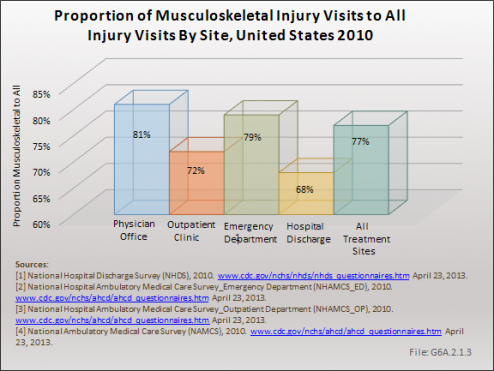
Females, in general, are more likely overall to have a health care visit than are males. With regard to musculoskeletal injury, however, this is true only for the category of health care visits related to hospital discharges, where females represent slightly more than their proportion in the general population. For other care sites, males represent a higher than expected proportion of visits for musculoskeletal injuries.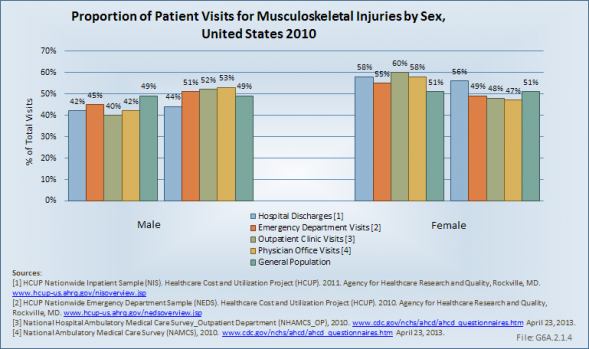
When it comes to age, persons 75 years and older are far more likely to have a hospital discharge for a musculoskeletal injury than those younger in age. Children, defined as those under the age of 17, utilize outpatient clinics for injury treatment more than persons of other age groups. Young adults between the ages of 18 and 44 years visit emergency departments more frequently for injury care, while their slightly older peers, those aged 45 to 64 years, visit physician offices most often. People aged 65 to 74 years comprise about the same proportion of the general population as those 75 years and older, but they make fewer health care visits for musculoskeletal injury treatment.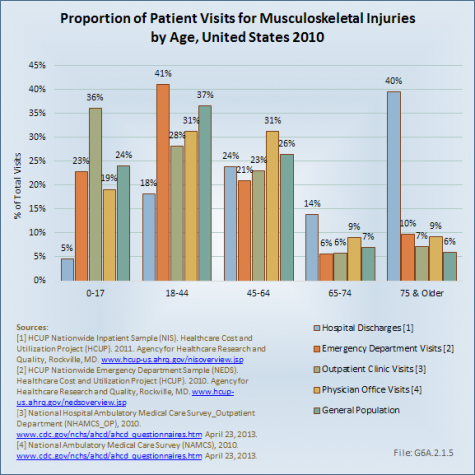
More than 18.3 million health care visits were for the treatment of fractures in 2010. A close second, sprains and strains accounted for 17 million health care visits. Contusions, open wounds, and dislocation visits numbered 9 million, 8 million, and 6.5 million, respectively. Other types of musculoskeletal injuries represented another 11 million visits. With the exception of contusions, musculoskeletal injuries are treated most frequently in a physician’s office. Nearly 5 million contusions were treated in emergency departments; this compares to 3.6 million treated in a physician's office. (Reference Table 6A.2.2.1 PDF [21] CSV [22], Table 6A.2.2.4 PDF [23] CSV [24], and Table 6A.2.2.5 PDF [25] CSV [26])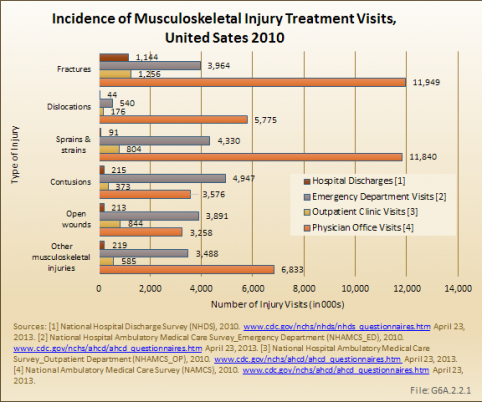
Males have a slightly higher rate of musculoskeletal injury than females, with 22.0 injury visits to all provider sites per 100 males in 2010. This compares to 20.5 injury visits per 100 females. The proportion of all musculoskeletal injury visits for males versus females is the reverse of that found in the general population: 51% male to 49% female injury visits versus the 49% to 51% male to female ratio found in the general population. Males are more likely to suffer open wounds (62%) and dislocations (56%). Females have correspondingly lower rates for these injuries, and an expected share of other types of musculoskeletal injuries.
Males have a higher rate of injuries seen in a physician's office, while females are more likely to be discharged from a hospital or seen in an emergency department because of a musculoskeletal injury. Because injuries for which a patient is hospitalized are potentially more severe than those seen in a physician office, it might be surmised that females may incur more severe musculoskeletal injuries.
(Reference Table 6A.2.2.1 PDF [21] CSV [22] and Table 6A.2.2.5 PDF [25] CSV [26])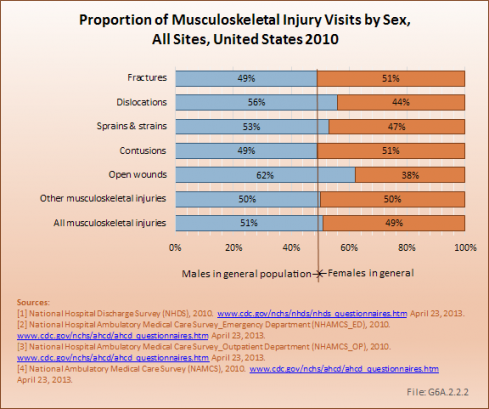
Age is also a factor in the rate of musculoskeletal injury health care visits, with the rate per 100 persons increasing from 19.5 for children (ages 0 to 17 years) to 33.9 for people age 75 years and older. This rate increase is found across all provider sites. However, because elderly people comprise a smaller share of the general population, the actual number of injuries for which treatment is delivered is much larger in the younger age brackets. Those aged 45 to 64 years, with 22.3 million visits, had the largest number of musculoskeletal injuries treated in 2010. Older people aged 65 to 74 years had just over 5 million injury visits, while those age 75 years and older accounted for 6.3 million episodes.
Elderly people are particularly prone to fractures, accounting for 23% of fractures treated in 2010, while representing only 6% of the general population. Overall, the elderly accounted for 12% of all musculoskeletal injuries. Those between the ages of 18 and 44 years are disproportionately prone to dislocations and sprains and strains requiring medical attention. (Reference Table 6A.2.2.2 PDF [27] CSV [28] and Table 6A.2.2.5 PDF [25] CSV [26])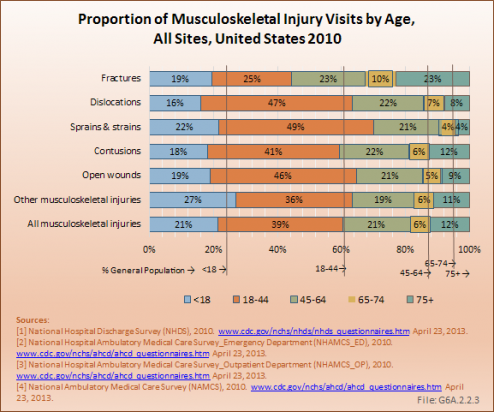
In 2010, a substantial majority of the 5.8 million dislocations (76%) were treated in physician offices. Dislocation of the knee or leg joint represented 86% of these injuries, with the shoulder (8%) the only other anatomic site to account for more than a very small fraction of dislocations. This finding is likely an artifact of an ICD-9 coding anomaly. Isolated acute ligamentous injuries of the knee, (ie, anterior cruciate ligament [ACL], medial collateral ligament [MCL], posterior cruciate ligament [PCL], and lateral collateral ligament [LCL] disruptions) are coded as dislocations using ICD-9-CM methodology, whereas equivalent injuries in other joints are coded as sprains or strains rather than dislocations. True complete dislocations of the knee joint are actually very rare, and associated with marked morbidity.
More than one-third (36%) of the 11.8 million sprain and strain injuries treated in physician offices in 2010 were to the back and sacroiliac joint. Shoulder (31%) and ankle and foot injuries (23%) represented the other two most common anatomic sites for sprains and strains treated in physician offices.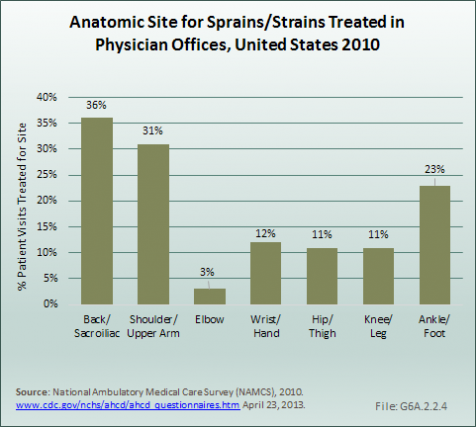
The total number of fractures of the upper and lower extremities treated in physician offices, emergency departments, and hospitals, while fluctuating from year to year, has varied between 12 million and 15 million from 1998 to 2010. Upper limb fractures, including those of the arm, forearm, wrist, hand, and fingers, have accounted for slightly more than one-half of all fractures, with a range of 52% to 59%. Fractures of the upper arm, or humerus, are the least common. In recent years, upper arm fractures have accounted for about 20% of total upper limb fractures. Fractures of the wrist, hand, and fingers occur slightly more often than fractures of the forearm.
Lower limb fractures, which include those of the hip and upper leg (femur), lower leg, ankle, foot, and toes, are reported in similar numbers to upper limb fractures, ranging from 11 million to 15 million. Between two-third and three-fourth of lower limb fractures occur in the ankle, foot, and toes. Breaks of the lower leg (tibia and fibula) are the least common overall.
The majority of fracture care episodes, 65% to 73%, occurred in a physician’s office. Fewer than one in ten fractures (8% or less) were treated with inpatient hospitalization in any given year. However, it is possible that initial care for a fracture was either at the ED or in a hospital admission, with follow-up visits associated with a physician’s office visit. It is, therefore, likely each individual fractures may have been associated with multiple episodes of care. (Reference Table 6A.2.3.1 PDF [29] CSV [30] and Table 6A.2.3.2 PDF [31] CSV [32])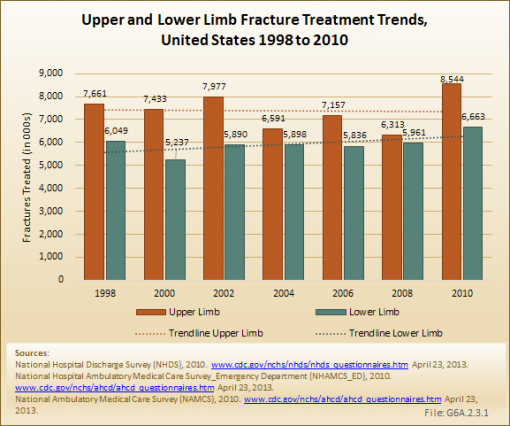
Unintentional injuries are tracked by the Centers for Disease Control and Prevention (CDC) through the Injury Center, and reported at WISQARS(TM).1 Injuries kill thousands every year, and many of those who survive have life-long impairment as a result of those injuries. Musculoskeletal injuries are the most common type of injury. While much of the focus has been on injury prevention, research to alleviate the impact of major trauma from vehicular accidents, falls, sports, and war injuries, among other causes, is necessary to reduce the burden.
The number of unintentional deaths from injuries has remained fairly steady since the early 2000s, with 110,000 to 120,000 deaths occurring as a result of injuries each year.1 However, the proportion of these unintentional deaths that occur as a result of a fall has been steadily rising since 2000, increasing from 14% of deaths in 2000 to 24% in 2010. The age-adjusted rate2 per 100,000 persons has increased from 4.8 to 7.8 for the same time frame.
The primary cause of this increasing proportion is due to deaths from falls in the aging population. Among persons age 65 years and older, the proportion of unintentional injury deaths from falls has risen from 33% to 52% between 2000 and 2010. There has been a slight rate increase from 12% to 14% among persons age 55 to 64 years. The proportion has remained relatively steady for persons under the age of 54 years. Unintentional injuries are the top cause of death for all persons age 1 to 44 years; the third highest cause for those age 45 to 54 years; fourth highest for those age 55 to 64 years; and ninth for those age 65 years and older.3 (Reference Table 6A.3.1.1 PDF [34] CSV [35])
In 2011, the death rate due to unintentional injury from falls remained at 22%. Females, however, experienced a higher death rate from falls than did males (29% versus 17%). Although the number of deaths from unintentional injury is similar across age groups, both sexes show a steep increase in deaths from falls with increasing age. Among children under age 18 years, the proportion of deaths from falls among all unintentional injury deaths is only 1.4%. Among persons age 85 years and older, it is 63%. (Reference Table 6A.3.1.2 PDF [36] CSV [37])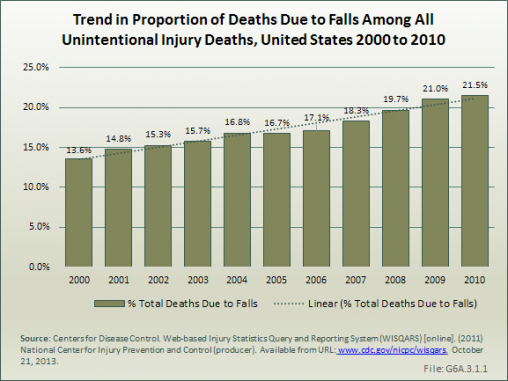
The CDC reported that 30 million unintentional injuries were treated in hospital emergency departments in 2011. Of these 30 million, 90%, or 27.2 million patients, were treated and released. The remaining 10% were hospitalized. These numbers are very similar to those reported in the national health care databases (29.1 million, 91% treated in the ED, 9% hospitalized). (Reference Table 6A.3.2.1 PDF [39] CSV [40])
Falls are the most common cause of nonfatal unintentional injuries, and are responsible for slightly more than 3 in 10 injuries overall. For injuries in which the person is hospitalized, falls account for nearly one in two. Other forms of trauma are described as the cause in the majority of injury visits to an emergency department in the national health care databases, accounting for 54% of all the injury visits. Among persons hospitalized, trauma other than falls was the cause in 27% of the discharges. The CDC breaks down the cause of unintentional injuries into more categories. (Reference Table 6A.3.2.4 PDF [41] CSV [42])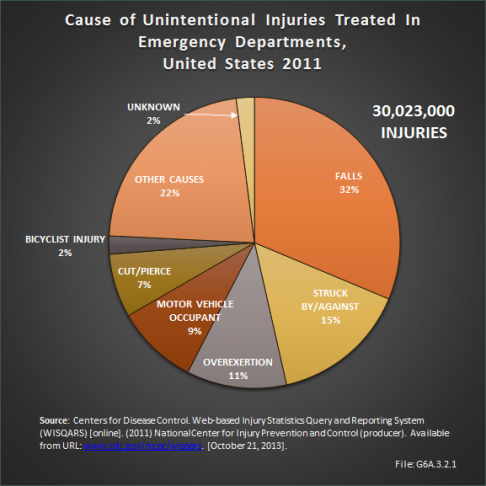
In 2011, the overall rate of visits to an emergency department for treatment of unintentional injuries was 87.2 per 1,000 persons. When visits for which the patient was hospitalized are included, the rate increases to 96.4 per 1,000, or roughly 1 in 100 persons who are treated for an injury in an emergency department in a given year. The rate per injury by cause varies significantly by age of the patient. For example, while falls have an overall rate of 29.7 per 1,000 persons, among persons age 74 to 85 years the rate increases to 64.9. For persons age 85 years and older, it jumps to 141.6 per 1,000. (Reference Table 6A.3.2.2 PDF [43] CSV [44])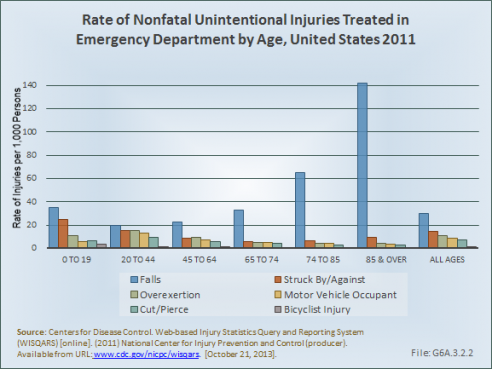
The Nationwide Inpatient Sample1(NIS) and Nationwide Emergency Department Sample2 (NEDS) produced by HCUP include data on hospital stays and disposition of patients from hospital and ED visits. This information is used to provide an estimate of the cost related to hospitalization, and the need for additional care by some patients.
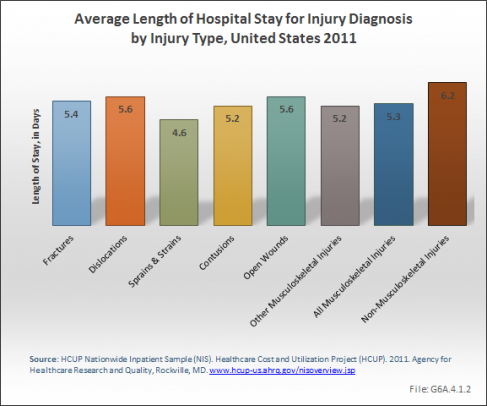
The average length of stay for hospital discharges with any injury diagnosis was approximately 6 days in 2011. Injuries other than musculoskeletal had a slightly longer length of stay of just over 6 days, while musculoskeletal injury patients had an average of slightly more than 5 days. Increasing age was associated with a longer stay, with the longest average stays reported by persons in the 45- to 74-year range. The type of injury also had an impact on length of stay, with open wounds resulting in the longest hospital stay among musculoskeletal injuries. The range for all types of injuries varied between 4 and 7 days. (Reference Table 6A.4.1.1 PDF [47] CSV [48])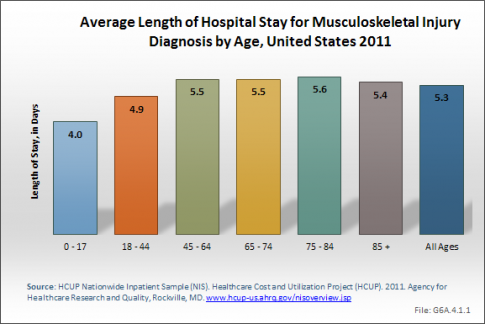
Average hospital charges1 were also slightly higher for patients with non-musculoskeletal injuries, which include brain and spinal injuries, with the exception of average charges for fracture injury patients. However, because of the much higher number of musculoskeletal injury patient stays, the overall total hospital charges for treatment of musculoskeletal injuries were almost twice those of non-musculoskeletal injuries in 2010.
Average total hospital charges for musculoskeletal injuries were $48,700, while they were $52,900 for non-musculoskeletal injuries. The highest average hospital charges were $73,300 for those aged 18 to 44 hears being treated for dislocations.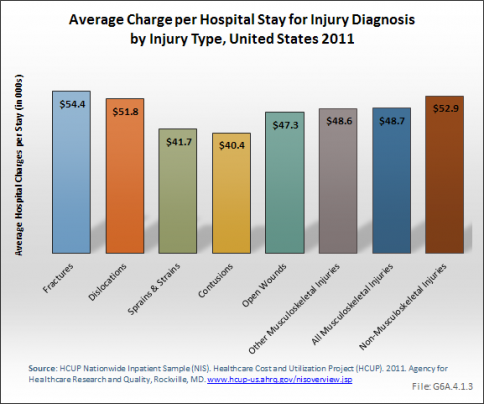
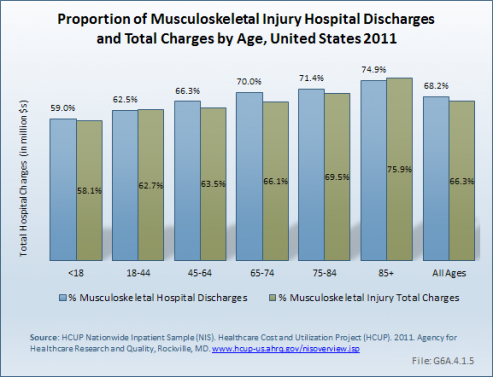
Total cost for inpatient hospital care for injuries in 2011 was more than $123 million, with musculoskeletal injuries accounting for two-thirds of this total. Fractures, with more than $59.5 million in total hospital charges in 2011, accounted for 72% of musculoskeletal injury charges and nearly one-half (48%) of all injury charges. Increasing age was associated with a steady increase in the proportion of charges for musculoskeletal injury to all injury hospital discharges and in the share of total charges.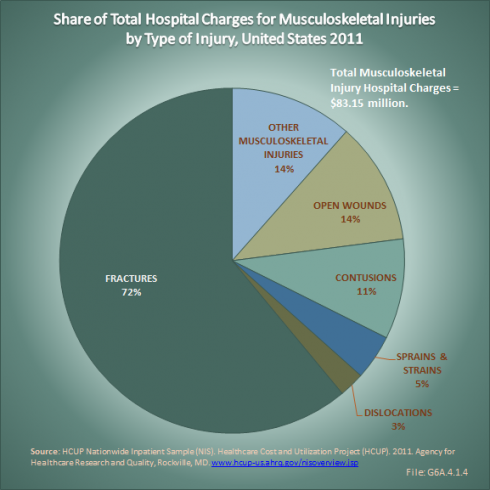
Hospital charges are only part of the cost burden associated with musculoskeletal injuries. Nearly one-half of people discharged from a hospital following an injury are discharged to another type of care facility, such as a short-term, skilled nursing, or intermediate care facility. Still another 13% receive home health care following discharge. These ratios are substantially higher than for all hospital discharges, where 70% of patients are discharged to home without additional care.
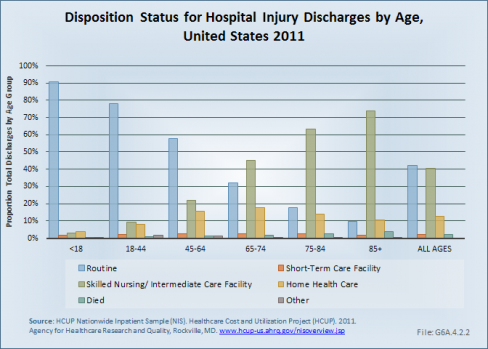
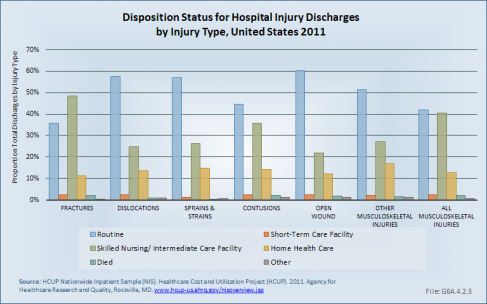
Age is clearly a factor in the type of hospital discharge received. By the age of 85 years and older, only 10% of hospital discharges for musculoskeletal injuries are to home without additional home health care, with 76% being discharged to another type of care facility and 10% receiving home health care. With the exception of those under the age of 18 years, fracture injuries are the most likely to result in discharge to additional care. After the age of 45 years, fractures to the lower limb are most likely to result in discharge to additional care, while for those younger than 45 years, a torso fracture is the most likely diagnosis to require additional care. (Reference Table 6A.4.2.1 PDF [49] CSV [50], Table 6A.4.2.3 PDF [51] CSV [52], and Table 6A.4.2.5 PDF [53] CSV [54])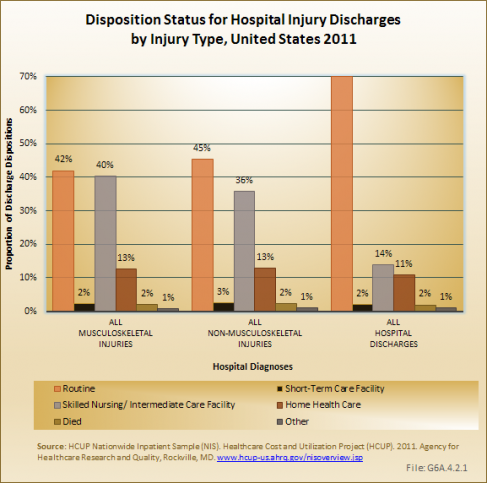
Among those seen in an ED for injury treatment overall, 8% to 9% are admitted to a hospital for further care. About 1% will be sent to a skilled nursing or intermediate care facility. Again, as the age of the patient increases, so does the likelihood of being admitted to the hospital from the ED or being sent to a skilled or intermediate care facility. Very few patients are referred to home health care from the ED. Type of injury follows the same pattern as hospital discharges, with fractures the most likely type of injury to require additional health care outside the ED. Fractures to the torso result in more hospital admissions than upper or lower limb fractures overall, but lower limb fractures for persons age 65 years and older account for more hospital admissions. (Reference Table 6A.4.2.2 PDF [55] CSV [56], Table 6A.4.2.4 PDF [57] CSV [58], and Table 6A.4.2.6 PDF [59] CSV [60])
Every year, musculoskeletal injuries result in hundreds of millions of days spent in bed1 or missed work2 for the millions of persons suffering the injuries. In 2012, 57.5 million adults aged 18 years and older reported spending an average of more than 9 days in bed, for a total of 528 million bed days, due to a musculoskeletal injury. Musculoskeletal injuries accounted for 70% of self-reported bed days for all medical conditions in 2012. The most common musculoskeletal conditions for which persons reported days in bed were back or neck pain (average of 12.3 days in bed) and arthritis/rheumatism (average of 10.3 bed days). Together, these conditions accounted for nearly 3 in 4 days spent in bed because of a musculoskeletal condition. With respect to bed days, age is not a factor in increasing numbers, as persons aged 65 years and older report fewer bed days for all musculoskeletal conditions, and for all medical conditions, than those younger than 65 years. (Reference Table 6A.5.1 PDF [61] CSV [62] and Table 6A.5.3 PDF [63] CSV [64])
Work days lost due to medical conditions were reported at more than 216 million days, based on average lost. As with bed days, musculoskeletal conditions accounted for 70% of the work days reported lost. Back and neck pain was reported as the cause of one-third of the lost work days, with arthritis and rheumatism accounting for another quarter of days. Not unexpectedly, persons age 65 years and older reported fewer lost work days than did younger persons, in part because many are out of the work force already. Although males reported one day longer, on average, of time away from work due to a medical cause, the lower number of males reporting lost work days resulted in females having a slightly higher share of total days lost. This was also true for musculoskeletal conditions, with fewer males reporting work days lost than females, but with a higher average of days lost per person. (Reference Table 6A.5.2 PDF [65] CSV [66] and Table 6A.5.3 PDF [63] CSV [67])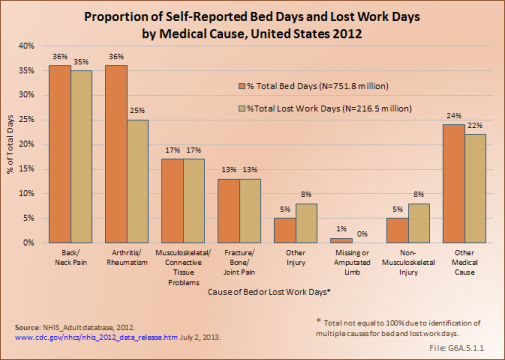
Workplace injuries are tracked by the U.S. Department of Labor, Bureau of Labor Statistics, with data published annually on these injuries (http://www.bls.gov/news.release/osh2.toc.htm [68]). Musculoskeletal workplace injuries include fractures, bruises/contusions, and amputations, as well as musculoskeletal disorders (MSDs). MSDs are often cumulative and include repetitive motion injuries that occur when the body reacts to strenuous repetitive motions (ie, bending, climbing, crawling, reaching, twisting) or overexertion. MSD injuries include sprains, strains, tears, back pain, soreness, carpal tunnel syndrome, hernia, and musculoskeletal system and connective diseases. MSD cases are more severe than the average nonfatal workplace injury or illness, typically involving an average of several additional days away from work. In 2011, the median number of days away from work for all workplace injuries was 8 days; for MSD injuries, the median was 11 days. (Reference Table 6B.2.1 PDF [69] CSV [70])
The rate of nonfatal occupational injuries and illnesses has significantly decreased over the past 18 years, in some part potentially because of heightened attention to workplace safety. In 1992, more than 2.3 million cases of work-related injuries and illnesses were reported by the Bureau of Labor Statistics. By 2010, the number had dropped to 933 thousand. A similar decline has been seen in the number of MSD injuries; however, the relative percentage of MSD injuries to all workplace injuries has declined only a few percentage points. In the 1990s and early 2000s, one in three workplace injuries was a MSD injury. For the last five years, this ratio has hovered around 30%.
Males sustain workplace injuries at twice the rate of females. They also are away from work an average of 2 days longer than females after a workplace injury. It is likely that at least a portion of the reason for this difference is the type of work involved, with males working more frequently in industries where a workplace injury is more common. (Reference Table 6B.1.1 PDF [71] CSV [72] and Table 6B.1.2 PDF [73] CSV [74])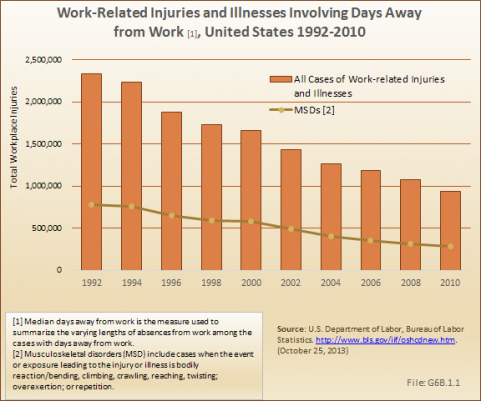
The type of workplace injury is a major factor in defining the median number of associated days away from work. Fractures have historically, and remain, the injury associated with the highest number of days away from work. In the late 1990s, a median of 20 to 21 days away from work were reported for a fracture; since the early 2000s, the median days away has been about 30. Carpal tunnel syndrome is a close second in terms of days away from work, but the median has fluctuated between 21 and 32 days over the years 1997 to 2010, with no discernible trend pattern. Amputations and tendonitis are the remaining two injury types that are associated with a median of more than 10 days away from work.
Workers between the ages of 35 and 54 years sustain the largest number of nonfatal occupational injuries that involve days away from work, possibly reflecting the ages found in the workforce. Days away from work by type of injury reflected the distribution of workers by age, with the exception of carpal tunnel syndrome, where a larger proportion of days away from work was reported for workers between ages 45 and 54 years. (Reference Table 6B.2.1 PDF [69] CSV [70] and Table 6B.2.2 PDF [75] CSV [76]) ![Median Days Away from Work [1] for Nonfatal Injuries by Nature of Injury, United States 2010 Median Days Away from Work [1] for Nonfatal Injuries by Nature of Injury, United States 2010](https://bmus.latticegroup.com/docs/resize/G6B.2.1-509x509.png)
Workers often sustain injuries that affect multiple parts of their body. However, injuries to the upper extremities (shoulder, arm, wrist, hand), trunk (including the back), and lower extremities (knee, ankle, foot, toe) far outnumber injuries to the head, neck, other body systems, and multiple parts of the body. About one-third of workplace injuries involving days away from work involve the upper extremities, with hand injuries the most common. Trunk and lower extremity injuries each account for about a fourth of all injuries. Knee injuries are the most common lower extremity injury. Back injuries account for three-fourths of trunk injuries. (Reference Table 6B.3.1 PDF [77] CSV [78])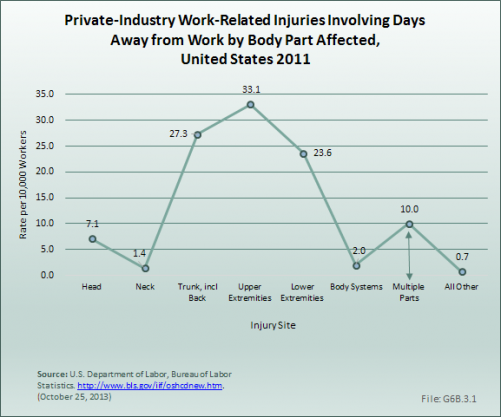
An estimated 30 million children and adolescents participate in organized sports. In addition, some 150 million adults participate in physical activity that is not related to their employment. However, both of these large at-risk populations lack a mechanism for tracking injuries.
While professional and collegiate athletics have epidemiologic systems in place to track injury patterns, recreational athletics lack any type of surveillance system. However, the US Consumer Product Safety Commission has established the National Electronic Injury Surveillance System [79] (NEISS) in 1997 to track emergency room visits and injury patterns associated with specific products. This database has also been helpful as a means of documenting injuries associated with athletic endeavors.
Using the data, a 2002 CDC report detailed 4.3 million sports- and recreation-related injuries that were treated in US Eds.1 Injury rate was highest for boys aged 10 to 14 years. A more recent paper documented an estimated 600,000 knee injuries annually in EDs in the United States. Of these, 49.3% resulted from sports and recreation activities.2
An estimated 2.8 million injuries resulting from individual sports are reported annually in EDs in the United States, of which 64% are musculoskeletal. Two out of three musculoskeletal injuries occur in males, with the proportion slightly lower for individual sports than for team sports.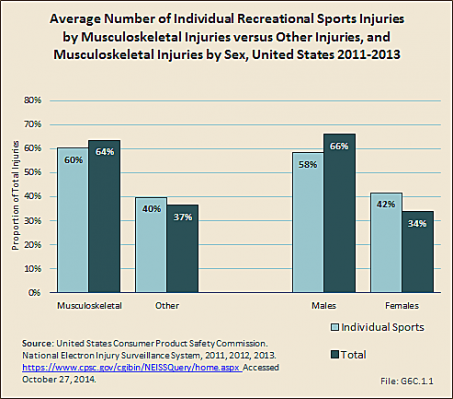
Cycling and wheeled sports account for 22% of all recreational sports injuries and musculoskeletal injuries serious enough to warrant a visit to the ED. Fitness training results in additional 16% of the total injuries and musculoskeletal injuries seen. Musculoskeletal injuries account for more than one-half of all injuries in all sports, with the exception of water sports. (Reference Table 6C.1 PDF [80] CSV [81])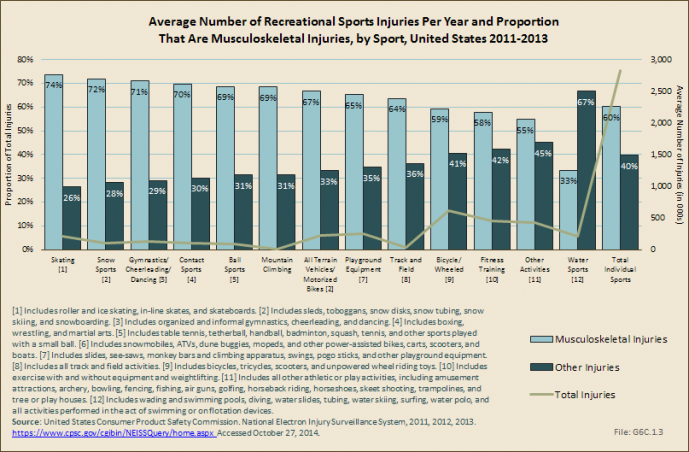
Musculoskeletal injuries treated in the ED as a result of a recreational sport injury occur in the highest proportion in children aged 2 to 12 years. This is in large part due to the high number of playground injuries, as well as biking and other wheeled equipment such as skate boards and scooters. Adults between the ages of 25 and 44 account for a substantial proportion of treated musculoskeletal injuries, but they also are a larger share of the population and more likely to be active in recreational sport activities. (Reference Table 6C.2 PDF [82] CSV [83])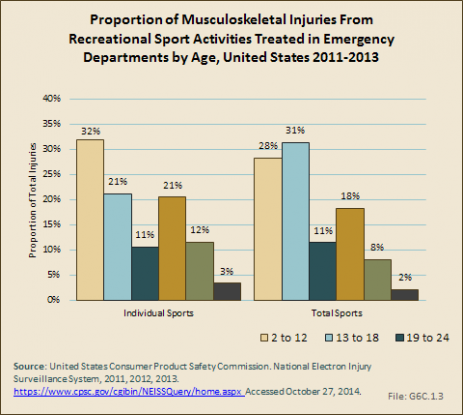
An estimated 37% of musculoskeletal injuries from athletic mechanisms result in sprains or strains, while fractures comprise 32% and contusions 27%. (Reference Table 6C.3 PDF [84] CSV [85])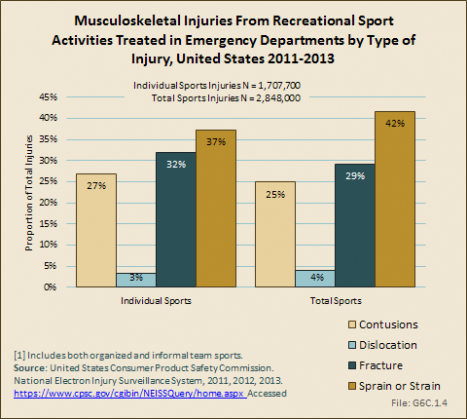
Injuries to the extremities are the most common, with 41% occurring in the upper extremity, compared with 34% in the lower extremity. The trunk sustains most of the remaining injuries, with less than 7% involving the head. (Reference Table 6C.4 PDF [86] CSV [87]; Table 6C.7 PDF [88] CSV [89])
Nearly all sports injuries seen in the ED are treated and released to home. Fewer than 4% of recreational sports injuries result in hospitalization. Injuries from all-terrain vehicles and motorized bikes result in the highest hospitalization rate (7%) among individual sports, followed by 5% for injuries from nonmotorized wheeled activities (bicycles, skateboards, scooters, etc.). About 1 in 25 playground injuries results in hospitalization. (Reference Table 6C.5 PDF [90] CSV [91])
Scholastic sports has seen an 80% increase in participation between 1971 and 2005. These high school athletes experience an estimated 2,000,000 injuries, 500,000 doctor visits, and 30,000 hospitalizations per year.
Using the NEISS dataset, more than 1.6 million injuries occurring as the result of team sports were reported in EDs in the United States annually in the three years studied. Musculoskeletal injuries comprised 69% of team sport injuries seen in the ED. The team sports causing the most injuries are basketball and football, which comprise 33% and 28%, respectively, of all injuries seen. (Reference T6C.1 PDF [80] CSV [81])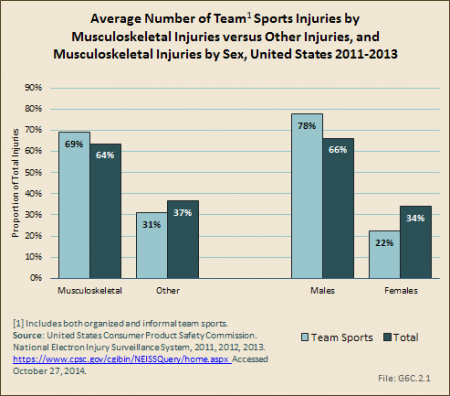
Volleyball has the highest proportion of musculoskeletal injuries among the team sports, but accounts for a small number of total injuries. Hockey sports injuries, including field, ice, and roller hockey, are split about evenly between musculoskeletal injuries and other types of injuries. (Reference T6C.1 PDF [80] CSV [81])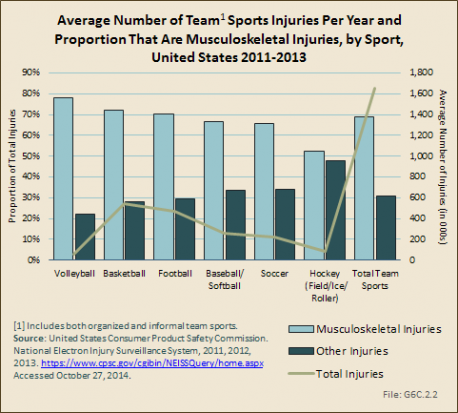
Musculoskeletal injuries seen in emergency departments occur most frequently (47%) within team sports in children between the ages of 13 and 18 years, the age at which many are participating in Little League and high school sports. Injuries from volleyball are more likely in this age group than other sports, but all team sports show about one-half of injuries seen in the ED within this age group. (Reference T6C.2 PDF [82] CSV [83])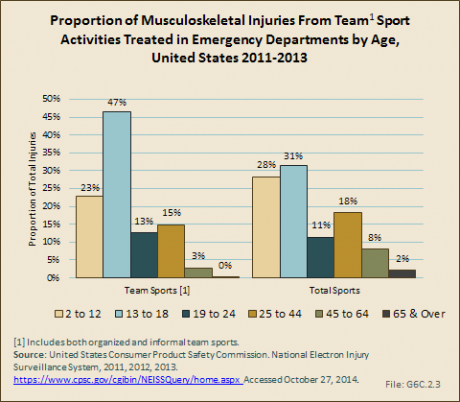
Nearly one-half (48%) of musculoskeletal injuries occurring while participating in team sports result in sprains or strains. Fractures occur in one in four injuries (25%), while contusions result in 22% of cases. (Reference Table 6C.3 PDF [82] CSV [85])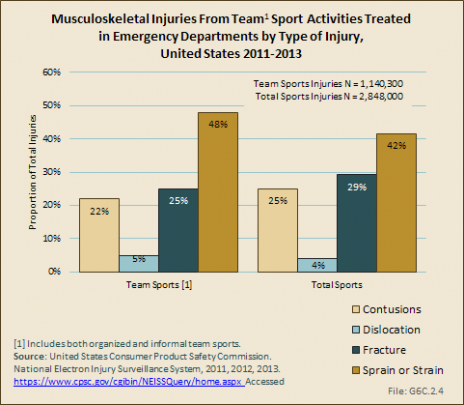
The majority of team injuries (84%) occur to the extremities. (Reference Table 6C.4 PDF [86] CSV [87]) Only 1% of team sport injuries results in hospitalization, with soccer injuries the most likely a cause for hospitalization (1.6%). (Reference Table 6C.5 PDF [90] CSV [91])
Another dataset created in 2004 to track scholastic sports injuries, the Reporting Information Online [92] (RIOTM), also provides quality epidemiologic information entered by athletic trainers associated with participating schools. Data from the 2005–2006 academic year suggests that injuries resulting from competition were 2.7 times higher than from practice, with boys’ football having the highest injury rates, both in practice as well as games.1
While less data on long-term health impact is available on scholastic athletes, one such study by McLeod and colleagues offers insight into the significant impact of athletic injury in this large population.2 They studied a convenience sample of 160 uninjured and 45 injured scholastic athletes with health-related quality-of-life measures. They found significantly lower scores among the injured athletes for the following subscores of the Quality of Life Short Form Questionnaire (SF-36)3: physical functioning, limitations due to health problems, bodily pain, social functioning, and the physical composite score. These findings suggest that physical injuries in our young athletes affect not only their physical function and risk for future musculoskeletal disability, but also extend beyond the physical aspects of overall health.
The National Collegiate Athletic Association [93] (NCAA)1 is comprised of nearly 1,100 member schools that compete in three division levels. More than 375,000 student athletes participate in NCAA sports that offer national championships annually, and this number continues to grow.2 During the 2013–2014 academic year, the number of teams competing in NCAA championship sponsored sports reached an all-time high of 19,086.
While there are numerous benefits associated with participating in collegiate athletics, there is also an increased risk of injury associated with participating in many types of sports. These injuries primarily affect the musculoskeletal system in general, and the lower and upper extremities specifically. Although awareness of risk of injury associated with participating in collegiate athletics is growing, there is little known about the long-term impact of injuries sustained while participating in collegiate athletics. Recent injury data from the NCAA Injury Surveillance System [94], as well as reports for specific joint injuries sustained by NCAA athletes and emerging data on the potential long-term impact of these injuries on health-related quality of life is presented.
For more than 30 years the NCAA, and since 2009 the Datalys Center [95], have been engaged in active injury surveillance within the unique population of college athletes. The collaborative effort between the NCAA and the National Athletic Trainers’ Association [96] (NATA) has yielded rich injury surveillance data used to develop important rule changes to protect player safety.3 In a 2007 special issue of The Journal of Athletic Training, data from the NCAA injury surveillance system from the 1988–1989 academic year through the 2003–2004 academic year were reviewed for 15 collegiate sports.4 With permission from the publisher, data from this study is included in this site. To read the full article, click here [97].
The 15 sports examined included five fall sports (men’s football, women’s field hockey, men’s soccer, women’s soccer, and women’s volleyball), six winter sports (men’s basketball, women’s basketball, women’s gymnastics, men’s gymnastics, men’s ice hockey, and men’s wrestling), and five spring sports (men’s baseball, men’s football, women’s softball, men’s lacrosse, and women’s lacrosse). Data for men’s spring football were only included in the analysis of practice injuries. These data provide insight into the burden of musculoskeletal injury experienced by collegiate athletes.
Hootman et al4 provided an overall summary of the NCAA data from the years 1988–1989 through 2003–2004, and made recommendations for injury prevention initiatives. Some of these data are highlighted in this section. CDC, which estimates 2.6 million children ages 0 through 19 years are treated in EDs each year for sports- and recreation-related injuries5, provides tips on how to prevent sports-related injuries in their Protect the Ones You Love Initiative [98].
Overall, incidence rates for the 15 sports examined range from a high of 35.9 per 1,000 game athlete exposures for men’s football to a low of 1.9 for men’s practice basketball. Among men, the highest injury rates were observed in football, wrestling, soccer, and ice hockey. Among women, the highest injury rates were experienced in soccer, gymnastics, ice hockey, and field hockey. (Reference Table 6C.9 PDF [100] CSV [101])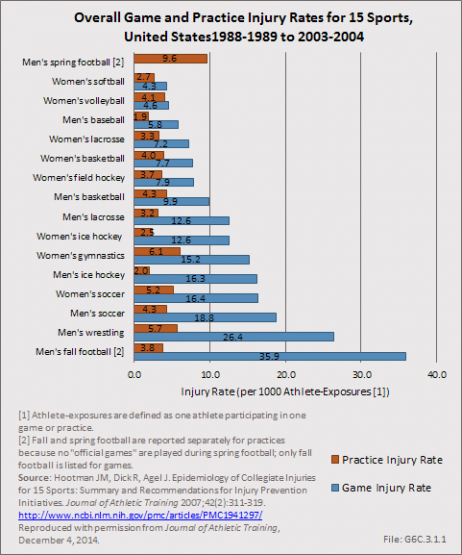
When data for all 15 sports are combined, injury rates are significantly higher in games (13.8 injuries per 1,000 athlete exposures) when compared to practice (4.0 injuries per 1,000 athlete exposures). Pre-season practice injury rates were significantly higher when compared to in-season or post-season training sessions. (Reference Table 6C.8 PDF [102] CSV [103])
Combined injury rates for all 15 NCAA sports studied remained relatively stable over time. No significant changes were observed in injury rates during games or practices over the 16-year study period. (Reference Table 6C.10 PDF [104] CSV [105])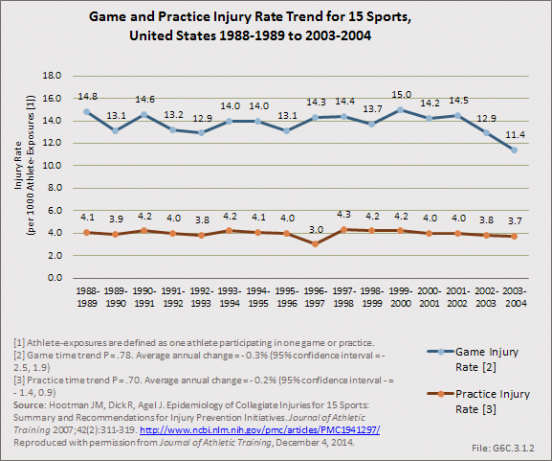
The majority of injuries resulted from contact with another player, regardless of whether or not injuries were sustained in practices or games. (Reference Table 6C.11 PDF [106] CSV [107])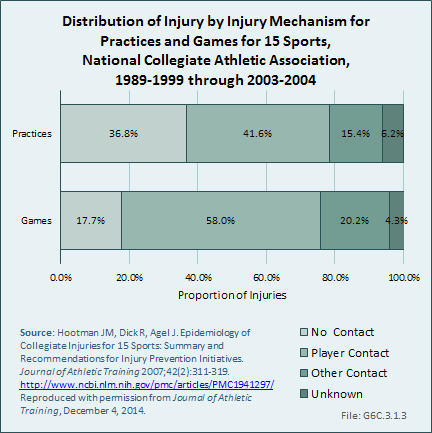
The majority of injuries documented during the study period affected the musculoskeletal system, with 72% of all injuries in games and 75% of all injuries in practices affecting the extremities. Regardless of whether injuries occurred in practices or games, more than one-half of all injuries reported across the 15 sports examined during the study period were to the lower extremity. (Reference Table 6C.12 PDF [108] CSV [109])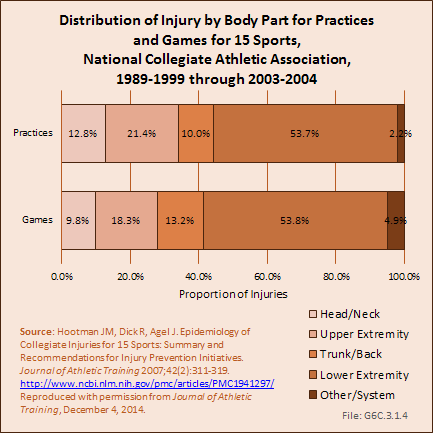
The NCAA injury surveillance system has also been used to examine the incidence and injury patterns of specific injuries among collegiate athletes.1,2 These studies have primarily focused on those injuries that likely have the greatest burden in terms of time loss from sport, the need for surgical intervention, and the potential for long-term impact on health. Specifically, joint injuries have been a primary concern, as it is well documented that these injuries can lead to chronic instability and increase the risk of osteoarthritis and degenerative joint disease.
Acute traumatic anterior cruciate ligament (ACL) injuries in the knee often lead to chronic pain and instability, and generally require surgical repair to restore function. There is also substantial evidence to suggest that acute traumatic knee joint injuries such as ACL tears significantly increase the risk for post-traumatic osteoarthritis. Several studies have focused on the rate of ACL injuries among collegiate athletes.1,3,4,5,6 Hootman et al6 estimated that approximately 2,000 athletes participating in 15 different men’s and women’s NCAA sports sustain an ACL tear annually. The average annual rate of ACL injury during the 16-year study period examined was 0.15 per 1,000 athlete-exposures. Arendt and Dick4 first reported that there were disparities in ACL injury incidence rates between males and females participating in the NCAA gender matched sports of soccer and basketball. This observation was confirmed in a follow-up study that examined data from 1990 through 2002.3 in male soccer players, Hootman et al6 reported that ACL injury rates among males and females combined, participating in 15 different NCAA sports, significantly increased during the 16-year study period. On average, they reported a 1.3% annual increase in the rate of ACL injury over time (P=0.02). (Reference Table 6C.14 PDF [110] CSV [111])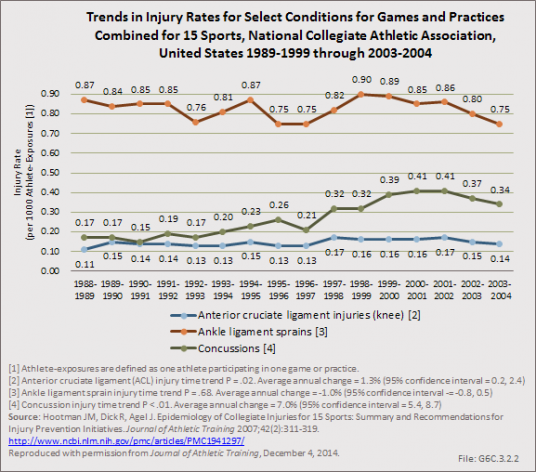
Dragoo et al7 compared ACL injury rates between NCAA football players participating on artificial turf and those participating on natural grass. They reported that the rate of ACL injury on artificial surfaces was significantly higher (1.39 times higher) than the injury rate on grass surfaces. They also noted that non-contact injuries occurred more frequently on artificial turf surfaces (44.29%) than on natural grass (36.12%).
Ankle sprains are also common among NCAA athletes and they frequently lead to chronic pain, instability, and functional limitations. Hootman et al6 estimated that approximately 11,000 athletes participating in 15 different men’s and women’s NCAA sports sustain an ankle sprain annually. The average annual rate of ankle sprain injury during the 16-year study period examined was 0.86 per 1,000 athlete exposures. They also examined the annual injury rates for ankle sprains among males and females participating in these sports combined between 1988 and 2004 and reported that injury rates remained constant during the 16-year study period. On average, there was a nonsignificant 0.1% (P=0.68) annual decrease in the rate of ankle sprains during the study period. (Reference Table 6C.13 PDF [112] CSV [113])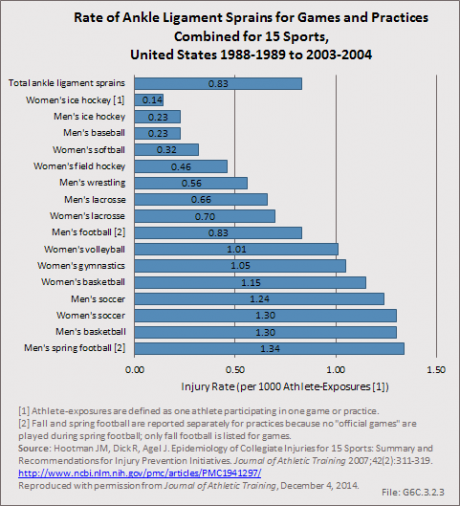
Shoulder instability also impacts a significant number of NCAA athletes and can lead to chronic pain, recurrent instability, and functional limitations. Recurrent shoulder instability has also been associated with the increased risk of osteoarthritis in the shoulder. Surgical reconstruction is common following shoulder instability in young athletes. Owens et al2 examined the injury rates and patterns for shoulder instability among NCAA athletes over the 16-year period from 1988 through 2004 in the same 15 sports described previously. The overall injury rate for shoulder instability during the study period was 0.12 per 1,000 athlete exposures. On average, this is comparable to just under 2,000 shoulder instability events experienced annually in NCAA athletes. Injury rates for shoulder instability were significantly higher in games when compared to practice. Overall, NCAA athletes were 3.5 (95%CI: 3.29–3.73) times more likely to experience shoulder instability events in games when compared to practices. Just over half (53%) of the shoulder instability events documented during the study period were first-time instability events, with the remaining injuries being recurrent instability events (47%). The majority of shoulder instability events were due to contact with another athlete (68%) and other contact (20%). Nearly half (45%) of all shoulder instability events experienced by NCAA athletes during the study period resulted at least 10 days of lost playing time, with the remainder returning to play within 10 days of injury.
While we still have a rudimentary understanding of the impact that musculoskeletal injuries sustained by collegiate athletes have on long-term health outcomes, studies have recently begun to examine health related quality of life in current and former NCAA athletes. McAllister et al1 evaluated health-related quality of life in NCAA Division I athletes using the SF-36, and examined the association between scores and injury history and severity. Collegiate athletes who reported a history of mild injury had significantly lower physical component summary scale scores, role physical scores, bodily pain scores, social function scores, and general health scores on the SF-36 when compared to those with no history of injury. Collegiate athletes who reported a serious injury had significantly lower scores on all SF-36 component scores when compared athletes with no history of injury. Similar results were observed in a separate study that examined NCAA Division I and Division II athletes.2
More recently, studies have examined health-related quality of life in former NCAA athletes. Sorenson et al3 reported that former NCAA Division I athletes were significantly more likely to have joint-related health concerns when compared to non-athletes, and were 14 times more likely to seek professional treatment for their symptoms. They also reported that the prevalence of joint-related health concerns was significantly higher in older former athletes when compared to younger former athletes.
In a similar study, Simon et al4 examined health-related quality of life in former NCAA Division I athletes and former non-athletes using the Patient-Reported Outcomes Measurement Information System (PROMIS).5 They reported that former collegiate athletes report significantly worse scores for five of the seven PROMIS scales examined when compared to non-athletes. Specifically, former athletes reported poorer scores on the physical function, depression, fatigue, sleep disturbances, and pain interference scales. There were no differences noted between former NCAA athletes and non-athletes for the anxiety and satisfaction with participation in social roles scales. The authors also noted that former collegiate athletes reported significantly more major injuries, chronic injuries, daily limitations, and physical activity limitations when compared to non-athletes.
Overall, these studies suggest that NCAA athletes who sustain injuries during their college years have significantly lower health-related quality-of-life scores, and that these scores may get worse with time, particularly for join- related health issues and long-term major and chronic injuries. Decreased health-related quality of life in former college athletes may also contribute to greater daily activity and physical activity limitations when compared to non-athletes and may lead to significant chronic health comorbidities. Further research is needed to determine which factors contribute to the poorer health-related quality of life outcomes observed among former collegiate athletes in these studies.
In 2012, there were approximately 370 injury-related deaths, 5,000 injury-related hospitalizations (3,000 acute injuries and 2,000 injury-related musculoskeletal conditions), and 661,000 injury-related outpatient visits (245,000 acute injuries and 415,000 injury-related musculoskeletal conditions).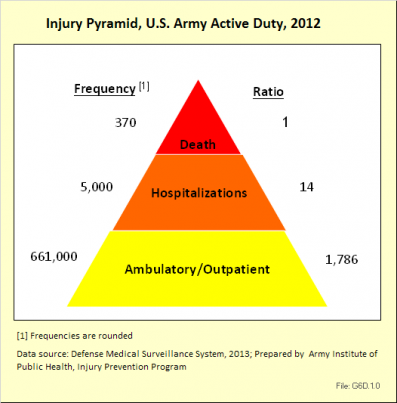
Fatalities have been a major focus of injury prevention activities in the past. As illustrated by these data, however, there are far more injury-related hospitalizations and outpatient visits than deaths. These nonfatal outcomes result in significant losses in duty time and manpower for the Army.
In 2012, injuries accounted for approximately 30% of all medical encounters. Injuries were the leading cause of medical encounters and affected more individuals than all other medical conditions, including mental health disorders.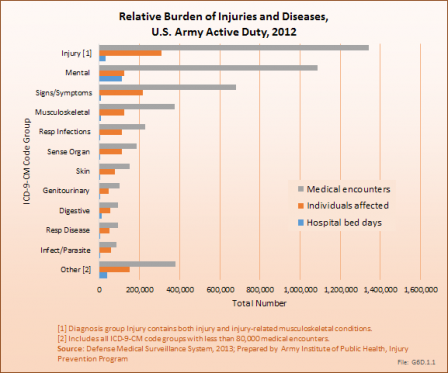
Rates of all injury visits among nondeployed active duty soldiers climbed slightly between 2006 and 2012. During this period, more than half the injury visits were due to lower extremity overuse injuries.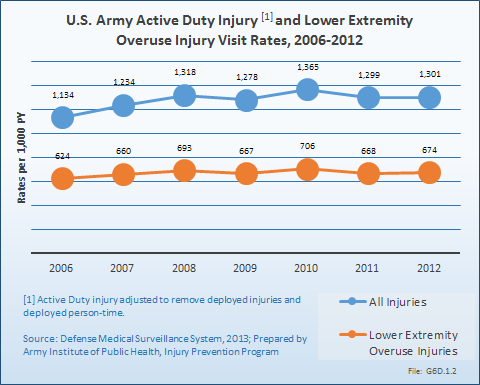
In 2012, out of approximately 39,000 incident hospitalizations, three major diagnoses groups accounted for over half of all admissions (56%). The top three reasons for hospitalization were mental disorders (27%), pregnancy-related issues (17%), and injuries and injury-related musculoskeletal conditions (12%).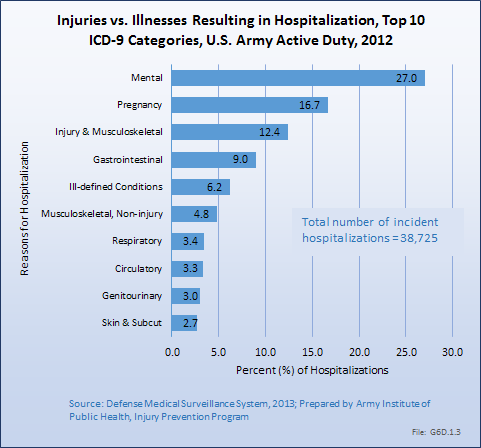
A total of 2,511,276 unique outpatient visits were made by active duty Army personnel. Injuries and injury-related musculoskeletal conditions were responsible for 26%, or more than 660,000, of visits.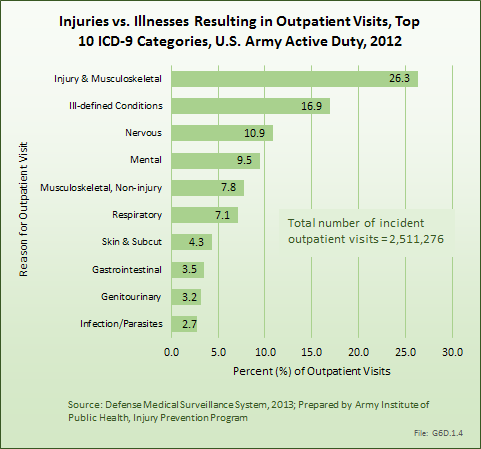
Acute injuries among active duty, nondeployed US Army soldiers are characterized by the types of injuries incurred, as well as the bodily site of the injuries. Two types of analytical injury matrices are available to further describe acute injuries and injury-related musculoskeletal conditions: (1) the Barell Injury Diagnosis matrix1 and (2) the injury-related musculoskeletal conditions matrix.2 Matrices report ICD-9-CM code frequencies by type of injury and body region. (Reference Table 6D.1 PDF [114] CSV [115] and Table 6D.2 PDF [116] CSV [117])
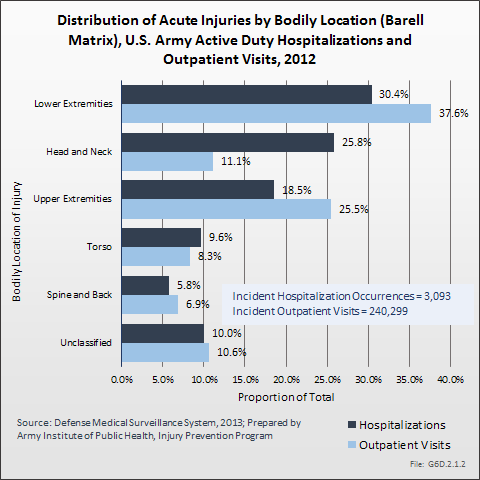
In 2012, there were 3,093 acute traumatic injuries (coded in the 800–900 ICD-9-CM code series) requiring hospitalization. Leading specific reasons for hospitalizations included fractures of the lower leg and/or ankle (13 %), facial fracture (6%), and fracture of the foot/toes (3%). Comparing all body regions, the lower extremity accounted for 30%, the upper extremity for 19%, and the head for 16%. Within the head region, traumatic brain injury, including skull fracture, accounted for 15%, and other specified head injuries accounted for less than 1%. (Reference Table 6D.1 PDF [114] CSV [115])
During the same year, US Army active duty, nondeployed soldiers incurred 240,299 acute traumatic injuries (coded in the 800–900 ICD-9-CM code series) for which outpatient care was required. Leading specific reasons for outpatient visits included strains/sprains to the lower leg and/or ankle (9%) and strains/sprains of the shoulder/upper arm (7%). Body regions most affected were lower extremities (38%), upper extremities (26%), and the head and neck region (TBI and other head, face, and neck) (11%). (Reference Table 6D.2 PDF [116] CSV [117])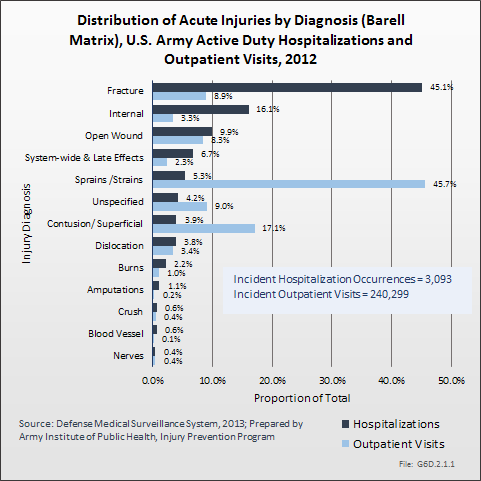
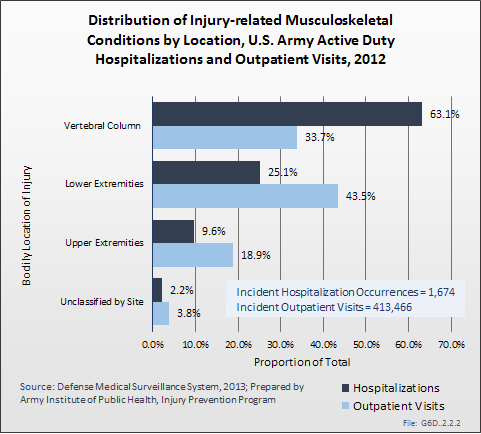
In 2012, there were 1,674 hospitalizations due to injury-related musculoskeletal conditions, roughly one-half the number of acute traumatic injuries requiring hospitalization. The most common types of injury-related musculoskeletal conditions leading to hospital admission were joint derangement (58%), followed by inflammation and pain due to overuse (23%). Joint derangement with neurological involvement accounted for another 12%. The vertebral column (including spine/back) was the most affected by injury-related musculoskeletal conditions (63%), followed by lower extremities (25%) and upper extremities (10%). (Reference Table 6D.3 PDF [118] CSV [119])
There was nearly twice the number of injury-related musculoskeletal conditions requiring outpatient visits as there were acute traumatic injuries. In 2012, there were a total of 413,466 outpatient visits for injury-related musculoskeletal conditions (710–739 ICD-9-CM series). Most outpatient visits for injury-related musculoskeletal conditions involved inflammation and pain due to overuse (87%). Lower extremities (44%) was the body region most often treated on an outpatient basis, followed by the vertebral column (including spine/back) at (34%), and upper extremities at 19%. The leading specific injury-related musculoskeletal conditions requiring outpatient treatment were inflammation and pain (overuse) to the knee and/or lower leg (20%), inflammation and pain (overuse) to the lumbar spine (18%), inflammation and pain (overuse) to the ankle and/or foot (14%), and inflammation and pain (overuse) to the shoulder (12%). (Reference Table 6D.4 PDF [120] CSV [121])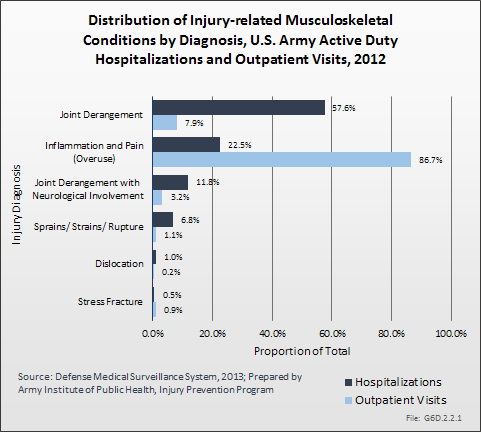
The leading cause of unintentional injury hospitalizations in 2012 was land transport accidents (20%), followed by falls or near-falls (16%). Parachuting and guns/explosives accounted for 8% each. A total of 6% of unintentional injury hospitalizations were due to sports and another 6% were due to heat injury. The top nine causes of unintentional injuries accounted for nearly three-fourths of hospitalizations (74%). Intervention strategies to address many of these issues are available.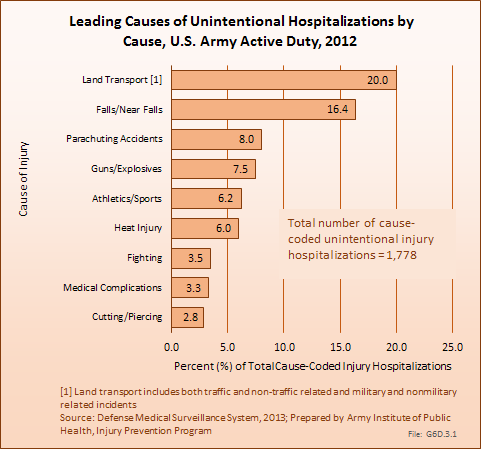
The leading causes of unintentional injury outpatient visits in 2012 were attributed to overexertion (27%), falls (16%), and injuries due to soldiers being struck by or against objects or other people (16%).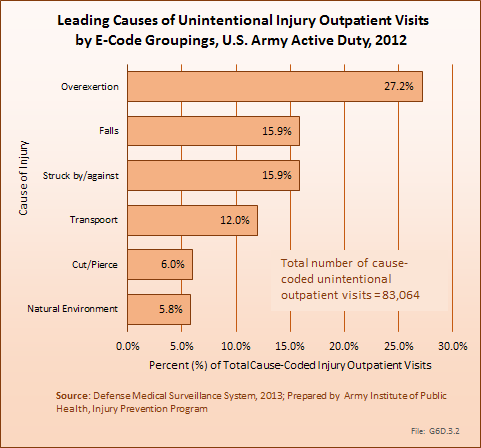
To address a large and complex problem such as injuries in the US Army, a systematic approach is needed.1 This approach should include routine assessment of surveillance data, data-driven and objective priorities, pursuit of detailed risk factor analyses, evaluation of existing prevention strategies, and research to address gaps in intervention and risk factor knowledge. Over the past three decades, contributions to Army injury prevention have been made in each of these areas, including the establishment of deployment injury surveillance capabilities2 and implementation of a data-driven process to define Army injury prevention priorities.3 Epidemiologic analyses and program evaluations have described potential technologies to address motor vehicle crashes among Army personnel4 and the effects of extreme conditioning program elements incorporated into unit physical training.5 Systematic reviews have defined physical training programs to enhance load carriage performance6 and interventions to prevent physical training-related injuries.7 Research efforts have quantified physical-training activities in Army basic training8 and described physical training to improve performance on tactical occupational tasks.9
To maintain progress, continued focus on leading causes of Army injuries such as physical training/exercise, sports, falls, and motor vehicle (land transport) crashes is needed. Collaborations with academia and other government organizations will aid in identifying modifiable causes, risk factors, and effective prevention strategies. Fostering existing and new partnerships between Army leadership, public health, safety, research, health promotion, and other communities will be critical for the success of military injury prevention activities. Given the magnitude and severity of the problem of injuries, effective injury prevention will make a significant contribution to the health and productivity of soldiers and the Army.
The material presented here is adapted from the following sources:
Esther Dada-Laseinde, Michelle Canham-Chervak, Bruce H. Jones: U.S. Army Annual Injury Epidemiology Report 2008. USAPHC (PROV) REPORT NO. 12-HF-0APLa-09. U.S. Army Public Health Command (Provisional), 5158 Blackhawk Rd, Aberdeen Proving Ground, Maryland 21010-5403.
Esther Dada, Michelle Canham-Chervak, Bruce H. Jones: U.S. Army Injury Surveillance Summary 2012. U.S. Army Institute of Public Health, Epidemiology and Disease Surveillance Portfolio, Injury Prevention Program.
While persons age 65 years and older account for only 13% of the total US population, they represent more than one-half of patients admitted to the hospital with a musculoskeletal injury. Advancing age, those 75 years and older, account for the largest share of these patients, with a rate of 3.4 in 100 of an age-adjusted population admitted to the hospital in a given year for a musculoskeletal injury and 14.7 in 100 seen in an emergency department. Fractures are the primary injury type among older patients hospitalized or seen in an emergency department. (Reference Table 6A.2.1 PDF [122] CSV [123]; Table 6A.2.2.2 PDF [27] CSV [28]; Table 6A.2.2.5 PDF [25] CSV [26])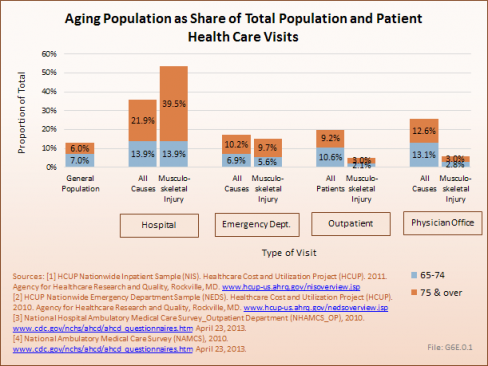
Falls are the primary cause of musculoskeletal injuries, increasing steadily with age and accounting for more than 80% of nonfatal unintentional injuries among persons aged 85 years and older seen in emergency departments in 2011. The rate of death due to a fall is the cause of more than 63% of unintentional injury deaths in persons age 85 years and older. After the age of 65, the proportion of hospital discharge patients with a musculoskeletal injury who are transferred to a skilled nursing, intermediate care, or other long-term care facility is more than one in two. (Reference Table 6A.3.1.2 PDF [36] CSV [37]; Table 6A.3.2.2 PDF [43] CSV [44]; Table 6A.4.2.1 PDF [49] CSV [50])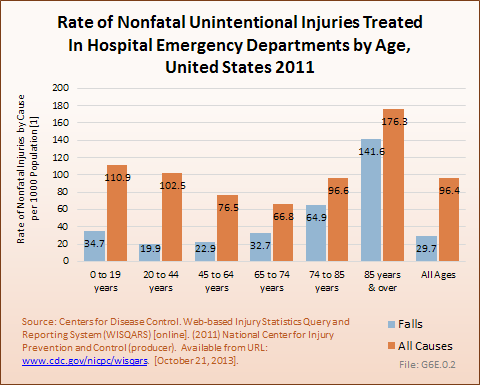
With current average life expectancies of persons in their 40s, 50s, and 60s in the United States well beyond the age of 80 years, the risk of incurring a musculoskeletal injury is significant.
Between the years 1996-1998 and 2009-2011, the number of persons in the population reporting a musculoskeletal injury rose only slightly, from 23.4 million to 24.8 million, resulting in a slight decline in the proportion of the population with a musculoskeletal injury (8.6% to 8.0%). However, the distribution of the population with a musculoskeletal injury, by age group, showed a consistent shift upward as the population ages, reflecting the overall aging of the US population. Persons in the 44- to 64-year age group showed the sharpest increase. (Reference Table 10.1 PDF [124] CSV [125])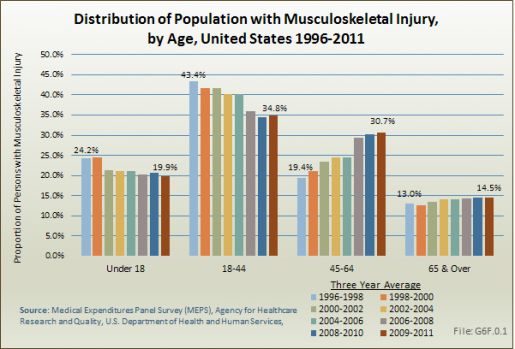
Health care treatments and visits contribute to the burden of musculoskeletal injuries. Ambulatory health care visits for musculoskeletal injuries rose by 85% between the years 1996-1998 and 2009-2011, from 54 million to 99 million visits. However, physician office visits continue to account for the largest share of treatment visits. Hospital discharges for musculoskeletal injuries remain a very small proportion of overall treatment visits, indicating that most musculoskeletal injuries are not serious enough to require hospitalization.
Prescription medications for musculoskeletal injuries nearly doubled over the time frame, jumping from 201 million prescriptions to 397 million between 1996-1998 and 2009-2011, an increase of 97%. (Reference Table 10.2 PDF [126] CSV [127]) 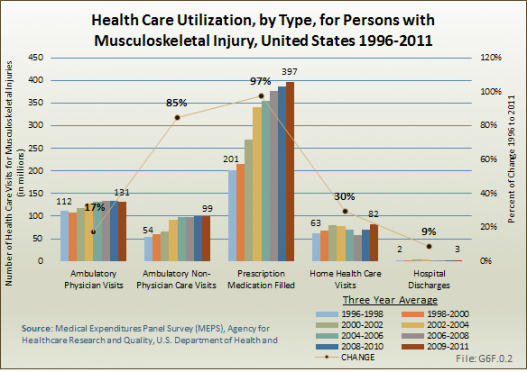
In recent years, ambulatory care visits account for the largest share of per-person direct cost for persons with a musculoskeletal injury, with the share increasing while inpatient costs share drops. At an average cost of $2,648 per person in 2009-2011, an increase of 80% from 1996-1998, ambulatory care accounted for 34% of per person direct cost in 2009-2011. While the share of mean per-person cost for inpatient care dropped from 35% to 27% between 1996-1998 and 2009-2011, the mean cost rose from $1,367 to $1,928, an increase of 26%. At the same time, the average per person cost for prescriptions rose from $427 to $1,314, in 2011 dollars, an increase of 161%. (Reference Table 10.4 PDF [128] CSV [129])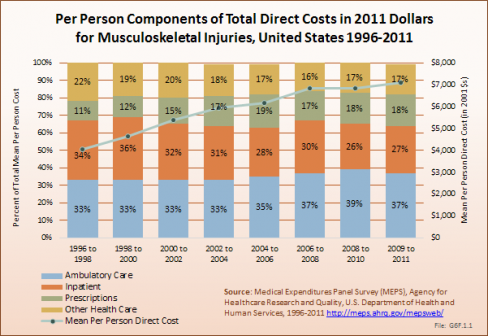
Total direct per-person health care cost for those with a musculoskeletal injury were $7,104, and increase of 75% since 1996-1998. Incremental direct per-person costs, those costs most likely attributable to a musculoskeletal injury, rose from $1,213 to $1,913, in 2011 dollars, an increase of 58%. (Reference Table 10.6 PDF [130] CSV [131])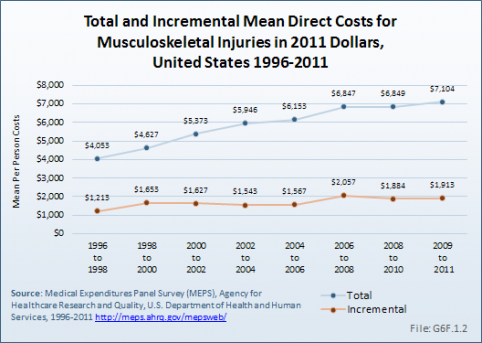
Total aggregate direct costs for those with a musculoskeletal injury were $176.1 billion in 2009-2011, a rise of 86% from the $94.7 billion in 1996-1998, in 2011 dollars. Incremental aggregate direct costs increased from $28.3 billion in 1996-1998 to $47.4 billion in 2009-2011, an increase of 67%.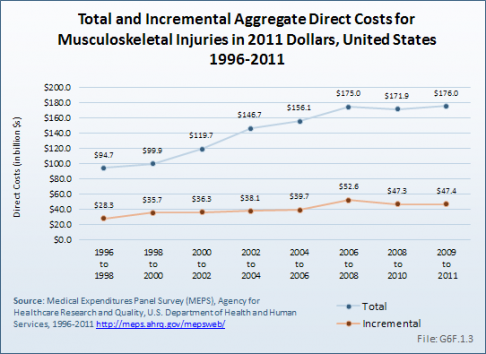
Indirect costs associated with lost wages for those aged 18 to 64 years are not calculated for persons with a musculoskeletal injury. However, musculoskeletal injuries are a primary cause of lost work days by persons in the labor force. In 2010, musculoskeletal disorders (MSD) accounted for nearly one-third (30.5%) of the 933,200 injuries involving days away from work. In addition, MSD injuries consistently across the years result in more median days away from work than all workplace injuries. In 2011, MSDs had a median of 11 days away from work compared to a median of 8 days for all injuries, which includes the MSDs in this median. (Reference Table 6B.1.1 PDF [71] CSV [72] and Table 6B.2.1 PDF [69] CSV [70])
Musculoskeletal workplace injuries are a major concern, accounting for a large proportion of all nonfatal injuries that result in days away from work. Even though long-term trends show significant reductions in the total number of worker injuries each year, the proportion that are related to musculoskeletal (MSD, which include fractures, bruises/ contusions, and amputations) continues to account for more than one-half of all worker nonfatal injury cases involving days away from work. In addition to the cost of medical care for these injuries, the cost of lost wages and the potential for long-term impairment negatively impacting worker productivity are enormous.
Analysis includes all five digit codes within each three-digit category.
Fractures
Trunk and Multiple Site Fractures
Fracture of rib(s), sternum, larynx, and trachea : 807
Fracture of pelvis : 808
Ill-defined fractures of bones of trunk : 809
Multiple fractures involving both upper limbs and upper limb with rib(s) and sternum : 819
Multiple fractures involving both lower limbs, lower with upper limb, and lower limb(s) with rib(s) and sternum : 828
Fracture of unspecified bones : 829
Upper Limb Fractures
Fracture of clavicle : 810
Fracture of scapula : 811
Fracture of humerus : 812
Fracture of radius and ulna : 813
Fracture of carpal bone(s) : 814
Fracture of metacarpal bone(s) : 815
Fracture of one or more phalanges of hand : 816
Multiple fractures of hand bones : 817
Ill-defined fractures of upper limb : 818
Multiple fractures involving both upper limbs and upper limb with rib(s) and sternum : 819
Lower Limb Fractures
Fracture of neck of femur : 820
Fracture of other and unspecified parts of femur : 821
Fracture of patella : 822
Fracture of tibia and fibula : 823
Fracture of ankle : 824
Fracture of one or more tarsal and metatarsal bones : 825
Fracture of one or more phalanges of foot : 826
Other multiple and ill‐defined fractures of lower limb : 827
Derangement
Internal derangement of knee : 717
Other derangement of joint : 718
Dislocation
Upper Limb Dislocation
Dislocation of shoulder : 831
Dislocation of elbow : 832
Dislocation of wrist : 833
Dislocation of finger : 834
Lower Limb Dislocation
Dislocation of hip : 835
Dislocation of knee : 836
Dislocation of ankle : 837
Dislocation of foot :838
Other Site Dislocation
Other multiple and ill-defined dislocations : 839
Sprains/Strains
Upper Limb Sprains/Strains
Sprains and strains of shoulder and upper arm : 840
Sprains and strains of elbow and forearm : 841
Sprains and strains of wrist and hand : 842
Lower Limb Sprains/Strains
Sprains and strains of hip and thigh : 843
Sprains and strains of knee and leg : 844
Sprains and strains of ankle and foot : 845
Back and Spine Sprains/Strains (also included in Spine Chapter)
Sprains and strains of sacroiliac region : 846
Sprains and strains of other and unspecified parts of back : 847
Other Site Sprains/Strains
Other and ill-defined sprains and strains : 848
Contusions
Contusion of trunk : 922
Contusion of upper limb : 923
Contusion of lower limb and of other and unspecified sites : 924
Crushing Injuries
Crushing injury of trunk : 926
Crushing injury of upper limb : 927
Crushing injury of lower limb : 928
Crushing injury of multiple and unspecified sites : 929
Open Wound
Open Wound of Trunk and Chest
Open wound of neck : 874
Open wound of chest (wall) : 875
Open wound of back : 876
Open wound of buttock : 877
Open wound of other and unspecified sites except limbs : 879
Open Wound of Upper Limb
Open wound of shoulder and upper arm : 880
Open wound of elbow forearm and wrist : 881
Open wound of hand except finger(s) alone : 882
Open wound of finger(s) : 883
Multiple and unspecified open wound of upper limb : 884
Open Wound of Lower Limb
Open wound of hip and thigh : 890
Open wound of knee leg (except thigh) and ankle : 891
Open wound of foot except toe(s) alone : 892
Open wound of toe(s) : 893
Multiple and unspecified open wound of lower limb : 894
Traumatic Amputation
Traumatic Amputation of Upper Limb
Traumatic amputation of thumb (complete) (partial) : 885
Traumatic amputation of other finger(s) (complete) (partial) : 886
Traumatic amputation of arm and hand (complete) (partial) : 887
Traumatic Amputation of Lower Limb
Traumatic amputation of toe(s) (complete) (partial) : 895
Traumatic amputation of foot (complete) (partial) : 896
Traumatic amputation of leg(s) (complete) (partial) : 897
Late Effect of Injury
Injury to other nerve(s) of trunk excluding shoulder and pelvic girdles : 954
Injury to peripheral nerve(s) of shoulder girdle and upper limb : 955
Injury to peripheral nerve(s) of pelvic girdle and lower limb : 956
Injury to other and unspecified nerves : 957
Injury other and unspecified : 959
Links:
[1] https://bmus.latticegroup.com/docs/T6.0.pdf
[2] https://bmus.latticegroup.com/docs/T6.0.csv
[3] http://www.cdc.gov/niosh/programs/msd/
[4] http://www.cdc.gov/niosh/programs/ti/
[5] https://bmus.latticegroup.com/docs/T6A.1.1.1.pdf
[6] https://bmus.latticegroup.com/docs/T6A.1.1.1.csv
[7] https://bmus.latticegroup.com/docs/T6A.1.1.2.pdf
[8] https://bmus.latticegroup.com/docs/T6A.1.1.2.csv
[9] https://bmus.latticegroup.com/docs/T6A.1.2.1.pdf
[10] https://bmus.latticegroup.com/docs/T6A.1.2.1.csv
[11] https://bmus.latticegroup.com/docs/T6A.1.2.2.pdf
[12] https://bmus.latticegroup.com/docs/T6A.1.2.2.csv
[13] https://bmus.latticegroup.com/docs/T6A.1.2.3.pdf
[14] https://bmus.latticegroup.com/docs/T6A.1.2.3.csv
[15] https://bmus.latticegroup.com/docs/T6A.1.3.1.pdf
[16] https://bmus.latticegroup.com/docs/T6A.1.3.1.csv
[17] https://bmus.latticegroup.com/docs/T6A.1.3.2.pdf
[18] https://bmus.latticegroup.com/docs/T6A.1.3.2.csv
[19] http://www.cdc.gov/nchs/index.htm
[20] http://www.hcup-us.ahrq.gov/
[21] https://bmus.latticegroup.com/docs/T6A.2.2.1.pdf
[22] https://bmus.latticegroup.com/docs/T6A.2.2.1.csv
[23] https://bmus.latticegroup.com/docs/T6A.2.2.4.pdf
[24] https://bmus.latticegroup.com/docs/T6A.2.2.4.csv
[25] https://bmus.latticegroup.com/docs/T6A.2.2.5.pdf
[26] https://bmus.latticegroup.com/docs/T6A.2.2.5.csv
[27] https://bmus.latticegroup.com/docs/T6A.2.2.2.pdf
[28] https://bmus.latticegroup.com/docs/T6A.2.2.2.csv
[29] https://bmus.latticegroup.com/docs/T6A.2.3.1.pdf
[30] https://bmus.latticegroup.com/docs/T6A.2.3.1.csv
[31] https://bmus.latticegroup.com/docs/T6A.2.3.2.pdf
[32] https://bmus.latticegroup.com/docs/T6A.2.3.2.csv
[33] http://www.cdc.gov/injury/wisqars/index.html
[34] https://bmus.latticegroup.com/docs/T6A.3.1.1.pdf
[35] https://bmus.latticegroup.com/docs/T6A.3.1.1.csv
[36] https://bmus.latticegroup.com/docs/T6A.3.1.2.pdf
[37] https://bmus.latticegroup.com/docs/T6A.3.1.2.csv
[38] http://www.cdc.gov/injury/wisqars/
[39] https://bmus.latticegroup.com/docs/T6A.3.2.1.pdf
[40] https://bmus.latticegroup.com/docs/T6A.3.2.1.csv
[41] https://bmus.latticegroup.com/docs/T6A.3.2.4.pdf
[42] https://bmus.latticegroup.com/docs/T6A.3.2.4.csv
[43] https://bmus.latticegroup.com/docs/T6A.3.2.2.pdf
[44] https://bmus.latticegroup.com/docs/T6A.3.2.2.csv
[45] http://www.hcup-us.ahrq.gov/nisoverview.jsp
[46] http://www.hcup-us.ahrq.gov/nedsoverview.jsp
[47] https://bmus.latticegroup.com/docs/T6A.4.1.1.pdf
[48] https://bmus.latticegroup.com/docs/T6A.4.1.1.csv
[49] https://bmus.latticegroup.com/docs/T6A.4.2.1.pdf
[50] https://bmus.latticegroup.com/docs/T6A.4.2.1.csv
[51] https://bmus.latticegroup.com/docs/T6A.4.2.3.pdf
[52] https://bmus.latticegroup.com/docs/T6A.4.2.3.csv
[53] https://bmus.latticegroup.com/docs/T6A.4.2.5.pdf
[54] https://bmus.latticegroup.com/docs/T6A.4.2.5.csv
[55] https://bmus.latticegroup.com/docs/T6A.4.2.2.pdf
[56] https://bmus.latticegroup.com/docs/T6A.4.2.2.csv
[57] https://bmus.latticegroup.com/docs/T6A.4.2.4.pdf
[58] https://bmus.latticegroup.com/docs/T6A.4.2.4.csv
[59] https://bmus.latticegroup.com/docs/T6A.4.2.6.pdf
[60] https://bmus.latticegroup.com/docs/T6A.4.2.6.csv
[61] https://bmus.latticegroup.com/docs/T6A.5.1.pdf
[62] https://bmus.latticegroup.com/docs/T6A.5.1.csv
[63] https://bmus.latticegroup.com/docs/T6A.5.3.pdf
[64] https://bmus.latticegroup.com/docs/T6A.5.3.csv
[65] https://bmus.latticegroup.com/docs/T6A.5.2.pdf
[66] https://bmus.latticegroup.com/docs/T6A.5.2.csv
[67] https://bmus.latticegroup.com/docs/T6A.5.3.%20csv
[68] http://www.bls.gov/news.release/osh2.toc.htm
[69] https://bmus.latticegroup.com/docs/T6B.2.1.pdf
[70] https://bmus.latticegroup.com/docs/T6B.2.1.csv
[71] https://bmus.latticegroup.com/docs/T6B.1.1.pdf
[72] https://bmus.latticegroup.com/docs/T6B.1.1.csv
[73] https://bmus.latticegroup.com/docs/T6B.1.2.pdf
[74] https://bmus.latticegroup.com/docs/T6B.1.2.csv
[75] https://bmus.latticegroup.com/docs/T6B.2.2.pdf
[76] https://bmus.latticegroup.com/docs/T6B.2.2.csv
[77] https://bmus.latticegroup.com/docs/T6B.3.1.pdf
[78] https://bmus.latticegroup.com/docs/T6B.3.1.csv
[79] http://www.cpsc.gov/en/Safety-Education/Safety-Guides/General-Information/National-Electronic-Injury-Surveillance-System-NEISS/
[80] https://bmus.latticegroup.com/docs/T6C.1.pdf
[81] https://bmus.latticegroup.com/docs/T6C.1.csv
[82] https://bmus.latticegroup.com/docs/T6C.2.pdf
[83] https://bmus.latticegroup.com/docs/T6C.2.csv
[84] https://bmus.latticegroup.com/docs/T6C.3.pdf
[85] https://bmus.latticegroup.com/docs/T6C.3.csv
[86] https://bmus.latticegroup.com/docs/T6C.4.pdf
[87] https://bmus.latticegroup.com/docs/T6C.4.csv
[88] https://bmus.latticegroup.com/docs/T6C.7.pdf
[89] https://bmus.latticegroup.com/docs/T6C.7.csv
[90] https://bmus.latticegroup.com/docs/T6C.5.pdf
[91] https://bmus.latticegroup.com/docs/T6C.5.csv
[92] https://highschool.riostudies.com/
[93] http://www.ncaa.org/
[94] http://www.datalyscenter.org/ncaa-injury-surveillance-program/
[95] http://datalyscenter.org/
[96] http://www.nata.org/
[97] http://www.ncbi.nlm.nih.gov/pmc/articles/PMC1941297/.
[98] http://www.cdc.gov/safechild/Sports_Injuries/index.html
[99] http://www.cdc.gov/safechild/index.html
[100] https://bmus.latticegroup.com/docs/T6C.9.pdf
[101] https://bmus.latticegroup.com/docs/T6C.9.csv
[102] https://bmus.latticegroup.com/docs/T6C.8.pdf
[103] https://bmus.latticegroup.com/docs/T6C.8.csv
[104] https://bmus.latticegroup.com/docs/T6C.10.pdf
[105] https://bmus.latticegroup.com/docs/T6C.10.csv
[106] https://bmus.latticegroup.com/docs/T6C.11.pdf
[107] https://bmus.latticegroup.com/docs/T6C.11.csv
[108] https://bmus.latticegroup.com/docs/T6C.12.pdf
[109] https://bmus.latticegroup.com/docs/T6C.12.csv
[110] https://bmus.latticegroup.com/docs/T6C.14.pdf
[111] https://bmus.latticegroup.com/docs/T6C.14.csv
[112] https://bmus.latticegroup.com/docs/T6C.13.pdf
[113] https://bmus.latticegroup.com/docs/T6C.13.csv
[114] https://bmus.latticegroup.com/docs/T6D.1.pdf
[115] https://bmus.latticegroup.com/docs/T6D.1.csv
[116] https://bmus.latticegroup.com/docs/T6D.2.pdf
[117] https://bmus.latticegroup.com/docs/T6D.2.csv
[118] https://bmus.latticegroup.com/docs/T6D.3.pdf
[119] https://bmus.latticegroup.com/docs/T6D.3.csv
[120] https://bmus.latticegroup.com/docs/T6D.4.pdf
[121] https://bmus.latticegroup.com/docs/T6D.4.csv
[122] https://bmus.latticegroup.com/docs/T6A.2.1.pdf
[123] https://bmus.latticegroup.com/docs/T6A.2.1.csv
[124] https://bmus.latticegroup.com/docs/T10001.1.pdf
[125] https://bmus.latticegroup.com/docs/T10001.1.csv
[126] https://bmus.latticegroup.com/docs/T10003.2.pdf
[127] https://bmus.latticegroup.com/docs/T10003.2.csv
[128] https://bmus.latticegroup.com/docs/T10005.4.pdf
[129] https://bmus.latticegroup.com/docs/T10005.4.csv
[130] https://bmus.latticegroup.com/docs/T10007.6.pdf
[131] https://bmus.latticegroup.com/docs/T10007.6.csv