

The health care utilization and economic cost of musculoskeletal diseases section looks at the overall impact of musculoskeletal conditions on the US health care sector and the overall economy.
Over the period of 2009 to 2011, an estimated 102.5 million persons annually reported a musculoskeletal disease in the Medical Expenditures Panel Survey (MEPS). The annual average proportion of the United States population with a musculoskeletal disease has increased by more than five percentage points between 1996 to 1998 and 2009 to 2011, from 28.0% to 33.2%. Musculoskeletal disease now includes about one-third of the population. The growth in the number of cases of musculoskeletal disease is more a function of the number of persons in the ages of increased incidence than in overall increase in all age groups. (Reference Table 10.1 PDF [3] CSV [4])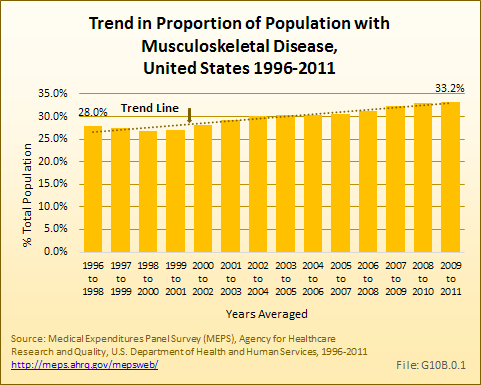
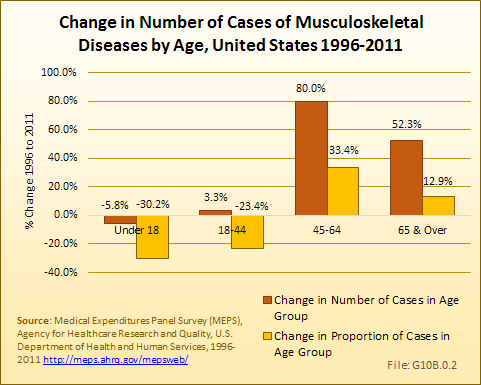
Between 1996 to 1998 and 2009 to 2011, the number of persons reporting a musculoskeletal disease increased by 26.5 million from the 76.0 million reported in 1996 to 1998 to the 102.5 million reported in 2009 to 2011.
The impact of musculoskeletal disease on the aging population is evident in the shifting burden carried by older persons. Among the population under the age of 18 years, the prevalence of musculoskeletal conditions is reported in 7.9 to 8.8 persons each year between 1996 and 2011. For the same years, persons age 18 to 44 years account for 26.4 to 29.8 million persons with the condition each year. However, as the population in the two older age groups has grown, the number of individuals with musculoskeletal diseases in those groups has increased substantially. In the years 1996 to 1998, an average of 21.7 million persons age 45 to 64 years reported a musculoskeletal disease condition, while 16.5 million of those 65 years and older did so. By 2009 to 2011, these numbers had risen to 39.2 million and 25.1 million, respectively. (Reference Table 10.1.1 PDF [5] CSV [6])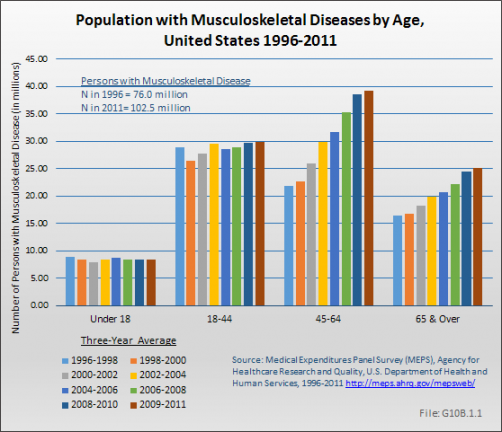
The 94.2 million persons age 18 years and older reporting a musculoskeletal disease in the MEPS is a substantially lower number than the 126.6 million musculoskeletal diseases self-reported by adults age 19 years and older in the National Health Interview Survey in 2012, and reported in the Big Picture section of this report.
A more expansive definition of musculoskeletal diseases includes persons with musculoskeletal diseases as a primary health concern, as well as persons in whom the musculoskeletal disease is a by-product of another condition (eg, bone metastases from cancer) or is overshadowed by a life-threatening disease, and, therefore, is often not the primary diagnosis (Dx1). The more expansive definition codes can be found in the ICD-9-CM codes [7] section.
Using this more expansive definition of musculoskeletal diseases, an average of 156.6 million persons of all ages, or 50.7% of the population, reported a musculoskeletal disease annually for the years of 2009 to 2011. This compares to 52.8% of persons age 18 years and older reported in the Big Picture section.
Approximately 8% of all persons reporting musculoskeletal diseases in MEPS for the years 2009 to 2011 are under the age of 18 years. Roughly one in four (24.5%) musculoskeletal diseases occurs in persons age 65 years and older. Almost 40% of musculoskeletal diseases occur among persons age 45 to 64 years. Overall, more than 75% of musculoskeletal diseases are reported by persons under the age of 65 years.
The fastest rate of growth in musculoskeletal diseases between 1996 and 2011, by age group, was among persons age 45 to 64 years. (Reference Table 10.1 PDF [3] CSV [4])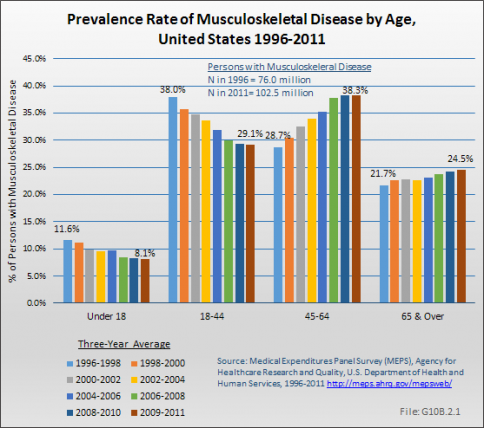
Arthritis and joint pain showed the largest change in rate reported for musculoskeletal disease conditions between 1996 to 1998 and 2009 to 2011, but much of this increase is probably due to methodological changes in MEPS in 2001 and 2007 that improved the accuracy of capturing these conditions. Spine conditions remained the same, while injuries showed a slight decline in rate, consistent with other reported numbers in this report. Osteoporosis and other musculoskeletal conditions showed slight rate increases. (Reference Table 10.1 PDF [3] CSV [4])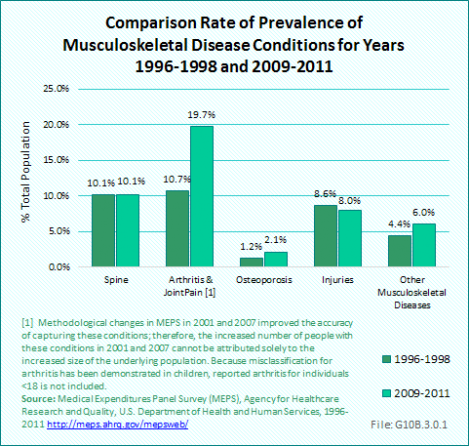
While one in four persons in the "all musculoskeletal diseases" category is older than age 65 years, nearly one-half of osteoporosis cases occur among persons 65 years and older. Only about 15% of persons reporting injuries are in this age range. (Reference Table 10.1.1 PDF [5] CSV [6])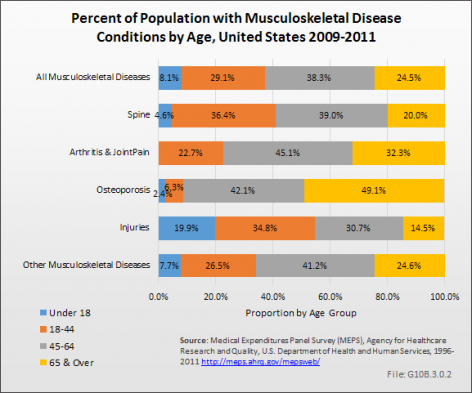
The number of persons reporting a spine condition increased by 3.6 million, from 27.4 million in 1996 to 1998 to 31.0 million in 2009 to 2011, while the prevalence, at 10.1%, was unchanged. The majority of spine conditions occur in working age people, with about 36% among persons age 18 to 44 years and another 39% among those age 45 to 64 years. The higher prevalence among working-age persons is reflected in the prominence of spine conditions in workers’ compensation and disability claims. Nevertheless, one in five spine conditions (20%) occurs among persons 65 years and older, with the rate increasing over the years in this age group. (Reference Table 10.1.1 PDF [5] CSV [6])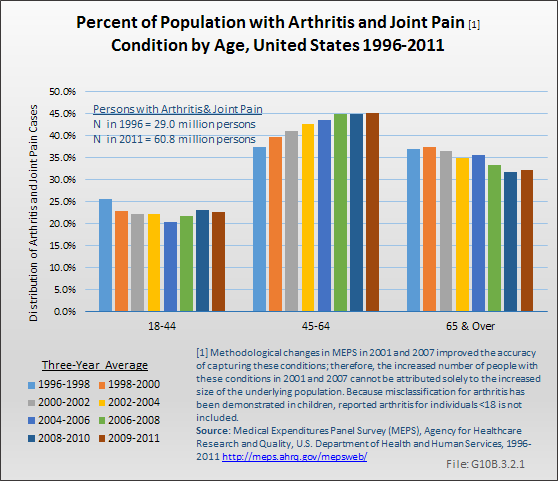
Among the major subgroups of musculoskeletal diseases, arthritis and joint pain have the highest prevalence, reflecting the overall aging population. In 1996 to 1998, 29 million persons (10.7%) reported one or more conditions related to arthritis and joint pain; by 2009 to 2011, 60.8 million persons (19.7%) reported one or more such conditions. However, methodological changes in MEPS in 2001 and 2007 improved the accuracy of capturing these conditions; therefore, the increased number of people with these conditions in 2001 and 2007 cannot be attributed solely to the increased size of the underlying population. The effect of the baby-boom generation aging has resulted in an increase in the proportion of arthritis cases among those age 45 to 64 years as they reach the typical onset age for arthritis. As this wave ages, the proportion of persons with arthritis in the 65-year and older group will increase as well. In 1996 to 1998, 25.6% of persons reporting arthritis were age 18 to 44 years; 37.5% were age 45 to 64 years. By 2009 to 2011, the proportions had changed to 22.7% and 45.1%, respectively. In the next decade, a higher proportion of arthritis and joint pain is expected to occur in persons age 65 years and older. (Reference Table 10.1.1 PDF [5] CSV [6])
Population aging has also led to a dramatic increase in the number of individuals with osteoporosis. In the period 1996 to 1998, 3.2 million people (1.2% of the population) indicated they had these conditions, but by 2009 to 2011, 6.4 million (2.1% of the population) reported having them. These numbers are substantially lower than numbers reported in other sources, even though the category in this chapter is not limited to osteoporosis-related conditions. In 2002, the National Osteoporosis Foundation projected 44 million persons had osteoporosis. More than two-fifths of persons in the MEPS with these conditions are age 45 to 64 years, increasing the likelihood that these individuals will suffer from falls and fractures for the relatively long future they can expect to live with this condition. (Reference Table 10.1.1 PDF [5] CSV [6])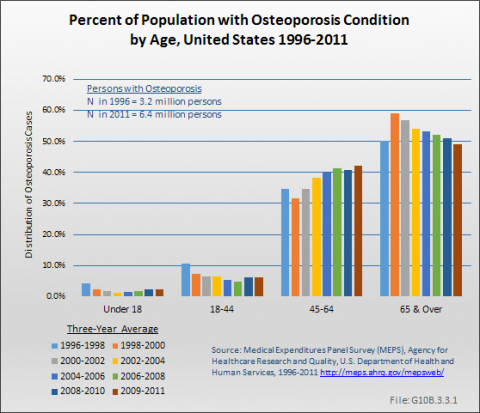
In contrast to spine conditions, arthritis and joint pain, and osteoporosis, the prevalence of musculoskeletal injuries actually decreased slightly although the number of individuals reporting injuries has increased slightly. In 1996 to 1998, 23.4 million persons reported a musculoskeletal injury, while 24.8 million reported such an injury in 2009 to 2011. The prevalence of musculoskeletal injuries remained relatively constant at 8.6% and 8.0% of the population, respectively. Age distribution of injuries may explain why the prevalence hasn’t increased. More than half of injuries occur among persons younger than 45 years, a population segment growing more slowly than those who are older. It is possible improvements in the safety of automobiles and other public health prevention activities have also played a role. Although the MEPS reporting of musculoskeletal injury trends supports trend data previously reported, the overall prevalence is substantially lower than the 65.8 million injury treatment episodes reported in the Injuries section of this report. Injury treatment episodes include total cases treated in doctors' offices, outpatient clinics, emergency rooms, and inpatient admissions in 2010. (Reference Table 10.1 PDF [5] CSV [6])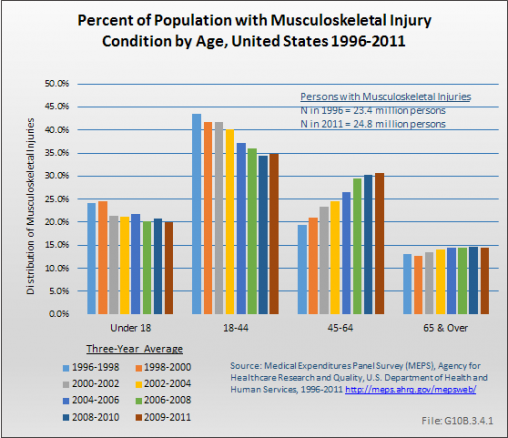
The percentage of the population reporting other musculoskeletal diseases, which include a broad range of conditions of less frequent prevalence, increased from 4.4% to 6.0% between 1996 to 1998 and 2009 to 2011. The total number of persons reporting one or more such conditions increased from about 12 million to 18.6 million. Persons in the age range of 45 to 64 years are the most likely to report other musculoskeletal disease conditions. (Reference Table 10.1.1 PDF [5] CSV [6])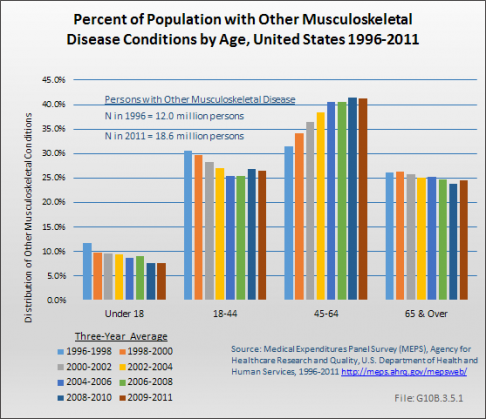
Using the more expansive definition [7] of musculoskeletal diseases, in the period of 2009 to 2011, 87.7 million persons (versus 31.0 million using the more conservative definition) reported one or more spine conditions and 64.0 million (versus 60.8 million) reported arthritis and joint pain. The base and expansive definitions for osteoporosis are identical, so the number of cases for both definitions are also identical, but substantially lower than reported in the Osteoporosis section of this report, as previously noted. The number reporting musculoskeletal injuries was slightly higher than in the more conservative definition (28.3 versus 24.8 million). The increased prevalence in the “other” musculoskeletal diseases category was also substantial, with 71.0 million in the expansive definition versus 18.6 million, as discussed above.
Musculoskeletal health care utilization is examined for the MEPS for the following types of care: ambulatory physician visits, ambulatory nonphysician visits, prescription medications filled, home health care days, and hospital discharges for all musculoskeletal conditions and by type of condition.
Over the 13 3-year average periods, 1996 to 1998 to 2009 to 2011, for which the MEPS data is analyzed, prescription medications and ambulatory nonphysician care visits increased more than other categories of health care percentage-wise. The former showed an average annual increase of more than 8%, while the latter showed an increase of 6.6%. Of note, however, the increases for all services were much slower in the most recent three-year period, at 1.4% across the board. (Reference Table 10.3 PDF [8] CSV [9])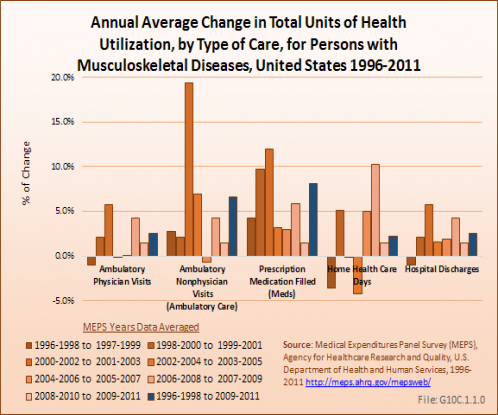
Persons with musculoskeletal diseases account for a large and growing share of health care utilization. In any given year, about 85% of persons with musculoskeletal diseases have at least one ambulatory care visit to a physician’s office, averaging just under six such visits per year. Between 1996 to 1998 and 2009 to 2011, ambulatory physician visits for these individuals increased from 425.5 million to 574.0 million. Growth in the number of persons with musculoskeletal diseases, rather than an increase in the number of visits by individuals, is primarily responsible for this increase. (Reference Table 10.2 PDF [10] CSV [11])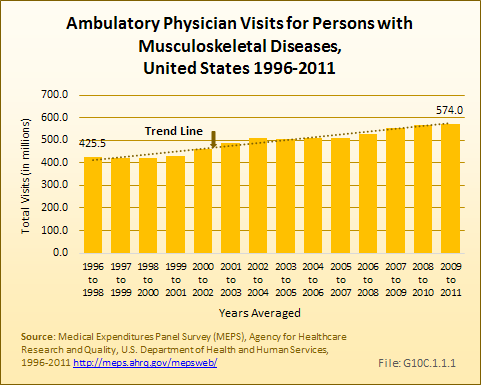
In contrast to the relatively stable number of physician office visits, there was an increase in the proportion of the US population with visits to ambulatory providers other than medical physicians; the average number of visits to nonphysician providers by persons with musculoskeletal diseases also increased. Nonphysician ambulatory health care providers include physical therapists, occupational therapists, chiropractors, social workers, physician assistants, nurse practitioners, and other related health care workers. In 1996 to 1998, approximately 40% of persons with musculoskeletal diseases visited a nonphysician health care provider at least once; by 2009 to 2011 the proportion had jumped to nearly 52%. At the same time, the average number of such visits increased from 2.6 per person to 3.7. The result was a 92% increase, from 197.5 million to 379.3 million, in total nonphysician ambulatory care visits between 1996 to 1998 and 2009 to 2011. (Reference Table 10.2 PDF [10] CSV [11]) 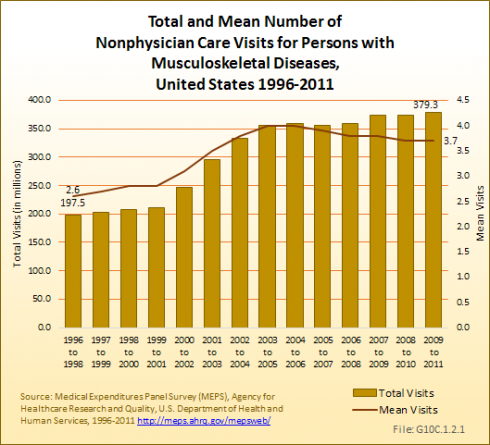
The aggregate total for all ambulatory care visits, including those to physicians and nonphysicians, thus increased over the 13-year period by 53%, from 623.0 million visits to 953.3 million visits.
During this same time frame of 1996 to 2011, the use of prescription medications among persons with musculoskeletal diseases rose substantially. While the proportion of persons with a musculoskeletal disease who filled at least one prescription changed only slightly, from 81.3% to 83.7%, the mean number of prescriptions filled per person increased from 13.1 to 20.8. The result was a 142% increase, from 995.3 million in 1996 to 1998 to more than 2.1 billion in 2009 to -2011, in the number of prescription medications filled by persons with a musculoskeletal disease. (Reference Table 10.2 PDF [10] CSV [11]) 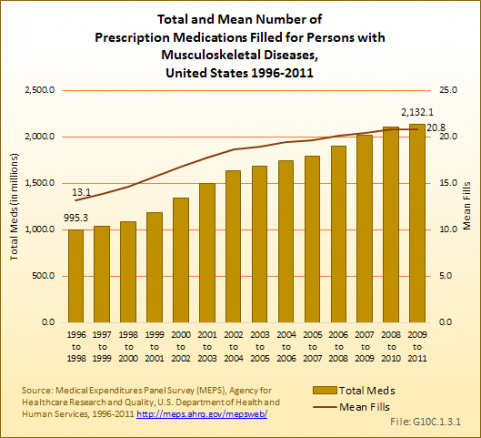
Despite widespread concerns that an aging population would use an increasing amount of home health care, there is no evidence that this is occurring. Both the proportion of persons with a musculoskeletal disease using home health care and the average number of home health care visits declined slightly in the past 13 years. Only 4.9% of persons reported any home health care visits in 2009 to 2011, with an average of 3.8 visits incurred. The total number of home health care visits to persons with a musculoskeletal disease rose from 296.3 million to 389.5 million, entirely due to population increase. (Reference Table 10.2 PDF [10] CSV [11]) 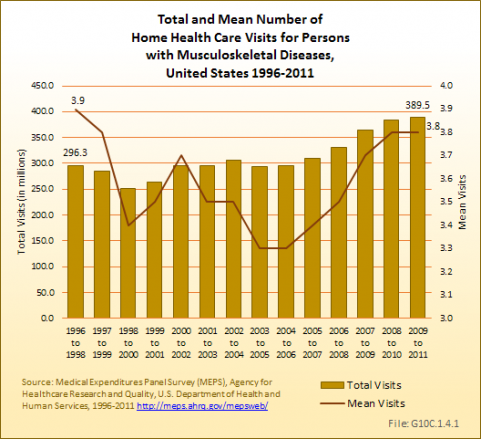
An increase of 35%, from 15.2 to 20.5 million, in the number of hospital discharges for persons with a musculoskeletal disease occurred in the periods 1996 to 1998 to 2009 to 2011. This may be due to the aging population. The percentage of persons with a musculoskeletal disease who were hospitalized one or more times in a year was roughly stable, with 11.1% and 11.0% of persons in 1996 to 1998 and 2009 to 2011 hospitalized, respectively. The average number of hospitalizations per person, at 0.2, did not change. (Reference Table 10.2 PDF [10] CSV [11]) 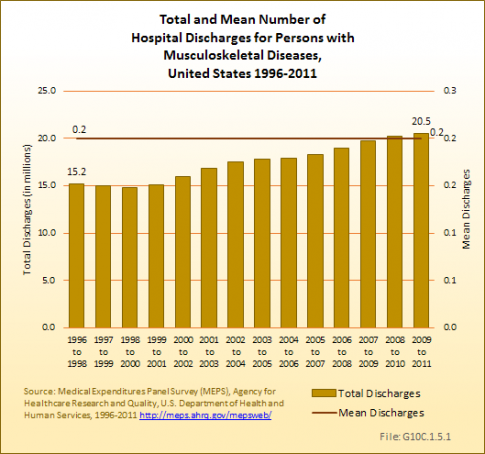
Using the more expansive definition [7] of musculoskeletal diseases, in 2009 to 2011 there were an estimated 767.3 million visits to physicians among persons with these diseases, as well as 469.8 million ambulatory visits to providers other than physicians, 2.8 billion prescriptions filled, 438.4 million home care visits, and 15.7 million hospital discharges. It should be noted that in this expansive definition, the number of ambulatory visits per person to providers other than physicians and the number of medications per person has risen dramatically. The number of hospital discharges per person and overall has declined, reflecting the increase in management of these conditions on an ambulatory basis.
Utilization of health care services increased in several service categories for musculoskeletal disease conditions. The largest increase was found for persons with arthritis and joint pain in the service categories of physician visits, nonphysician visits, prescription medications, and hospital discharges. However, a large proportion of these increases are due to the increase in the numbers of individuals with arthritis and joint pain, which is due at least in part to changes in MEPS methodology in 2001 and 2007. Home health care days increased fastest among those with osteoporosis and related conditions, but this was closely followed by persons with arthritis and joint pain. The lowest increase in hospital discharges occurred among those reporting musculoskeletal injuries, while those with spine conditions experienced the lowest growth in the remaining services. (Reference Table 10.3 PDF [8] CSV [9])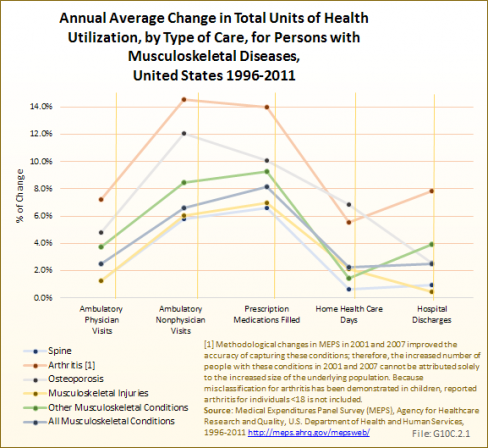
Musculoskeletal medical care expenditures are presented in two ways: (1) for all persons with a musculoskeletal disease, regardless of whether the musculoskeletal disease was the reason for the expenditure (total direct cost), and (2) as a measure of the expenditures beyond those expected for persons of similar characteristics but who do not have a musculoskeletal disease (incremental cost). Incremental cost is that share estimated to be directly related to the musculoskeletal condition. Both total and incremental costs are expressed as the average cost per person with a musculoskeletal disease and as the aggregate cost (sum) for all persons with a musculoskeletal disease.
Mean costs are presented for ambulatory care, inpatient care, prescription costs, and a residual for other costs, as well as the total cost. Medical care costs are expressed in both the current year dollars (ie, the year the data was collected) and in 2011 dollars to provide a standard of comparison across years.
Total and incremental costs for all musculoskeletal conditions and five subconditions are summarized in Table 10.6 PDF [12] CSV [13].
Overall, total average expenditures for persons with musculoskeletal diseases increased from $4,832 in 1996 to 1998 to $7,768 in 2009 to 2011, in 2011 dollars, a 60% increase. Ambulatory care had the largest share of total average per person costs for musculoskeletal diseases. (Reference Table 10.4 PDF [14] CSV [15])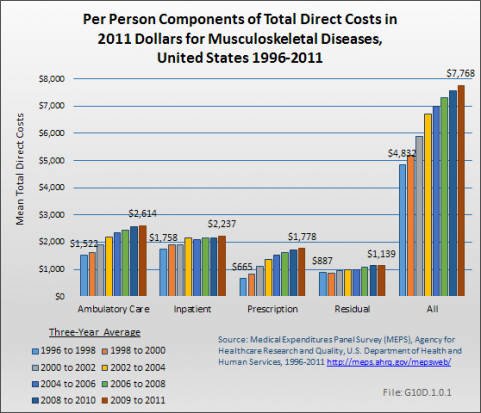
Per-person average expenditures for prescriptions had the largest increase among all components of musculoskeletal diseases, ranging from an increase of 102% for osteoporosis to an increase of 208% for injuries. Overall, prescription per person costs rose by 167% for all musculoskeletal diseases. Inpatient and residual costs showed the lowest increase between 1996 and 2011. 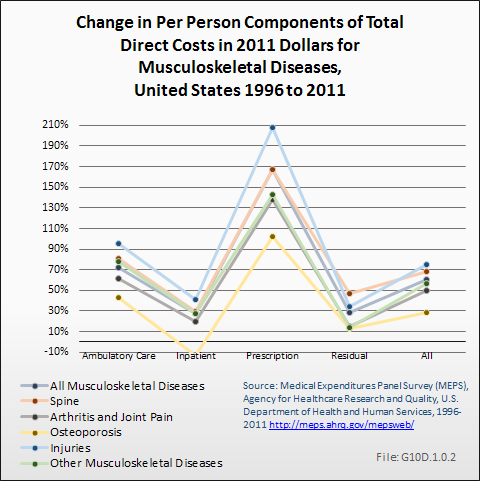
Incremental average expenditures for persons with musculoskeletal diseases almost doubled in real terms between 1996 to 1998 and 2009 to 2011, in 2011 dollars, from $1,280 in the earlier three-year period to $2,075 in the later one. Incremental costs for inpatient services for musculoskeletal diseases increased the most in relative terms, rising by 207% between 1996 and 2011. (Reference Table 10.5 PDF [16] CSV [17])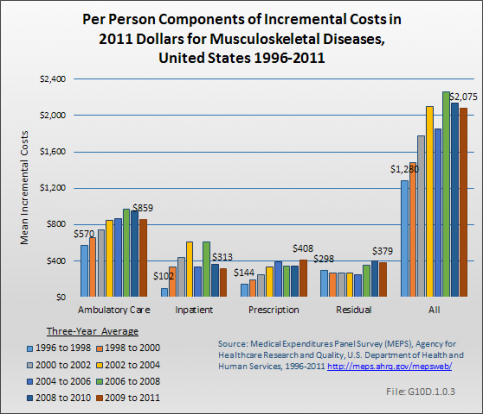
Data for specific musculoskeletal conditions has been analyzed through the 2009 to 2011 time period, and is shown in 2011 dollars. Total per person medical care expenditures rose for each of the major subconditions between 1996-1998 and 2009-2011. Osteoporosis, which rose from $8,572 to $10,978 per person had the lowest increase at 28%. Costs for injuries rose by 75%, from $4,053 to $7,104 per person, and was the largest relative due to increase. (Reference Table 10.4 PDF [14] CSV [15] and Table 10.7 PDF [18] CSV [19])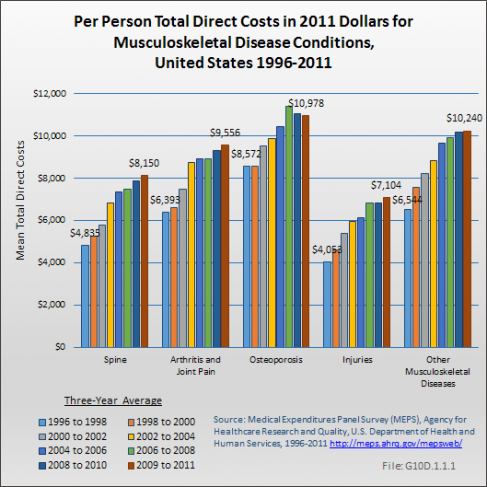
Incremental costs for arthritis and joint pain rose by 192% between 1996 and 2011, nearly four times the rate of increase for spine, injuries, and other musculoskeletal diseases. Incremental costs were not calculated for osteoporosis due to insufficient sample size. (Reference Table 10.5 PDF [16] CSV [17])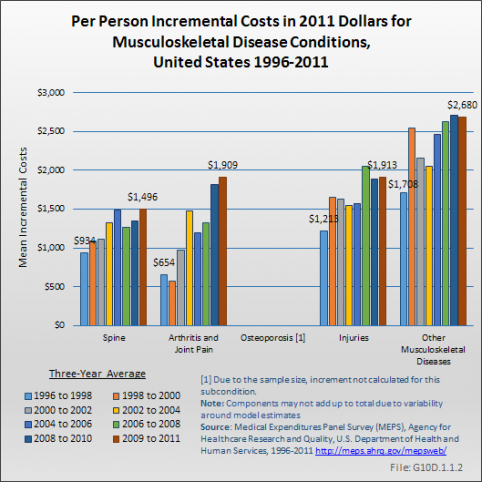
Expenditures for musculoskeletal diseases did not differ substantially by gender, race, and education level in 2011. On an unadjusted basis, women with musculoskeletal diseases had only 3% higher average expenditures than men. Nonwhites also had 3% higher expenditures than whites. On the other hand, non-Hispanics report 30% higher expenditures than Hispanics, and those who are married or divorced, separated, or widowed had substantially higher expenditures than those who have never married (presumably due to age). Persons who are divorced, widowed, or separated, at $8,951, had the highest unadjusted mean expenditures for musculoskeletal diseases.
Lack of insurance had the most profound impact on health expenditures for persons with musculoskeletal conditions. Expenditures on behalf of those without insurance, at $2,479, were only a third as large as those with private insurance ($7,842) and a quarter as much as those with public insurance ($10,142). Thus, lack of health insurance is associated with dramatically lower expenditure levels, inconsistent with the belief that persons who lack insurance are somehow able to obtain care. (Reference Table 10.8 PDF [20] CSV [21])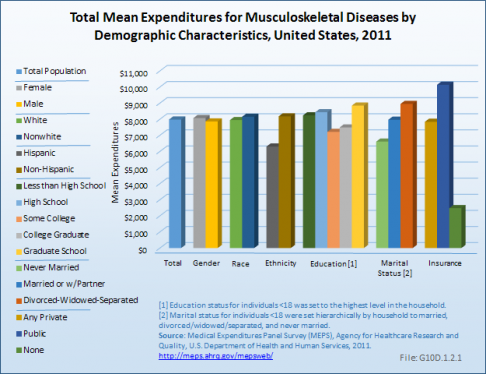
Total medical care expenditures for musculoskeletal diseases are disproportionately higher for persons 65 years of age or older, with a per-person cost of $11,708 in 2009 to 2011 compared to a per-person cost of $3,288 for persons less than 18 years, $4,658 for those 18 to 44 years, and $8,658 for those 45 to 64 years. (Reference Table 10.9 PDF [22] CSV [23])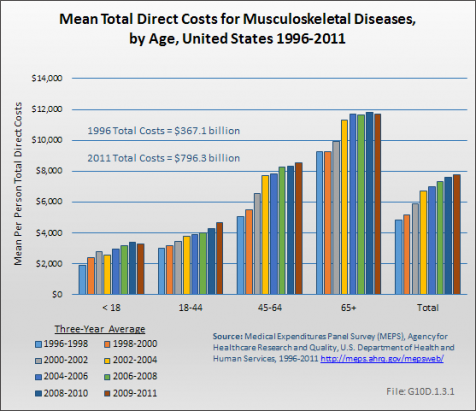
Although in the years 1996-1998, mean incremental costs for musculoskeletal disease were highest for the oldest cohort, age 65 years and older, by 1998 to 2000 costs for those ages 44 to 64 years were the highest. They have remained so since that time, and in 2009 to 2011 were 20% higher for this age group than the age 65 years and over group. (Reference Table 10.9 PDF [22] CSV [23] and Table 10.10 PDF [24] CSV [25])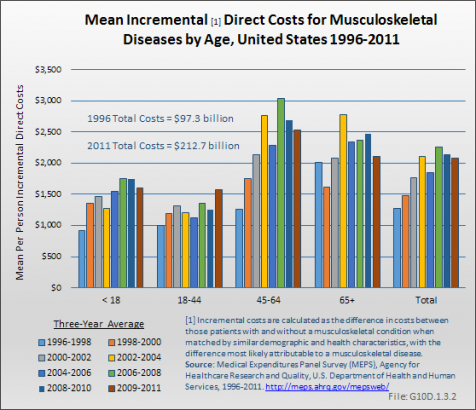
Aggregate total expenditures increased from $367.1 billion to $796.3 billion, in 2011 dollars, during this time frame, or more than doubling. In 1996 to 1998, aggregate total expenditures for persons with a musculoskeletal disease, whether for musculoskeletal disease or other conditions, represented 3.2% of the GDP in 2011 dollars. By 2009 to 2011, the proportion had grown to 5.2% of the GDP.
Aggregate incremental expenditures, due to the higher number of persons with a musculoskeletal condition and the increased incremental expenditures per person, increased from $97.3 billion in 1996-1998 to $212.7 billion, in 2009 to 2011 when expressed in constant (2011) dollars, or by about 119%. Incremental cost associated with a musculoskeletal condition represented the equivalent of 0.25% and 0.5% of the GDP in 2011 dollars, for the respective time frames.
Over the full time range of 1996 to 1999 through 2009 to 2011, the annual average rate of increase in total and incremental costs for musculoskeletal diseases has been 9%. (Reference Table 10.7 PDF [18] CSV; [19] Table 10.9 PDF [22] CSV [23]; Table 10.11 PDF [26] CSV [27]; Table 10.14 PDF [28] CSV [29])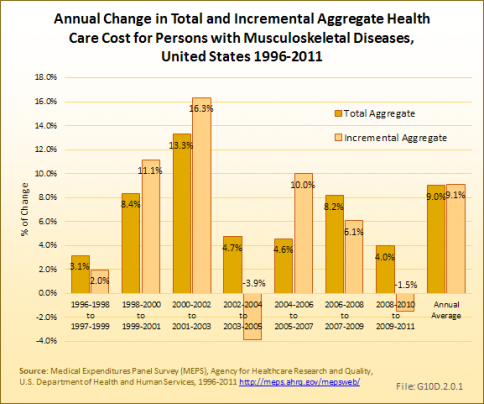
Because of the higher prevalence and relatively high level of expenditures per person, aggregate expenditures have consistently been greatest for arthritis and joint pain, accounting for $580.9 billion in health care costs in 2009 to 2011. Spine conditions, with an estimated $253.0 billion aggregate cost in 2009 to 2011, have held steady as the second most expensive musculoskeletal health care condition. Aggregate costs for injuries and other musculoskeletal conditions were $176.1 and $190.6, respectively, in 2009 to 2011. (Reference Table 10.6 PDF [12] CSV [13])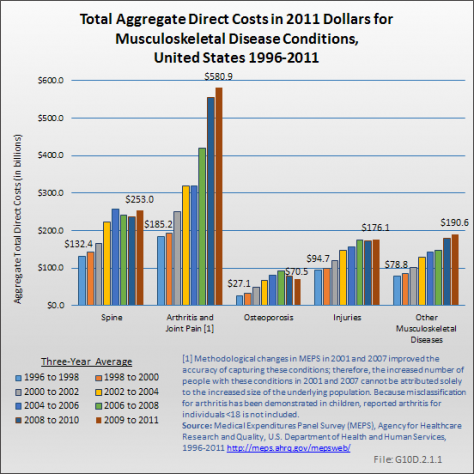
The magnitude of increase in aggregate total expenditures between 1996 to 1998 and 2009 to 2011 is greatest for the diseases within the category including osteoporosis (about 160%), but was substantial for all musculoskeletal diseases. The aggregate total cost of health care for spine conditions increased by more than 91%; musculoskeletal injuries by 86%; and other musculoskeletal diseases by about 142% over the period 1996 to 1991 through 2009 to 2001. (Reference Table 10.7 PDF [18] CSV [19])
Sampling variability limits inference about time trends in incremental expenditures associated with the subcondition groups. However, while estimates do not have the same precision as those for all musculoskeletal diseases, it is fair to conclude that 2009 to 2011 aggregate incremental expenditures, at $116.1 billion, were largest for arthritis and joint pain. (Reference Table 10.6 PDF [12] CSV [13])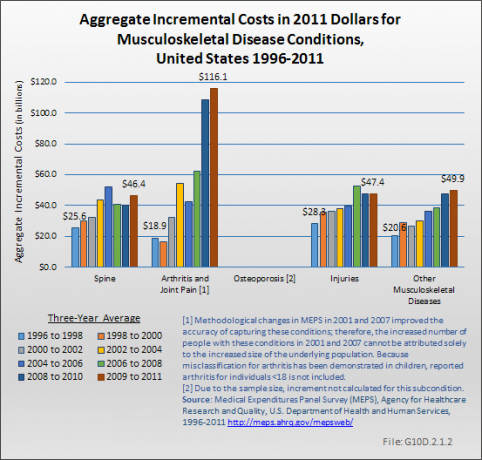
Using the more expansive definition of musculoskeletal diseases, aggregate total medical care expenditures on behalf of persons with a musculoskeletal disease were $1.068 trillion in 2009 to 2011.
Women account for both a higher proportion of the population with musculoskeletal disease and more than half of total costs. With 36% of women reporting musculoskeletal diseases compared to 30% of men, women accounted for 56% of aggregate costs in 2011.
Whites and non-Hispanics account for the majority of cost, with 84% and 92%, respectively. Although a similar share of one-third of all persons in all education levels report musculoskeletal diseases, due to lower numbers with higher education, these groups represent a smaller share of aggregate total cost.
About one in four persons with no insurance report musculoskeletal disease, but the much lower cost and smaller group of persons means that only 3% of aggregate total cost is represented by the uninsured. (Reference Table 10.8 PDF [20] CSV [21])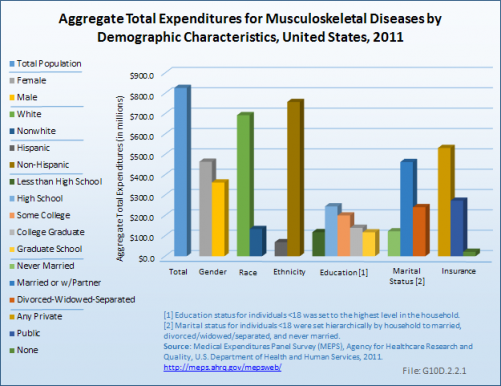
While persons age 65 years and older represent about 25% of all persons with a musculoskeletal disease, this age group accounted for 37%, or $294.1 billion, of total aggregate health care costs for musculoskeletal diseases in 2009 to 2011. However, incremental aggregate musculoskeletal health care for the 65 years and older population is estimated to comprise 25%, or $53.0 billion, of the total $212.7 billion aggregate incremental cost of these conditions, in part because in this age group, high medical care costs become the norm. Persons age 45 to 64 years represent 38% of persons these ages with musculoskeletal conditions, but 42% of aggregate medical care costs and 47% of aggregate incremental costs. (Reference Table 10.9 PDF [22] CSV [23] and Table 10.10 PDF [24] CSV [25])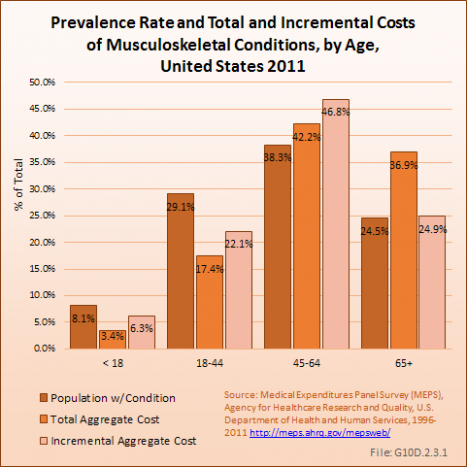
Estimated 2009 to 2011 aggregate total expenditures for persons age 18 to 64 years were $474.9 billion, or 60% of aggregate total health care expenditures for musculoskeletal diseases in that year. Thus, although musculoskeletal conditions are more prevalent with age, because of the size of the group 18 to 64 years, a majority of medical costs occur in the adult, nonelderly population. Only $27.4 billion of total aggregate musculoskeletal health care costs, or less than 4% of the total, went for persons under the age of 18 years.
The share of aggregate total and incremental costs accounted by persons 45 to 64 years has been growing over time, by 40% in relative terms for aggregate total costs (from 30% in 1996 to 1998 to 42% in 2009 to 2011) and by 68% in relative terms for incremental aggregate costs (from 28% in the first three years to 47% in the last three years). The share of total and incremental aggregate costs for all other age groups has been falling over this same period of time. The cumulative increase in aggregate cost has been 204% and 262%, respectively, for total and incremental costs from 1996 to 2011 for the 45- to 64-year age group, while all other age groups have increased between 60% and 92%. This reflects the importance of the size of the baby boom generation in overall musculoskeletal costs. However, that large cohort will soon be concentrated among the elderly and aggregate costs are likely to increase as a share of the total among those 65 years and older in the years to come. (Reference Table 10.10 PDF [24] CSV [25]; Table 10.11 PDF [26] CSV [27])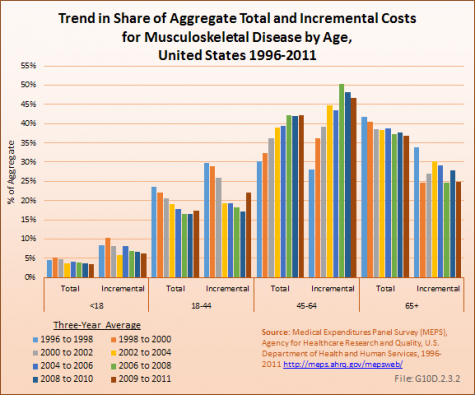
Two factors affect the cost of treating musculoskeletal diseases in the United States. The first is the cost of medical services, which include inpatient and outpatient care, prescriptions, home health care, and a residual or “other” category including such items as medical devices. The second is the number of persons in this country with musculoskeletal disease conditions. Both will be explored in the associated web pages in this topic, and together, they will establish a baseline against which to assess future needs. It will be shown that both ongoing costs to treat these conditions and a high prevalence of musculoskeletal conditions in the aging population in relation to other medical conditions results in a huge, and growing, economic impact in the United States each year.
The mean direct cost per year per individual patient with a musculoskeletal disease has increased nearly 61% between the years 1996 to 1998 and 2009 to 2011, rising from just over $4,800 to nearly $7,800 per person in this time frame. Incremental costs, those cost most likely attributable to a musculoskeletal disease, rose from about $1,300 to $2,075. (Reference Table 10.4 PDF [14] CSV [15], Table 10.5 PDF [16]CSV [17]) 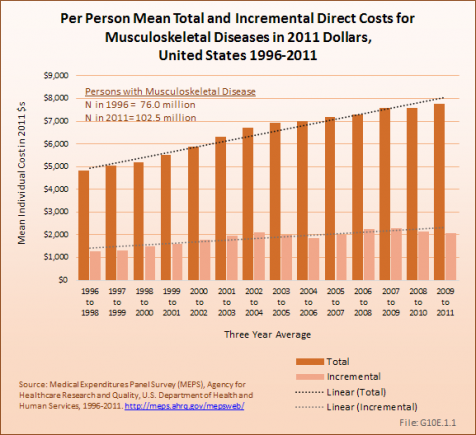
At the same time, with the increasing number of individuals with musculoskeletal diseases in a growing and aging population, aggregate total direct cost to treat persons with a musculoskeletal disease between the years 1996 to 1998 and 2009 to 2011 increased by about 117%. For the years 2009 to 2011, the annual aggregate total direct cost, in 2011 dollars, is estimated to be $796.3 billion. Aggregate incremental medical cost is estimated to be $212.7 billion in 2009 to 2011, an increase of about 119% from the earlier time period. (Reference Table 10.6 PDF [12] CSV [13], Table 10.7 PDF [18] CSV [19])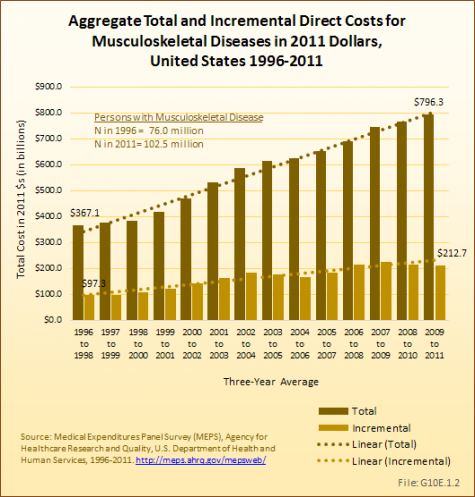
Indirect total cost, as the difference in wages for persons age 18 to 64 years with a work history, and with and without musculoskeletal conditions, add another $77.5 billion to the aggregate cost for all persons with a musculoskeletal disease. Incremental indirect costs attributable to musculoskeletal disease alone are estimated to amount to $130.7 billion, indicating that wage losses attributable to musculoskeletal conditions are greater than the mean difference in wages between the two groups. Aggregate total indirect cost increased by 168% from the estimate in 1996 to 1998 to that of 2009 to 2011; aggregate incremental indirect costs rose by about 184%. (Reference Table 10.12 PDF [30] CSV [31])![Aggregate Total and Incremental Indirect[1] Cost in 2011 Dollars for Persons Age 18 to 64 with Musculoskeletal Diseases and a Work History, United States 1996-2011 Aggregate Total and Incremental Indirect[1] Cost in 2011 Dollars for Persons Age 18 to 64 with Musculoskeletal Diseases and a Work History, United States 1996-2011](https://bmus.latticegroup.com/docs/resize/G10.E.1.3-474x474.png)
Taking into account all costs for persons with a musculoskeletal disease, including other comorbid conditions, the total aggregate cost of treating these individuals, plus the cost to society in the form of decreased or lost wages (indirect cost), is estimated to be $873.8 billion per year. (Reference Table 10.14 PDF [28] CSV [29])
Between the years 1996 to 1998 and 2009 to 2011, the Gross Domestic Product (GDP), in constant 2011 dollars, has risen from $11.5 trillion to $15.2 trillion, an increase of 32%.1 Over the same two time frames, total direct and indirect costs of musculoskeletal conditions rose from $396.1 billion to $873.8 billion. This is an increase of 121%, or nearly four times the rate of increase as the GDP. 
As a share of GDP, using the same 2011 dollars base, total direct and indirect costs for musculoskeletal conditions increased by 67%, from 3.43% to 5.73%. Indirect costs saw a sharper rate of increase of slightly more than 100%. However, indirect cost are a much smaller share of total cost than direct costs, constituting 0.25% of GDP in 1996 to 1998 and 0.51% in 2009 to 2011. Direct costs rose from a 3.18% share to a 5.22% share over the same time period. (Reference Table 10.14 PDF [28] CSV [29])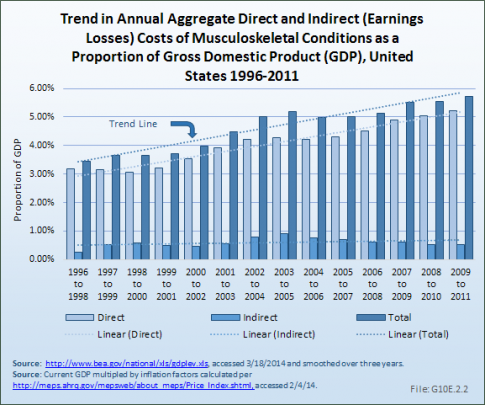
To provide a basis for comparison, the economy is said to be in a recession when GDP declines by at least 1% for two or more consecutive quarters. Accordingly, the aggregate economic impact of the medical expenditures attributable to persons with musculoskeletal diseases is far in excess of the amount used to define a recession and, unlike a recession, occurs in perpetuity.
Musculoskeletal diseases affect the US economy through direct medical costs and through lost wages. Changes in medical care, new methods of treatment, new drugs, and the overall economy all affect the impact of musculoskeletal diseases. Musculoskeletal diseases are a major burden on the overall economy.
Over the period 1996 to 1998 through 2009 to 2011, slight changes in the proportion of total medical care expenditures devoted to ambulatory physicians visits (from 31% to 34% of total) and to inpatient care (from 36% to 29%) occurred. However, the share of musculoskeletal health care costs devoted to prescription medications increased the most, growing by more than 60%, from 14% to 23% of total cost. Computed in 2011 dollars, the mean annual prescription cost per person increased 167%, from $665 to $1,778. During this time, development of biologic agents for several inflammatory conditions, particularly rheumatoid arthritis, occurred, as well as the widespread use of the cox-2 inhibitors (coxibs) for musculoskeletal pain, and may have accounted for some of the rapid increase. However, the growth in per-person total expenditures for prescription drugs has slowed. From 1998 to 2000 through 2002 to 2004, annual growth in expenditures for prescription drugs averaged 15%, but since 2004 has averaged about 3% a year. (Reference Table 10.4 PDF [14] CSV [15])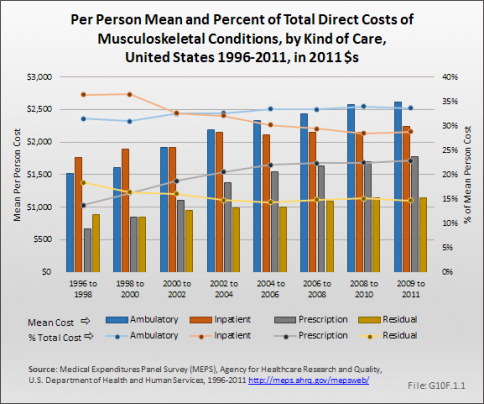
The per person increment in ambulatory care expenditures for musculoskeletal diseases grew by 51% between 1996 to 1998 and 2009 to 2011, from $570 to $859 in 2011 dollars. The increment for inpatient care more than doubled, from $102 in the 1996 to 1998 to $313 in 2009 to 2011. Ambulatory care represents the largest component of the increment in expenditures, indicative of the importance of ambulatory care in musculoskeletal diseases relative to other condition groups. (Reference Table 10.5 PDF [16] CSV [17])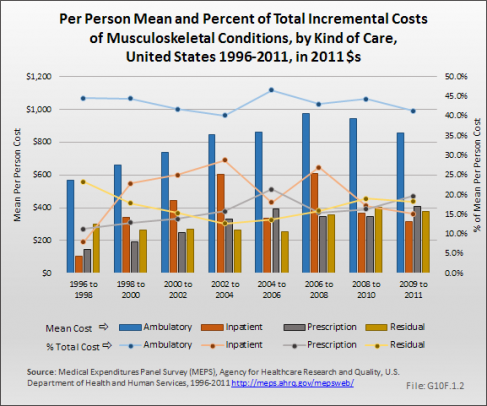
In the studies conducted by Rice and colleagues starting in the early 1960s, indirect cost associated with earnings losses due to musculoskeletal diseases constituted between 38% and 59% of the total cost of these diseases.1,2,3,4,5 The percentage shifted because in various eras, medical costs were rapidly escalating while earnings stagnated (1970s) and in other times wage growth exceeded the increase in medical costs (1960s and late 1990s). Analysis of the Medical Expenditures Panel Survey to estimate direct and indirect cost (ie, the cost of lost wages due to musculoskeletal conditions for persons age 18 to 64 years with a work history) as a proportion of GDP shows a slow but steady increase in the share of GDP accounted for by musculoskeletal conditions, from about 3.4% of GDP in 1996 to 1998 to about 5.7% in 2009 to -2011, an increase of 67%.6,7 (Reference Table 10.14 PDF [28] CSV [29])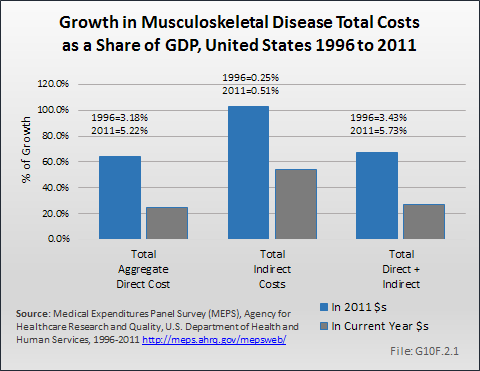
The method to estimate earnings losses is based on the notion that presence of musculoskeletal conditions is one among many factors affecting employment. Thus, estimates of total earnings losses, grew from 1996 to 1998 through the mid 2000s, then declined substantially with the recession because it became more difficult to differentiate the employment situation of persons with musculoskeletal conditions from that of similar individuals. However, when other characteristics of individuals were taken into account, the estimate of incremental earnings losses continued to trend upward, despite the recession. Overall, the average increment in earnings losses grew from $949 in 1996 to 1998 to $2,063 in 2009 to 2011, or by more than 100%. (Reference Table 10.12 PDF [30] CSV [31])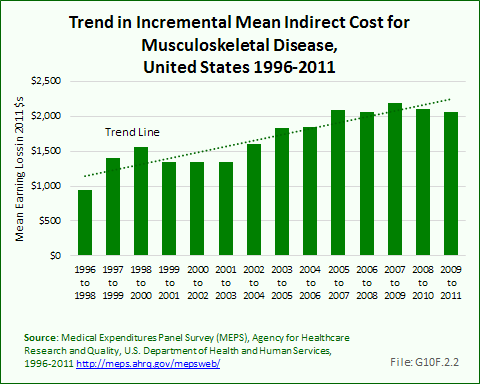
Estimates of earnings losses are limited to persons age 18 to 64 years, both because the number of workers older than 65 years in MEPS is too small to permit statistically reliable estimates in this age group and because in the United States, most workers retire by that age. However, it is probable that some individuals with musculoskeletal diseases would continue working past the age of 65 years in the absence of the condition. Similarly, the tabulation of earnings losses is limited to those who have established a work history either prior to or after the onset of disease. There may be some among those without a work history who would have begun to work in the absence of a musculoskeletal disease, but who never had the opportunity to do so. Thus, the magnitude of earnings losses shown should be considered a conservative estimate.
As of 1996 to 1998, about 48.5 million persons with a musculoskeletal disease had established a work history. On average, these individuals earned $596 in 2011 dollars less than those without musculoskeletal conditions; their earnings losses aggregated to $28.9 billion. By 2009 to 2011, the number of persons with musculoskeletal diseases and a work history had grown to over 63.3 million. On average, these workers had earnings losses of $1,224 each, or roughly a doubling. Aggregate total earnings losses grew to $77.5 billion, despite the decline associated with the recession.
Some of the estimated earnings losses of persons with musculoskeletal diseases might have occurred in the absence of these conditions because of other factors. For example, older workers and women, two groups with high rates of musculoskeletal diseases, have lower employment rates and earnings than the average US worker. The incremental earnings loss measure takes into consideration many of the factors that might cause persons to have lower earnings even without the presence of the musculoskeletal disease. Earnings losses using the incremental measure grew substantially between 1996 to 1998 and 2009 to 2011. In the earlier triad of years, the 48.5 million persons with musculoskeletal diseases and a work history sustained average incremental earnings losses of $949, or $46.1 billion overall, in 2011 dollars. Average incremental earnings losses more than doubled by 2009 to 2011, to $2,063; aggregate incremental earnings losses increased almost three-fold to $130.7 billion.
Using the more expansive definition of musculoskeletal diseases, average earnings losses rose from 1996 to 1998 through 1998 to 2000, but have been falling ever since; as of 2006 to 2008, earnings were actually greater among those included within the more expansive definition of musculoskeletal conditions than among the remainder of the working age population. In parallel, aggregate earnings losses have been falling since 1998 to 2000, turning negative in 2006 to 2008 and reaching -$158.6 billion in 2009 to 2011. (Note: Data on earnings losses of persons meeting the expansive definition of musculoskeletal diseases are not included in the tables.) Estimates of aggregate total earnings losses using the base case definition for this publication have declined from their peak in 2003 to 2005, but still are indicative of an adverse impact on earnings. It follows that the more expansive definition of conditions must necessarily include conditions which are not associated with work loss and resultant earnings losses.
Medical conditions in MEPS are self-reported and may result in misreporting of some conditions. With respect to musculoskeletal diseases, under-reporting might occur when physicians do not provide patients with a discrete diagnosis. For example, osteoarthritis may not be reported because it may be too mild to be recognized or treatment is included with other conditions and not distinct. Over-reporting of a condition could occur when respondents indicate they have a specific form of arthritis, for example, rheumatoid arthritis, even though their physician did not so indicate it. It should be noted that self-reporting of discrete medical conditions is lower than would be expected on the basis of epidemiological studies.1 As a result of differences in reporting, the measures of the aggregate economic impacts of discrete conditions summarized in Table 10.14 and select graphs throughout these pages may differ from those presented in the discussion of specific conditions in prior chapters. These discussions are based on larger samples, such as all musculoskeletal disease, or major subcategories, such as all forms of arthritis. Nevertheless, the data on expenditures do indicate, in broad stroke, the average economic impact for self-recognized disease and for conditions likely to be under-reported, such as osteoarthritis, a conservative estimate of aggregate economic impact. Estimates for discrete musculoskeletal diseases merged four years of MEPS data (2008-2011) to provide more stable estimates given the relatively few cases of each condition reported in individual years.
Average total direct cost for all four conditions studied—disorders of the back, rheumatoid arthritis, osteoarthritis and allied disorders, and gout—are relatively large. Over the period 2008 to 2011, per-person direct costs exceeded $12,000 a year for gout, $11,000 a year for osteoarthritis, $17,000 a year for rheumatoid arthritis, and just under $8,000 for disorders of the back. These costs aggregate to about $141.5 billion for gout, $339.7 for osteoarthritis, $17.8 billion for rheumatoid arthritis, and $141.5 billion for disorders of the back.
Average total earnings losses were highest for rheumatoid arthritis, $13,886 per year, followed by osteoarthritis at $7,548 per year. However, because of the lower prevalence of rheumatoid arthritis, the aggregate impact of the earnings losses for these two conditions were $12.3 billion and $121.8 billion, respectively. Persons with both gout and back disorders actually had higher earnings than the corresponding populations without those conditions. (Reference Table 10.13 PDF [33] CSV [34])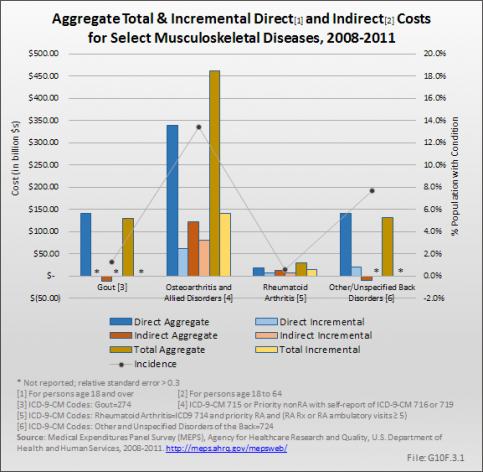
The aging of the population has increased the prevalence and prevalence rate of musculoskeletal conditions as well as health care expenditures. In the years 1996 to 1998, an average of 22 million persons age 45 to 64 years reported a musculoskeletal condition, while 16.5 million of those 65 years and older did so. By 2009 to 2011, these numbers had increased to about 39 million and 25 million, respectively. The prevalence rate of musculoskeletal conditions among persons 45 to 64 years increased from about 29% in 1996 to 1998 to about 38% in 2009 to 2011, while it increased from about 22% to about 25% among those 65 years and older.
Total aggregate medical care expenditures among persons with musculoskeletal conditions have risen substantially due to population aging as well as the general increase in medical care costs. In 2011 dollars, total aggregate expenditures increased between 1996 to 1998 and 2009 to 2011 among persons 45 to 54 years from about $111 billion to $336 billion, while they increased among those 65 years and older from about $153 billion to about $294 billion during this time. Although total per person costs increase with age, the magnitude of the increase was greater in relative terms among persons 45 to 64 years with musculoskeletal conditions (from $5,078 to $8,568, or by 69%) than among such persons 65 years and older (from $9,286 to $11,708, or by 29%).
Society has the option of passively accepting the increasing economic impact of musculoskeletal diseases, or it can seek to alleviate this impact by the use of primary, secondary, and tertiary preventive measures with strong evidence of effectiveness. Such measures run the gamut from weight loss and exercise programs to reduce the prevalence of arthritic conditions, to self-management classes designed to reduce the impact of existing conditions, to surgical and medical interventions that return the individual to higher levels of functioning and quality of life.1,2,3,4,5
In the discussion of demographic variations, disparities in medical care expenditures were identified, especially those associated with lack of health insurance. This suggests the need for equal access to effective interventions and treatment modalities to keep individuals participating in society through work and other meaningful activities. It also suggests that if health reform reduces the ranks of the uninsured, there may be benefits in reduced health care expenditures for services like total joint replacement, as well as reduced earnings losses if functional status does not decrease as profoundly after onset of musculoskeletal conditions.
The increased prevalence and increased costs associated with musculoskeletal conditions that accompany the aging of the population pose several problems for society. Clearly, at a time of cost constraints in health care, society cannot continue to devote an ever-growing share of scarce resources to the treatment of these conditions.
Much of the increase in the economic impact of treating musculoskeletal conditions is due to the increased prevalence and increased cost per case. As to the latter, the increase is due to increased use of surgical interventions and the expansion in the number and cost of prescription medicines. However, research has indicated that the prevalence rate need not increase in exact proportion as the increase in the overall population. There are preventive measures that have been discovered, such as the impact of weight loss on the prevalence of many musculoskeletal conditions, and of environmental agents in several of the conditions. In addition, researchers have uncovered several behavioral interventions that reduce the impact of the conditions once they arise, such as evidence-based exercise programs and self-management. However, relatively few resources are devoted to discovering additional behavioral interventions to reduce the prevalence and impact of these diseases. In addition, research into the causes of many of the conditions, which made substantial progress in treatment over the last several decades, has been adversely affected by the decrease in Federal basic science funding. An example is the biological agents for the treatment of autoimmune conditions such as rheumatoid arthritis.
As noted, there is likely to be a dramatic increase in the number of persons with musculoskeletal conditions seeking access to health care as a result of the ACA. This may result in increased use of mechanisms to limit access to select providers. It may also result in increased cost sharing required of those with insurance to limit their use.
The dramatic increase in the prevalence of musculoskeletal conditions would provide a challenge to the health care system even in the absence of the major changes in health care occurring as a result of the Affordable Care Act (ACA). Earlier in the chapter, it was noted there were almost 9 million persons with musculoskeletal conditions who lacked health insurance. As many of these individuals obtain insurance through the ACA, it will place additional strain the existing care system. Presently, health care expenditures for the uninsured are only about a quarter of the cost of those with public insurance, and about a third the cost of those with private insurance. As medical care access increases for the previously uninsured, result will be greater utilization of health care resources. Health insurers may respond by making it more burdensome for patients to access some resources such as specialists or they may increase the amount the insured have to pay out of pocket.
The pipeline to expand the number of health care providers able to serve persons with musculoskeletal conditions is a long one. For someone to be trained as an orthopedic surgeon may require 15 years or more, including medical school; it may take only slightly fewer years for someone to be trained as a rheumatologist. The increased access to health insurance as a result of the ACA may, therefore, strain the existing workforce.
The economic impact of musculoskeletal diseases is increasing due to a combination of factors. These factors include:
• The aging of the US population
• The concomitant increase in the prevalence of musculoskeletal diseases
• The growth in average total expenditures to treat musculoskeletal diseases
• The average total and incremental earnings losses that result from these conditions (although there was a dip in the total aggregate earnings losses associated with the recession)
Between 1996 to 1998 and 2009 to 2011, the number of persons with one or more musculoskeletal diseases grew from 76.0 million, or 28.0% of the population, to 102.5 million, or 33.2% of the population. Over this time period, average total expenditures for health care for persons with a musculoskeletal disease grew from $4,832 to $7,768 in 2011 dollars, while aggregate total expenditures grew from $367.1 billion to $796.3 billion. Average incremental expenditures for persons of similar characteristics but without a musculoskeletal disease grew from $1,280 to $2,075, but due to population growth and increased prevalence of the conditions, aggregate incremental expenditures grew from $97.3 to $212.7 billion, all in 2011 dollars.
Average per-person earnings losses between 1996 to 1998 and 2009 to 2011 due to musculoskeletal diseases increased from $596 to $1,224, while aggregate total earnings losses grew from $28.9 billion to $77.5 billion in constant 2011 dollars, even after a dip in earnings associated with the recession. Incremental earnings losses increased dramatically, from $949 to $2,063 per person and from $46.1 to $130.7 billion on an aggregate basis.
Comparing the cost of musculoskeletal diseases to the national gross domestic product (GDP) provides a perspective on these total costs. Earlier estimates summarize the evidence from the studies conducted by Dorothy Rice and colleagues, the last two of which were from prior editions of the present study.1,2 More recent comparisons for 1996 to 1998 through 2009 to 2011 summarize the data from the present analysis in 2011 constant dollars. Notwithstanding the different methods of the studies by Rice and colleagues and the analysis of MEPS from the present volume, there is no question that the direct cost of musculoskeletal diseases has a profound economic impact on the nation, now at 5.73% of GDP, or nearly doubling in less than two decades.
Economic cost for musculoskeletal-related health care diseases presented in this book are based on data from the Medical Expenditures Panel Survey (MEPS) using a methodology developed by the principal author and colleagues at the US Centers for Disease Control (CDC).1,2,3,4,5 The MEPS is a comprehensive data source designed for cost of illness studies.6,7,8,9 The MEPS uses a complex multistage probability sample of the US population and queries this sample three times annually about their medical conditions, health care utilization, and employment status, and provides information on the charges and expenditures associated with medical utilization. The authors use expenditure information to produce two types of cost estimates. The first, total cost, is an indication of all medical care costs and earnings losses incurred by persons with a musculoskeletal disease, regardless of the condition for which the cost was incurred. The second, incremental cost, is an estimate of the magnitude of cost that would be incurred beyond those experienced by persons of similar demographic and health characteristics but who do not have one or more musculoskeletal disease. Cost estimates are produced as the mean per-person medical care cost and as the aggregate, or sum of mean costs overall, associated with all persons with musculoskeletal diseases.
Early editions of this book based estimates of the economic impact of musculoskeletal diseases on the Rice cost of illness methodology.10,11 The Rice model utilized the National Hospital Discharge Survey (NHDS) and other available national health care data sources such as the National Health Interview Survey.12 All costs associated with hospitalizations or treatments for persons with a musculoskeletal disease listed as the primary, or first, diagnosis were included in the model. The Rice model defines direct cost as those associated with all components of medical care (ie, inpatient and outpatient care, medications, devices, and costs associated with procuring medical care), and indirect cost such as those associated with wage loss due to morbidity or mortality, plus an estimate of intangible costs.
In the Rice model, mortality accounted for 7% of total indirect medical cost for all conditions. The MEPS data do not provide a comparable method for calculating wage loss associated with mortality. Hence, total cost presented here represents an under-count by a similar percentage. Because musculoskeletal diseases have a smaller impact on mortality than most other major categories of illness, the under-count will be an unknown, but smaller, percentage.
Comparing total cost for 1995 (the last year that Rice updated her estimates)11 updated to 1996 terms (the first year for which MEPS data is available), and omitting cost associated with mortality, the current analysis results in $207 billion in total cost associated with musculoskeletal diseases using the Rice method and about $143 billion using the MEPS database. The difference may be due to allocating a higher proportion of diagnoses to the musculoskeletal classification in the Rice study. The difference suggests that inferring time changes between the Rice studies and those using MEPS should be done with caution.
A series of papers provide a detailed description of the methods of estimating total and incremental direct and indirect cost of conditions, and outline the regression model used to adjust for differences of persons with and without musculoskeletal diseases due to demographic characteristics and health status.2,4 As in our previous work, we applied a two-stage model to estimate musculoskeletal condition-attributable costs for ambulatory, inpatient, prescription, and other expenditures, and a four-stage model for overall expenditures. However, the present analysis differs from prior analysis due to the use of a generalized linear model with a gamma distribution and a log-link, as opposed to a log transformation with a smearing estimate applied to back-transformed predicted values, in the stages predicting costs among individuals with any positive expenditures.
Although generally prevalence and cost associated with musculoskeletal diseases increase over time, sampling variability in the MEPS does not reflect this in each successive year. The impact of sampling variability is partially mitigated by smoothing, or averaging, data across 3-year periods.
The ICD-9-CM codes used in the economic impact analysis by musculoskeletal diseases fall into the two categories of base codes and expansive codes.
Conditions included in the base musculoskeletal disease rubric include spine conditions, arthritis and joint pain, the category that includes osteoporosis (other diseases of bone and cartilage), injuries, and an inclusive “other” category for the remaining conditions. Conditions selected for the cost analysis presented are based on condition topics included in this site. Data are reported primarily for base case ICD-9-CM codes, or those codes for which musculoskeletal disease is the principal cause of the condition rather than a consequence of another major health condition (eg, bone cancer metastases from another primary cancer site).
Estimates are also provided for a more expansive list of codes of musculoskeletal-related diseases that include conditions for which musculoskeletal diseases are either the primary and secondary cause of the condition. This more expansive list of conditions yields a vastly larger prevalence estimate than the base case list. However, it is reasonable to assume the cost of musculoskeletal diseases probably exceeds the conservative estimates presented here. For example, a person with bone metastases would incur costs to treat the bone manifestation, even though the cancer, not the bone condition, is the primary etiology.
ICD-9-CM codes included in each subcategory for the base and expansive conditions are listed in subsections.
Spine
Special Symptoms or Syndromes, NEC : 307
Migraine: 346
Trigeminal Nerve Disorders : 350
Nerve Root and Plexus Disorders : 353
Dentofacial Anomalies, Including Malocclusion : 524
Pain and Other Symptoms Associated with Female Genital Organs : 625
Menopausal and Postmenopausal Disorders : 627
General Symptoms : 780
Symptoms Involving Skin and Other Integumentary Tissue : 782
Symptoms Involving Head and Neck : 784
Symptoms Involving Respiratory System and Other Chest Symptoms : 786
Symptoms Involving Digestive System : 787
Other Symptoms Involving Abdomen and Pelvis : 789
Injury to Other Cranial Nerve(s) : 951
Injury to Nerve Roots and Spinal Plexus : 953
Arthritis and Joint Pain
Gonococcal Infections : 098
Other Venereal Diseases : 099
Other and Unspecified Infectious and Parasitic Diseases : 136
Other and Unspecified Disorders of Metabolism : 277
Purpura and Other Hemorrhagic Conditions : 287
Other Paralytic Syndromes : 344
Mononeuritis of Upper Limb and Mononeuritis Multiplex : 354
Inflammatory and Toxic Neuropathy : 357
Other and Ill-defined Cerebrovascular Disease : 437
Other Peripheral Vascular Disease : 443
Polyarteritis Nodosa and Allied Conditions : 446
Other Disorders of Arteries and Arterioles : 447
Psoriasis and Similar Disorders : 696
Osteoporosis
Other Disorders of Bone and Cartilage : 733
Musculoskeletal Injuries
Open Wound of Neck : 874
Open Wound of Other and Unspecified Sites, Except Limbs : 879
Contusion of Trunk : 922
Contusion of Upper Limb : 923
Contusion of Lower Limb and of Other and Unspecified Sites : 924
Crushing Injury of Trunk : 926
Other Musculoskeletal Conditions
Other Salmonella Infections : 3
Rat-bite Fever : 26
Meningococcal Infection : 36
Rubella : 56
Other Arthropod-borne Diseases : 88
Early Syphilis, Symptomatic : 91
Other Forms of Late Syphilis, with Symptoms : 95
Yaws : 102
Late Effects of Tuberculosis : 137
Malignant Neoplasm of Other and Ill-defined Sites : 195
Secondary Malignant Neoplasm of Other Specified Sites : 198
Other Malignant Neoplasms of Lymphoid and Histiocytic Tissue : 202
Multiple Myeloma and Immunoproliferative Neoplasms : 203
Other Benign Neoplasm of Connective and Other Soft Tissue : 215
Neoplasm of Uncertain Behavior of Other and Unspecified Sites and Tissues : 238
Neoplasms of Unspecified Nature : 239
Disorders of Parathyroid Gland : 252
Disorders of Lipoid Metabolism : 272
Disorders of Mineral Metabolism : 275
Hereditary Hemolytic Anemias : 282
Organic Sleep Disorders : 327
Mononeuritis of Lower Limb and Unspecified Site : 355
Peritonitis and Retroperitoneal Infections : 567
Other Cellulitis and Abscess : 682
Other and Unspecified Congenital Anomalies : 759
Late Effects of Injuries to Skin and Subcutaneous Tissues : 906
Certain Early Complications of Trauma : 958
Complications Peculiar to Certain Specified Procedures : 996
Personal History of Other Diseases : V13
Organ or Tissue Replaced By Transplant : V42
Organ or Tissue Replaced By Other Means : V43
Other Postprocedural States : V45
Problems with Head, Neck, and Trunk : V48
Fitting and Adjustment of Other Device : V53
Convalescence and Palliative Care : V66
Follow-up Examination : V67
Special Screening Examination for Bacterial and Spirochetal Diseases : V74
Spine
Special Symptoms or Syndromes, NEC : 307
Migraine : 346
Trigeminal Nerve Disorders : 350
Nerve Root and Plexus Disorders : 353
Dentofacial Anomalies, Including Malocclusion : 524
Pain and Other Symptoms Associated with Female Genital Organs : 625
Menopausal and Postmenopausal Disorders : 627
General Symptoms : 780
Symptoms Involving Skin and Other Integumentary Tissue : 782
Symptoms Involving Head and Neck : 784
Symptoms Involving Respiratory System and Other Chest Symptoms : 786
Symptoms Involving Digestive System : 787
Other Symptoms Involving Abdomen and Pelvis : 789
Injury to Other Cranial Nerve(s) : 951
Injury to Nerve Roots and Spinal Plexus : 953
Arthritis and Joint Pain
Gonococcal Infections : 098
Other Venereal Diseases : 099
Other and Unspecified Infectious and Parasitic Diseases : 136
Other and Unspecified Disorders of Metabolism : 277
Purpura and Other Hemorrhagic Conditions : 287
Other Paralytic Syndromes : 344
Mononeuritis of Upper Limb and Mononeuritis Multiplex : 354
Inflammatory and Toxic Neuropathy : 357
Other and Ill-defined Cerebrovascular Disease : 437
Other Peripheral Vascular Disease : 443
Polyarteritis Nodosa and Allied Conditions : 446
Other Disorders of Arteries and Arterioles : 447
Psoriasis and Similar Disorders : 696
Osteoporosis
Due to small sample sizes, no additional codes were included in the expansive analysis.
Musculoskeletal Injuries
Open Wound of Neck : 874
Open Wound of Other and Unspecified Sites, Except Limbs : 879
Contusion of Trunk : 922
Contusion of Upper Limb : 923
Contusion of Lower Limb and of Other and Unspecified Sites : 924
Crushing Injury of Trunk : 926
Other Musculoskeletal Conditions
Other Salmonella Infections : 3
Rat-bite Fever : 26
Meningococcal Infection : 36
Rubella : 56
Other Arthropod-borne Diseases : 88
Early Syphilis, Symptomatic : 91
Other Forms of Late Syphilis, with Symptoms : 95
Yaws : 102
Late Effects of Tuberculosis : 137
Malignant Neoplasm of Other and Ill-defined Sites : 195
Secondary Malignant Neoplasm of Other Specified Sites : 198
Other Malignant Neoplasms of Lymphoid and Histiocytic Tissue : 202
Multiple Myeloma and Immunoproliferative Neoplasms : 203
Other Benign Neoplasm of Connective and Other Soft Tissue : 215
Neoplasm of Uncertain Behavior of Other and Unspecified Sites and Tissues : 238
Neoplasms of Unspecified Nature : 239
Disorders of Parathyroid Gland : 252
Disorders of Lipoid Metabolism : 272
Disorders of Mineral Metabolism : 275
Hereditary Hemolytic Anemias : 282
Organic Sleep Disorders : 327
Mononeuritis of Lower Limb and Unspecified Site : 355
Peritonitis and Retroperitoneal Infections : 567
Other Cellulitis and Abscess : 682
Other and Unspecified Congenital Anomalies : 759
Late Effects of Injuries to Skin and Subcutaneous Tissues : 906
Certain Early Complications of Trauma : 958
Complications Peculiar to Certain Specified Procedures : 996
Personal History of Other Diseases : V13
Organ or Tissue Replaced By Transplant : V42
Organ or Tissue Replaced By Other Means : V43
Other Postprocedural States : V45
Problems with Head, Neck, and Trunk : V48
Fitting and Adjustment of Other Device : V53
Convalescence and Palliative Care : V66
Follow-up Examination : V67
Special Screening Examination for Bacterial and Spirochetal Diseases : V74
Links:
[1] https://bmus.latticegroup.com/meps.ahrq.gov/mepsweb/
[2] http://www.bea.gov/national/index.htm#gdp
[3] https://bmus.latticegroup.com/docs/T10001.1.pdf
[4] https://bmus.latticegroup.com/docs/T10001.1.csv
[5] https://bmus.latticegroup.com/docs/T10002.1.1.pdf
[6] https://bmus.latticegroup.com/docs/T10002.1.1.csv
[7] https://bmus.latticegroup.com/2014-report/xl0/economic-cost-icd-9-cm-codes
[8] https://bmus.latticegroup.com/docs/T10004.3.pdf
[9] https://bmus.latticegroup.com/docs/T10004.3.csv
[10] https://bmus.latticegroup.com/docs/T10003.2.pdf
[11] https://bmus.latticegroup.com/docs/T10003.2.csv
[12] https://bmus.latticegroup.com/docs/T10007.6.pdf
[13] https://bmus.latticegroup.com/docs/T10007.6.csv
[14] https://bmus.latticegroup.com/docs/T10005.4.pdf
[15] https://bmus.latticegroup.com/docs/T10005.4.csv
[16] https://bmus.latticegroup.com/docs/T10006.5.pdf
[17] https://bmus.latticegroup.com/docs/T10006.5.csv
[18] https://bmus.latticegroup.com/docs/T10008.7.pdf
[19] https://bmus.latticegroup.com/docs/T10008.7.csv
[20] https://bmus.latticegroup.com/docs/T10009.8.pdf
[21] https://bmus.latticegroup.com/docs/T10009.8.csv
[22] https://bmus.latticegroup.com/docs/T10010.9.pdf
[23] https://bmus.latticegroup.com/docs/T10010.9.csv
[24] https://bmus.latticegroup.com/docs/T10011.10.pdf
[25] https://bmus.latticegroup.com/docs/T10011.10.csv
[26] https://bmus.latticegroup.com/docs/T10012.11.pdf
[27] https://bmus.latticegroup.com/docs/T10012.11.csv
[28] https://bmus.latticegroup.com/docs/T10015.14.pdf
[29] https://bmus.latticegroup.com/docs/T10015.14.csv
[30] https://bmus.latticegroup.com/docs/T10013.12.pdf
[31] https://bmus.latticegroup.com/docs/T10013.12.csv
[32] http://meps.ahrq.gov/mepsweb/about_meps/Price_Index.shtml
[33] https://bmus.latticegroup.com/docs/T10014.13.pdf
[34] https://bmus.latticegroup.com/docs/T10014.13.csv