BMUS: The Burden of Musculoskeletal Diseases in the United States
Published on BMUS: The Burden of Musculoskeletal Diseases in the United States (https://bmus.latticegroup.com)

Home > Topics > The Big Picture

The Big Picture

I.0

Lead Author(s): 

Stuart I. Weinstein, MD
Edward H. Yelin, PhD

Supporting Author(s): 

Sylvia I. Watkins-Castillo, PhD

Musculoskeletal conditions are among the most disabling and costly conditions suffered by Americans. In March 2002, President George W. Bush proclaimed the years 2002–2011 as the United States Bone and Joint Decade, providing national recognition to the fact that musculoskeletal disorders and diseases are the leading cause of physical disability in this country.1,2 At the end of the decade, the multiple associations of health providers treating musculoskeletal diseases realized the work had only begun, and the United States Bone and Joint Initiative (USBJI), a part of the Global Alliance for Musculoskeletal Health, was created.

In December 2012, a study on the Global Burden of Disease and the worldwide impact of all diseases and risk factors found musculoskeletal conditions such as arthritis and back pain affect more than 1.7 billion people worldwide, are the second greatest cause of disability, and have the 4th greatest impact on the overall health of the world population when considering both death and disability. Professor Christopher Murray, lead investigator, and the authors of the study underline the need to address the rising numbers of individuals with a range of conditions such as musculoskeletal disorders that largely address disability, not mortality, in the future.3

The goal of USBJI is to improve the quality of life for people with musculoskeletal conditions and to advance understanding and treatment of these conditions through research, prevention, and education. The cornerstone of USBJI is the burden of musculoskeletal disease, defined as the incidence and prevalence of musculoskeletal conditions; the resources used to prevent, care, and cure them; and the impact on individuals, families, and society. Direct costs of the burden of musculoskeletal disease include hospital inpatient, hospital emergency and outpatient services, physician outpatient services, other practitioner services, home health care, prescription drugs, nursing home cost, prepayment, and administration and non–health-sector costs. Indirect cost relates to morbidity and mortality, including the value of productivity losses due to disability or premature death due to a disease and the value of lifetime earnings as well as the impact on quality of life.

The Burden of Musculoskeletal Conditions in the United States, 3rd Edition, (BMUS) which is available in the following pages on this website, provides numbers to support members engaged in research, education programs, and healthcare policy that will bring about significant advances in the knowledge, diagnosis, and treatment of musculoskeletal conditions, and increase the number of resources at the disposal of the healthcare profession and the public at large.

As the US population continues to age in the next 25 years, musculoskeletal impairments will increase because they are most prevalent in the older segments of the population. By the year 2040, the number of individuals in the United States older than the age of 65 years is projected to grow from the current 15% of the population to 21%. Persons age 85 years and older will double from the current <2% to 4%. Health care services worldwide will be facing severe financial pressures in the next 10 to 20 years due to the escalation in the number of people affected by musculoskeletal diseases. Bone and joint disorders account for more than one-half of all chronic conditions in people older than 50 years of age in developed countries, and are the most common cause of severe, long-term pain and disability.4 
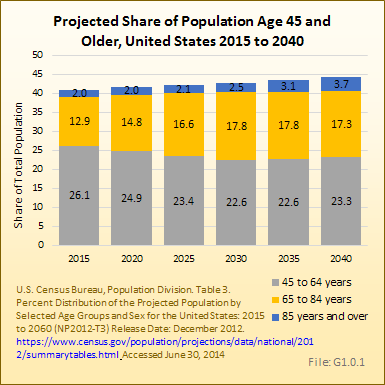
Projected Share of Population Age 45 and Older, United States 2015 to 2040


  • 1. Weinstein S: 2000–2010: The Bone and Joint Decade. J Bone Joint Surg Am 2000;82:1-3.
  • 2. A Proclamation by the President of the United States of America: National Bone and Joint Decade Proclamation: National Bone and Joint Decade, 2002–2011. Office of the Press Secretary, 2002.
  • 3. Global Burden of Diseases, Injuries and Risk Factors Study 2013. The Lancet, July 22, 2014. Available at: http://www.thelancet.com/themed/global-burden-of-disease  [1]  Accessed June 30, 2014.
  • 4. The Bone and Joint Decade 2000–2010 for prevention and treatment of musculoskeletal disorders. Lund, Sweden, April 17–18, 1998. Conference proceedings. Acta Orthop Scand Suppl 1998;:218:1-86.

Edition: 

  • 2014

Funding

I.A.0

Lead Author(s): 

Stuart I. Weinstein, MD
Edward H. Yelin, PhD

Supporting Author(s): 

Sylvia I. Watkins-Castillo, PhD

In spite of the widespread prevalence of musculoskeletal conditions and three of the most costly healthcare conditions—trauma, back pain, and arthritis—being musculoskeletal, musculoskeletal conditions are not among the top ten health conditions receiving research funding,1 primarily due to the low mortality from musculoskeletal conditions in comparison with other health conditions. However, the morbidity cost of musculoskeletal conditions is tremendous because musculoskeletal conditions often restrict activities of daily living, cause lost work days, and are a source of lifelong pain.

In 1998, the Institute of Medicine wrote “In setting national priorities NIH should strengthen its analysis in the use of health data, such as burdens of disease, and of data on the impact of research and the health of the public.”2 National health data in several countries show that musculoskeletal conditions rank among the top health concerns for citizens in the United States and worldwide. By current US estimates, more than 50% of the disabling conditions reported by of persons age 18 years and older are related to musculoskeletal disorders, yet research funding to alleviate these major health conditions remains substantially below that of other major health conditions such as cancer and respiratory and circulatory (eg, heart) diseases. (Reference Table 1.5.1 PDF [2] CSV [3])

The National Institute of Arthritis and Musculoskeletal and Skin Diseases (NIAMS) was formed in 1987. In subsequent years, research funding for these conditions has declined in relative terms, and since 2000, less than 2% of the annual National Institutes of Health (NIH) budget has been appropriated to musculoskeletal disease research. In fact, the annual average rate of funding continues to decline. Over the last five years (2009 to 2013), funding for musculoskeletal conditions from NIH totaled $7.8 billion, while that of cancers and heart/circulatory disorders totaled $43.5 billion and $25.9 billion, respectively. (Reference Table 1.1.1 PDF [4] CSV [5], and Table 1.1.2 PDF [6] CSV [7])
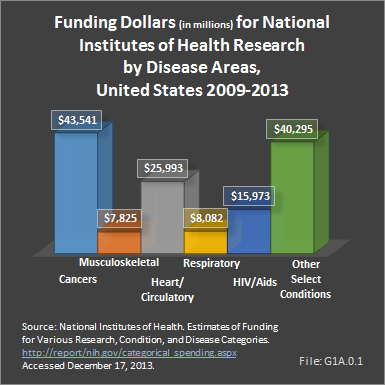
Funding Dollars (in millions) for National Institutes of Health Research by Disease Areas, United States 2009-2013
In spite of the major health care burden presented by musculoskeletal conditions, research funding falls well below that of most other conditions. Injury research commands half of the musculoskeletal condition research dollars ($4 billion) from NIH for the years 2009 to 2013. Funding for arthritis research is second, at $1.4 billion, followed by osteoporosis ($965 million). These numbers are well below the $8.6 to $55.2 billion in funding for the top 25 NIH research areas. (Reference Table 1.1.3 PDF [8] CSV [9])
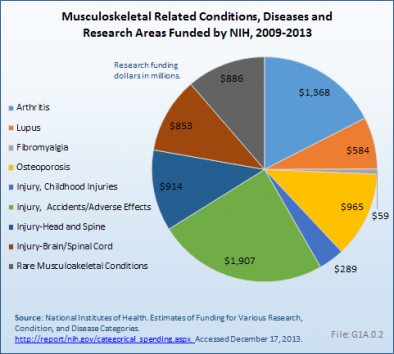
Musculoskeletal Related Conditions, Diseases and Research Areas Funded by NIH, 2009-2013
Since 1998, NIAMS has received 2.2% of research project grants, with funding at less than 2% of total grant dollars. Career development awards during this period have risen from 2.9% in 1998 to 4.5% in 2013. (Reference table 1.1.4 PDF [10] CSV [11])

"Time and again, when the global burdens of disease are enumerated, musculoskeletal conditions rank high.  Now we see that that rank is increasing.  Although research funding reflects a long-term bias towards diseases with high mortality rates, the Global Burden of Disease project indicates that much of the growth in disease burdens has occurred for conditions that cause high disability rates.  Redressing the funding disparity should become a high priority," (Edward H. Yelin, PhD, MCP, co-chair, BMUS3)

Although musculoskeletal conditions are common, disabling, and costly, they remain under-recognized, under-appreciated, and under-resourced. This book provides a strong case for the immediate and ongoing need to understand and support musculoskeletal conditions and reduce the burden it brings to our people.

  • 1. Michaud CM, Murray CJL, Bloom BR: Burden of disease: Implications for future research. JAMA 2001;285:535-539.
  • 2. Committee on the NIH Research Priority-Setting Process; Institute of Medicine: Scientific Opportunities and Public Needs: Improving Setting and Public Input. Washington, DC, National Academies Press, 1998.

Edition: 

  • 2014

Prevalence of Select Medical Conditions

I.B.0
United States Population

Lead Author(s): 

Stuart I. Weinstein, MD
Edward H. Yelin, PhD

Supporting Author(s): 

Sylvia I. Watkins-Castillo, PhD

In the National Health Interview Survey (NHIS) in 2012, musculoskeletal medical conditions were reported by 126.6 million adults in the United States, representing more than one in two persons age 18 and over of the estimated 2012 population. The rate of chronic musculoskeletal conditions found in the adult population is 76% greater than that of chronic circulatory conditions, which include coronary and heart conditions, and nearly twice that of all chronic respiratory conditions. On an age-adjusted basis, musculoskeletal conditions are reported by 54 persons per every 100 in the population. This compares to a rate of 31 and 28 persons per every 100 in the population for circulatory and respiratory conditions, respectively. The NHIS annual survey of self-reported health conditions is used throughout this chapter to highlight chronic health conditions of the US population. (Reference Table 1.2.1 PDF [12] CSV [13])
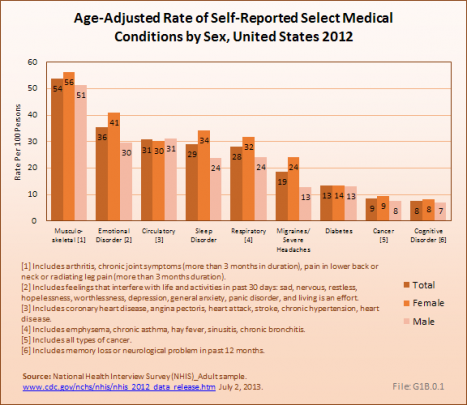
Age-Adjusted Rate of Self-Reported Select Medical Conditions by Sex, United States 2012
On an age-adjusted basis, females report a higher rate of occurrence than males for most major medical conditions. Among females, 56 out of every 100 females in the population report musculoskeletal conditions; among males the rate is only slightly lower at 51 per 100, a slight increase in recent years. (Reference Table 1.2.1 PDF [12] CSV [13])

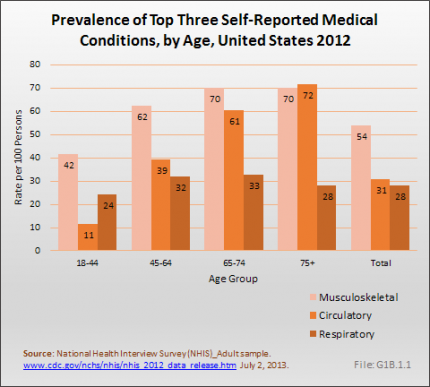
Musculoskeletal conditions are found among all age groups, with the proportion of persons reporting these conditions increasing with age. Musculoskeletal conditions are reported by nearly three of four (70%) persons age 65 years and over. This compares to the 61% of persons age 65 to 74 years, and only slightly less than the 72% of those aged 75 years and older, reporting circulatory conditions, the majority of whom report chronic hypertension. (Reference Table 1.2.2 PDF [14] CSV [15] and Table 1.3.2 PDF [16] CSV [17])

Musculoskeletal conditions were reported at a higher rate among whites and persons of mixed or other races, with 56 and 57 persons, respectively, in every 100 person in the population reporting a musculoskeletal condition. Among persons of the black/African American race, 48 in 100 reported a musculoskeletal condition. Persons of Asian descent reported the lowest level of musculoskeletal conditions, at a rate of 40 persons in every 100 persons in the population. (Reference Table 1.2.3 PDF [18] CSV [19]) The rate of musculoskeletal conditions among black/African Americans and those of Asian descent increased by several percentage points from those reported in 2008.1
  • 1. The Burden of Musculoskeletal Diseases in the United States, Second Edition, American Academy of Orthopaedic Surgeons, Rosemont, IL. 2008

Edition: 

  • 2014

Musculoskeletal, Circulatory, and Respiratory Conditions

I.B.1

Lead Author(s): 

Stuart I. Weinstein, MD
Edward H. Yelin, PhD

Supporting Author(s): 

Sylvia I. Watkins-Castillo, PhD
On an age-adjusted basis, musculoskeletal conditions are reported equally or more frequently than other common chronic or serious medical conditions related to the circulatory or respiratory systems by persons age 18 and older. Three of the four most common medical conditions reported in 2012 were musculoskeletal conditions: low back pain, chronic joint pain, and arthritis. The other most commonly reported medical condition is chronic hypertension. (Reference Table 1.3.1 PDF [20] CSV [21])
Prevalence of Top Three Self-Reported Medical Conditions, by Age, United States 2012
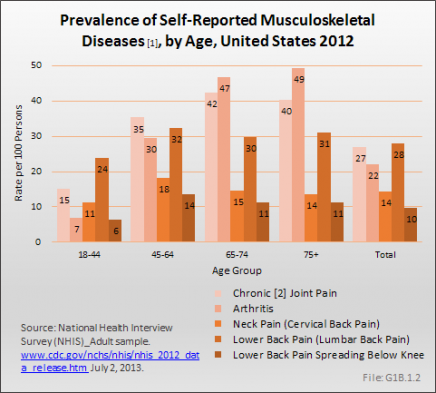
Nearly 66 million adults reported low back pain, the most frequently reported musculoskeletal condition, with an age-adjusted rate of 28 in 100 persons age 18 or older reporting this condition. Among persons reporting low back pain, nearly 23 million, or more than one-third, also reported pain radiating down the leg below the knee. Cervical/neck pain is also a commonly reported musculoskeletal disease, reported by 33.5 million adults in 2012.

In recent years, chronic joint pain, defined as joint pain lasting three months or longer, has approached the level of low back pain as a common musculoskeletal condition. Chronic joint pain, was reported by 63.1 million adults age 18 and older (27 of 100 persons), while 51.8 million (22 in 100) reported having been diagnosed with arthritis. Chronic joint pain and arthritis are not mutually exclusive and may be reported by the same individual. Although age is a general predictor of chronic joint pain and arthritis, with more than 4 in 10 persons age 65 years and older reporting one or both of these conditions, the rate of reported chronic joint pain in younger persons is rapidly increasing. In 2012, nearly one in five persons age 18 to 44 reported they experienced chronic joint pain, while one-third (35%) age 45 to 64 reported chronic joint pain. Active lifestyles will continue to be a major cause of joint pain in the coming years. (Reference Table 1.3.2 PDF [16] CSV [17]) Prevalence of Self-Reported Musculoskeletal Diseases, by Age, United States 2012
Chronic hypertension, defined as hypertension diagnosed at two or more physician visits, is the only other medical condition that approaches the rate of chronic musculoskeletal conditions. Among adults age 18 and older, 59.8 million persons reported chronic hypertension in 2012, an age-adjusted rate of 25 in 100 persons. Coronary or heart conditions, which increase with age, were reported by 26.6 million, a rate of 11 per 100 persons. Chronic respiratory ailments, while common, are reported in significantly lower numbers, with sinusitis, reported by 28.5 million (12 per 100) persons, the most common condition.

Sex is a greater predictor of chronic musculoskeletal and respiratory conditions than of chronic circulatory conditions. Among all musculoskeletal and respiratory conditions, females are more likely to report a specific condition than are males. Similar proportions of males and females reported chronic circulatory conditions in 2012. (Reference Table 1.3.1 PDF [20] CSV [21])

Chronic circulatory and respiratory conditions do not show the racial variation seen in musculoskeletal conditions, with the exception of the Asian population reporting nearly all conditions at lower rates than other races. Musculoskeletal conditions, overall, are reported in higher proportions by persons of the white race than by persons of the black/African American or Asia races. Persons of other or mixed race as well as persons of white race report slightly higher rates of musculoskeletal conditions that those of the black/African American and Asian race. Chronic hypertension is highest among those of black/African American races. (Reference Table 1.3.3 PDF [22] CSV [23])

Edition: 

  • 2014

Chronic Joint Pain

I.B.2

Lead Author(s): 

Stuart I. Weinstein, MD
Edward H. Yelin, PhD

Supporting Author(s): 

Sylvia I. Watkins-Castillo, PhD

Chronic joint pain increases with age, but peaks in the 65- to 74-year age group. Among the 63.1 million persons reporting chronic joint pain in 2012, knee pain is the most frequently cited, with 40 million people reporting knee pain. Chronic knee pain is reported by all ages older than 18Proportion of Population [1] Age 18 and Older Reporting Joint Pain [2], United States 2012 years, with more than one in four aged 65 and older reporting knee pain. Shoulder pain, reported by 18.7 million of those age 18 and older, is the second most common joint for chronic pain, with rates fairly equal for those age 45 and older. Hip pain was reported by 15.3 million persons age 18 and older.

While multiple joints can be the source of chronic joint pain, overall, one in four people over the age of 18 report chronic joint pain. The ratio jumps to more than two in five after the age of 65 years. However, even among younger adults age 18 to 44, about one in six report chronic joint pain. (Reference Table 1.4.2 PDF [24] CSV [25])

Females report higher rates of chronic joint pain than do males, with the exception of shoulder pain. Race is not a variable in the rate of chronic joint pain, with the exception of those of Asian race, who report lower joint pain rates than other racial groups. (Reference Table 1.4.1 PDF [26] CSV [27] and Table 1.4.3 PDF [28] CSV [29])
Edition: 

  • 2014

Activity Limitation Due to Select Medical Conditions

I.C.0

Lead Author(s): 

Stuart I. Weinstein, MD
Edward H. Yelin, PhD

Supporting Author(s): 

Sylvia I. Watkins-Castillo, PhD
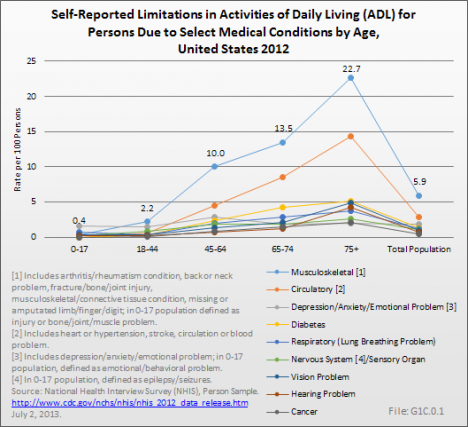
Participants in the 2012 NHIS survey were asked about limitations they experience in activities of daily living (ADL) because of medical conditions. More than 34.5 million adults age 18 years and older, or 13% of the population, report they have difficulty performing routine ADL without assistance because of medical conditions. An additional 6.3 million children between the ages of 1 and 17 years are reported by their parents as needing more assistance in daily activities than would be expected for their age because of to a medical condition. While more than one medical condition could be reported, and often was, approximately one-half of both adults and children with ADL had a musculoskeletal condition that limits their activities. As the population ages, the prevalence rate in the population reporting limitations in ADL increases, and approaches one in four persons older than 75 years of age. (Reference Table 1.5.2 PDF [30] CSV [31])
Self-Reported Limitations in Activities of Daily Living (ADL) for Persons Due to Select Medical Conditions by Age, United States 2012 
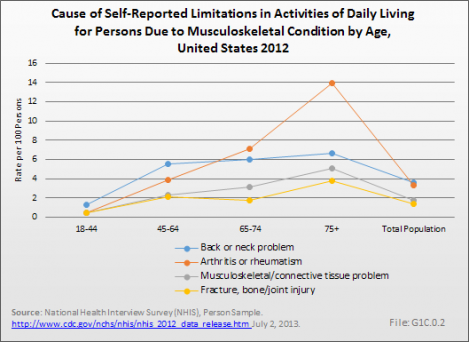
Back and neck problems are the most common musculoskeletal condition to cause limitations in ADL. However, as the population ages, arthritis or rheumatism is a more common cause. The mean years of duration reported for all musculoskeletal conditions is 12 to 17 years. Although there is an increase in years of duration as the population ages, even among young adults age 18 to 44, the duration of musculoskeletal conditions causing limitations is 8 to 10 years. (Reference Table 1.6.2 PDF [32] CSV [33])
Cause of Self-Reported Limitations in Activities of Daily Living for Persons Due to Musculoskeletal Condition by Age, United States 2012
Reflecting the overall prevalence of medical conditions in females, they are also more likely to report impairment in ADL than are males. This is particularly true for musculoskeletal conditions. Females account for 52% of all persons reporting they are limited in activities of daily living; they account for 59% of those reporting a musculoskeletal condition impairment. Two of three adults age 18 and older (67%) reporting arthritis as a cause for ADL limitations are female, while 72% report connective tissue problems, including fibromyalgia, as the cause. (Reference Table 1.5.1 PDF [2] CSV [3] and Table 1.6.1 PDF [34] CSV [35])

Members of the white and black/African American populations report limitations because of medical conditions in approximately the same proportions. Members of the Asian population are significantly less likely to report ADL limitations because of a medical condition. Members of other or mixed race are slightly more likely to report a limitation than found in other races. (Reference Table 1.5.3 PDF [36] CSV [37] and Table 1.6.3 PDF [38] CSV [39])

Edition: 

  • 2014

ADL Unable to Perform

I.C.1

Lead Author(s): 

Stuart I. Weinstein, MD
Edward H. Yelin, PhD

Supporting Author(s): 

Sylvia I. Watkins-Castillo, PhD

While most major medical conditions have a higher proportion of persons age 18 years and older who are unable to perform ADL or to work, the much higher incidence of musculoskeletal conditions results in the highest limitation rates. For example, 60% of persons with a circulatory condition report they are unable to work because of the condition, while 48% of persons with a musculoskeletal condition report this. However, the rate per 1,000 persons in the general population unable to work is 28.5 for a musculoskeletal condition, compared to 17.4 for persons with a circulatory condition. (Reference Table 1.7 PDF [40] CSV [41])
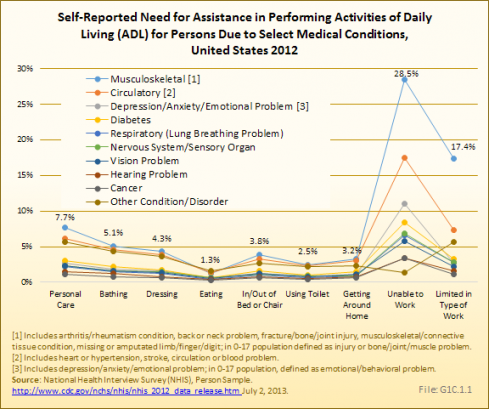
Self-Reported Need for Assistance in Performing Activities of Daily Living (ADL) for Persons Due to Select Medical Conditions, United States 2012 

Edition: 

  • 2014

Lost Work Days and Bed Days

I.D.0

Lead Author(s): 

Stuart I. Weinstein, MD
Edward H. Yelin, PhD

Supporting Author(s): 

Sylvia I. Watkins-Castillo, PhD

Respondents to the 2012 NHIS self-reported the number of bed days and lost work days they experienced in the previous 12 months due to a variety of medical conditions. A bed day is defined as one-half or more days in bed because of injury or illness in past 12 months, excluding hospitalization. A missed, or lost, work day is defined as absence from work because of illness or injury in the past 12 months, excluding maternity or family leave.

Although the exact cause of these bed and lost work days cannot be determined because some respondents reported multiple health conditions, 70% of persons reporting bed and lost work days reported having a musculoskeletal condition. This is more than twice the proportion reporting depression, the second most common medical condition listed for causing lost work days, and five or more times the proportion for other major health conditions. Overall, the high proportion of workers reporting lost work days or bed days as a result of a musculoskeletal condition results in an economic burden on the economy—much higher than that reported for chronic circulatory or chronic respiratory conditions. (Reference Table 1.8.3 PDF [42] CSV [43])

Edition: 

  • 2014

Bed Days

I.D.1

Lead Author(s): 

Stuart I. Weinstein, MD
Edward H. Yelin, PhD

Supporting Author(s): 

Sylvia I. Watkins-Castillo, PhD

More than one in three persons (34%) reported at least one bed day in the previous 12 months because of a medical condition. One in four (24.5%) reported having a musculoskeletal condition, six times the rate reported for depression and circulatory conditions, the second and third most common conditions reported.
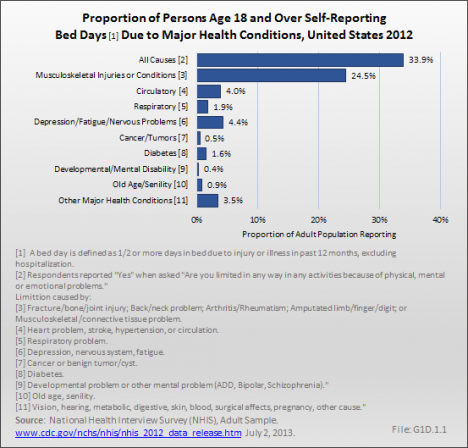
Proportion of Persons Age 18 and Over Self-Reporting Bed Days Due to Major Health Conditions, United States 2012
The average number of bed days reported by persons with musculoskeletal conditions was 9, for a total of more than 752 million bed days among persons with these conditions. Although the average number of bed days reported for other major health conditions was greater than for musculoskeletal conditions, the much higher proportion of the population with bed days because of musculoskeletal conditions resulted in the much higher number of total days. (Reference Table 1.8.1 PDF [44] CSV [45] and Table 1.8.3 PDF [42] CSV [43])

Females and persons age 45 to 64 report higher rates of bed days because of musculoskeletal conditions than do males and adults age 18 to 44 or over 65. (Reference Table 1.8.4 PDF [46] CSV [47] and Table 1.8.5 PDF [48] CSV [49])

Edition: 

  • 2014

Lost Work Days

I.D.2

Lead Author(s): 

Stuart I. Weinstein, MD
Edward H. Yelin, PhD

Supporting Author(s): 

Sylvia I. Watkins-Castillo, PhD

Twenty-eight million persons with a musculoskeletal condition, or roughly one in eight people in the prime working ages between 18 and 64 in the United States in 2012, reported lost work days in the previous 12 months, totaling more than 216 million days. Lost work days for persons with a musculoskeletal conditions accounted for more than four times as many days as the second highest condition, which was depression. Chronic circulatory conditions, including high blood pressure and heart conditions, accounted for 32.3 million lost work days, and were reported by only 1% of the working age population. Chronic respiratory conditions accounted for 16.5 million lost work days. On average, workers lost nearly 8 days in a 12-month period because of musculoskeletal conditions. Workers lost an average of 15 days because of circulatory conditions, but with a much smaller prevalence than musculoskeletal conditions. (Reference Table 1.8.2 PDF [50] CSV [51], and Table 1.8.3 PDF [42] CSV [43])
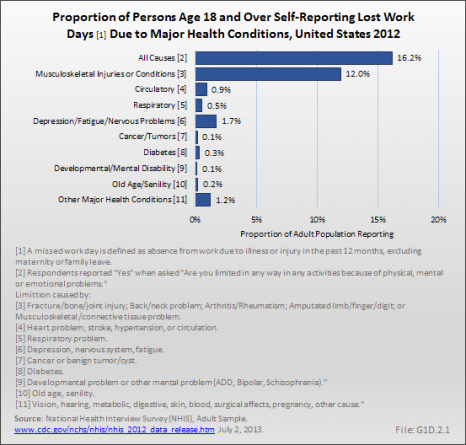
Proportion of Persons Age 18 and Over Self-Reporting Lost Work Days Due to Major Health Conditions, United States 2012
As with bed days, females and persons age 45 to 64 report higher rates of lost work days because of musculoskeletal conditions than do males and adults age 18 to 44 or over 65. (Reference Table 1.8.4 PDF [46] CSV [47], and Table 1.8.5 PDF [48] CSV [49])
Edition: 

  • 2014

Musculoskeletal Diagnoses

I.E.0

Lead Author(s): 

Stuart I. Weinstein, MD
Edward H. Yelin, PhD

Supporting Author(s): 

Sylvia I. Watkins-Castillo, PhD
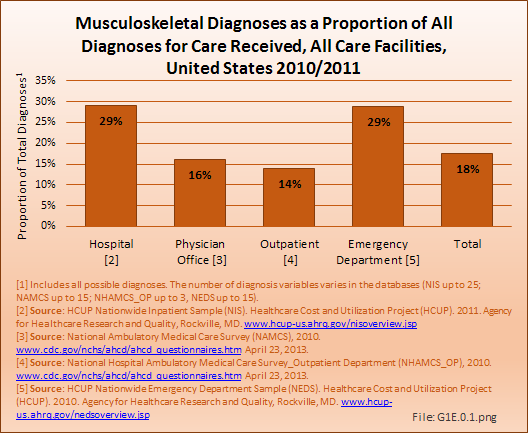
Musculoskeletal diagnoses accounted for 18%, or 223.6 million, of the 1.3 billion medical diagnoses, included in hospital discharge records, emergency department and outpatient clinic visits, and physician office visits in the United States in 2010 and 2011. (Reference Table 1.10.1 PDF [52] CSV [53] and Table 1.10.2 PDF [54] CSV [55])
Musculoskeletal Diagnoses as a Proportion of All Diagnoses for Care Received, All Care Facilities, United States 2010/2011
On average, each person in the United States received medical care for four diagnoses over the year, or 4,128 diagnoses per a population of 1,000. Of these, 723 diagnoses were for musculoskeletal conditions. The most common musculoskeletal diagnoses are "other and unspecified disorders of the back" and "other and unspecified disorders of joints," with 127.2 and 86.6 diagnoses per 1,000 persons, respectively.  (Reference Table 1.10.3 PDF [56] CSV [57])

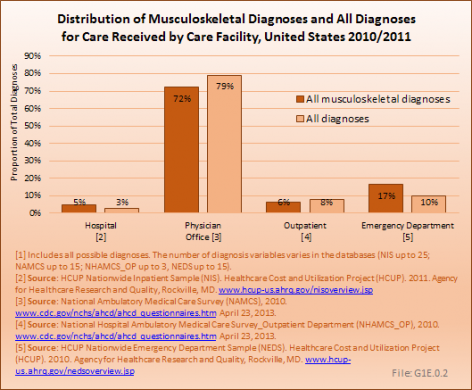
The majority of all diagnoses and musculoskeletal diagnoses are made in a physician office. However, hospital discharges and emergency department visits are seen more frequently for musculoskeletal conditions than for health care visits for all conditions overall. (Reference Table 1.10.2 PDF [54] CSV [55])
Distribution of Musculoskeletal Diagnoses and All Diagnoses for Care Received by Care Facility, United States 2010/2011

Edition: 

  • 2014

Health Care Utilization and Economic Cost

I.F.0
Musculoskeletal Diseases

Lead Author(s): 

Stuart I. Weinstein, MD
Edward H. Yelin, PhD

Supporting Author(s): 

Sylvia I. Watkins-Castillo, PhD
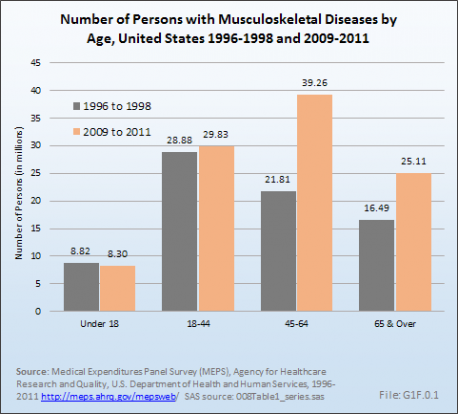
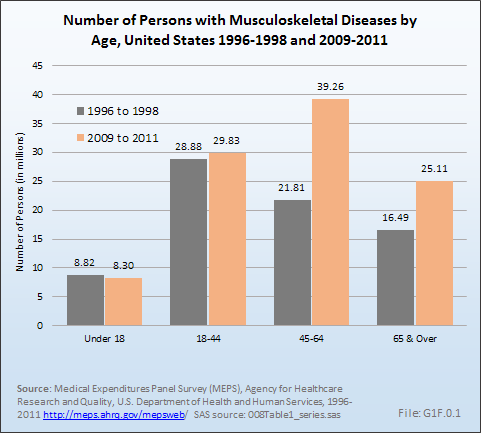
The annual average proportion of the US population with a musculoskeletal condition requiring medical care has increased by more than five percentage points over the past decade and now constitutes more than 33% of the population. This is an overall rate of increase of 19%. The majority of growth in both the proportion of the population, and in the number of people, with a musculoskeletal condition is in the 45 to 64-year age bracket, with persons age 65 years and older with musculoskeletal conditions also rising. (Reference Table 10.1 PDF [58] CSV [59] and Table 10.1.1 PDF [60] CSV [61])
Number of Persons with Musculoskeletal Diseases by Age, United States 1996-1998 and 2009-2011
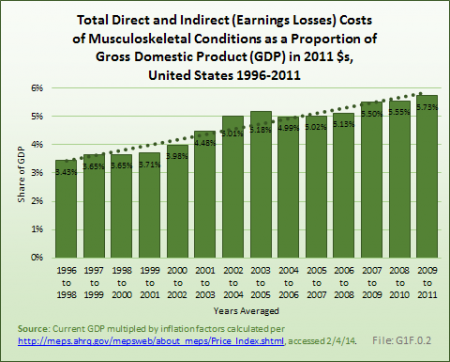
The annual estimated direct and indirect cost attributable to persons with a musculoskeletal disease is $213 billion. Taking into account all costs for persons with a musculoskeletal disease including other comorbid conditions, the cost of treating these individuals and the cost to society in the form of decreased wages is estimated to currently be nearly $874 billion per year. Over the last 15 years, costs associated with musculoskeletal conditions have risen from 3.43% of the GDP to 5.73%.  (Reference Table 10.10 PDF [62] CSV [63] and Table 10.14 PDF [64] CSV [65])
Total Direct and Indirect (Earnings Losses) Costs of Musculoskeletal Conditions as a Proportion of Gross Domestic Product (GDP) in 2011 $s, United States 1996-2011
Treatments that mitigate the long-term impacts of musculoskeletal conditions and return persons to full and active lives are needed.

Edition: 

  • 2014

Direct Costs

I.F.1

Lead Author(s): 

Stuart I. Weinstein, MD
Edward H. Yelin, PhD

Supporting Author(s): 

Sylvia I. Watkins-Castillo, PhD

The increasing prevalence of musculoskeletal conditions, along with a growing and aging population, has resulted in more than a 50% increase in total aggregate direct cost to treat persons with a musculoskeletal condition over the past decade, in constant 2011 dollars. For the years between 2009 and 2011, the annual average direct cost in 2011 dollars for musculoskeletal health care—both as a direct result of a musculoskeletal disease and for patients with a musculoskeletal disease in addition to other health issues—is estimated to be $796.3 billion, the equivalent of 5.2% of the national gross domestic product (GDP).

Total medical care costs are the costs for all of an individual’s conditions, including musculoskeletal conditions. Incremental medical care costs are that part of total medical care costs attributable solely to the musculoskeletal conditions. Incremental medical costs for musculoskeletal conditions for the years between 2009 and 2011 are estimated to be $212.7 billion, in 2011 dollars. (Reference Table 10.6 PDF [66] CSV [67], and Table 10.14 PDF [64] CSV [65])

Edition: 

  • 2014

Indirect Costs

I.F.2

Lead Author(s): 

Stuart I. Weinstein, MD
Edward H. Yelin, PhD

Supporting Author(s): 

Sylvia I. Watkins-Castillo, PhD

Indirect costs measure disease impact in terms of lost wages due to disability or death.  Indirect costs, like medical care costs, can be estimated and calculated in total for all the medical conditions an individual has, and as the increment attributable solely to musculoskeletal conditions.

Indirect cost for persons age 18 to 64 with a work history add another $77.5 billion, or 0.5% of the GDP in between 2009 and 2011, to the cost for all persons with a musculoskeletal disease, either treated as a primary condition or in addition to another condition. Annual indirect costs attributable to musculoskeletal disease alone (incremental cost) account for an estimated $130.7 billion. Indirect costs attributable to musculoskeletal disease are greater than total indirect costs because of a 4% gap in the probability of working between persons with and without a musculoskeletal condition and a lower mean income. (Reference Table 10.12 PDF [68] CSV [69])
Edition: 

  • 2014

Impacts of Aging

I.G.0

Lead Author(s): 

Stuart I. Weinstein, MD
Edward H. Yelin, PhD

Supporting Author(s): 

Sylvia I. Watkins-Castillo, PhD
The importance of musculoskeletal conditions in society necessarily increases with an aging population since the prevalence and impact increase with age. An aging population puts increased numbers of persons in the age range of greatest risk for onset and worsened severity.  However, it is not only among the elderly, or persons age 65 or older, that the impacts of aging are felt. Because the prevalence of musculoskeletal conditions is substantial among those 45 to 64 years of age, the proportion of all cases of musculoskeletal disease in this age range increased by one-third over a 15-year time frame, from about 29% (21.8 million persons) in between 1996 and 1998 to about 38% (39.3 million persons) between 2009 and 2011. During the same time periods, the proportion of cases among the elderly increased by 13%, from about 22% (16.5 million persons) in the earlier three-year period to about 25% (25.1 million persons) in the later one. (Reference Table 10.1 PDF [58] CSV [59] and Table 10.1.1 PDF [60] CSV [61]) Because conditions that exist among persons age 45 to 64 are likely to last for a long time, the increased proportion of cases in this age range may lead to protracted high medical care costs in the years to come.
Number of Persons with Musculoskeletal Diseases by Age, United States 1996-1998 and 2009-2011
The relative importance of this age range in costs of care is already clear.  Between 1996 and 1998 and 2009 and 2011, the proportion of all medical care costs experienced by persons with musculoskeletal conditions who are 45-64 increased by 40%, from about 30% of all such costs to 42%. The proportion of incremental musculoskeletal medical care costs among persons 45 to 64 years of age increased by an even more, 67%, rising from 28% in the 1996 to 1998 period to 47% between 2009 and 2011. (Reference Table 10.9 PDF [70] CSV [71])

Edition: 

  • 2014

Key Challenges To Future

I.H.0

Lead Author(s): 

Stuart I. Weinstein, MD
Edward H. Yelin, PhD

Supporting Author(s): 

Sylvia I. Watkins-Castillo, PhD

The aging of the US population puts an increased proportion of the population at the ages of highest risk of the onset of musculoskeletal conditions and, among those with these conditions, at the ages of highest severity levels. The problem of aging is made more severe by the fact that many major chronic diseases are more prevalent in late middle age and among the elderly. In fact, most of the latter group has two or more chronic diseases. The impact of comorbidity is reflected in the cost data presented in this volume. Not only are the incremental costs, that is, those attributable to the musculoskeletal conditions, high among those age 45 and older, but the total medical costs they experience are also higher in these age ranges. The problems of an aging population are exacerbated by the co-occurrence of multiple chronic diseases. (Reference Table 10.9 PDF [70] CSV [71]).


Edition: 

  • 2014

Unmet Needs

I.I.0

Lead Author(s): 

Stuart I. Weinstein, MD
Edward H. Yelin, PhD

The increased prevalence of musculoskeletal conditions associated with the aging population will necessarily place increased demands on the health care system.  However, the growth in the health manpower pool is not keeping pace with the growing prevalence of musculoskeletal conditions. In fact, two medical specialties focused on the care of persons with these diseases, rheumatology and geriatrics, are having a difficult time recruiting new physicians because they are not among the most highly remunerated specialties.  

It is also the case, as documented in Section I.A.O: Funding [72] above, that research funding for musculoskeletal conditions, relatively small to begin with, is not keeping up with the growing importance of this disease group. Prior research has led to dramatically improved treatments for inflammatory conditions, such as rheumatoid arthritis (principally because of the development of biological treatments) and to mechanical ones such as osteoarthritis (principally because of the improvement in total joint replacement rates). However, in order to deal with the increased numbers of patients associated with the aging population, research funding must be expanded in sheer dollars and in scope to encompass the cause, treatment, and organization of care.   

Edition: 

  • 2014

Summary and Conclusions

I.J.0

Lead Author(s): 

Stuart I. Weinstein, MD
Edward H. Yelin, PhD

Supporting Author(s): 

Sylvia I. Watkins-Castillo, PhD
More than one in two persons age 18 years and older in the US population reports a chronic musculoskeletal condition. This compares to a rate of 31 and 28 persons per every 100 in the population for circulatory (including treatment for high blood pressure) and respiratory conditions, respectively.  

Chronic low back pain, joint pain, and disability from arthritis comprise three of the top four most commonly reported medical conditions. The fourth common condition is chronic hypertension. All four conditions were reported by 60 million or more persons in 2012. This compares to less than 30 million with other common conditions such as coronary or respiratory conditions. The number of persons suffering from musculoskeletal conditions is expected to continue to increase as once active individuals move into their older years.

The cost to treat the pain and disability resulting from musculoskeletal diseases is rising rapidly. The annual average direct and indirect (because of lost work) costs attributable to persons with a musculoskeletal disease were $213 billion between 2009 and 2011. Over the last 15 years, costs associated with musculoskeletal conditions have risen from 3.43% of the GDP to 5.73%.  

In spite of this, research funding for musculoskeletal-related conditions remains substantially below that of other major health conditions, such as cancer and respiratory and circulatory diseases. If health care costs in the future are to be contained, musculoskeletal diseases must come to the forefront of research.

Edition: 

  • 2014

ICD-9-CM Codes for Musculoskeletal Diseases

I.K.0

Lead Author(s): 

Sylvia I. Watkins-Castillo, PhD
135 : Sarcoidosis
170 : Malignant neoplasm of bone and articular cartilage
171 : Malignant neoplasm of connective and other soft tissue
198 : Secondary malignant neoplasm of bone and bone marrow
203 : Multiple myeloma and immunoproliferative neoplasms
213 : Benign neoplasm of bone and articular cartilage
215 : Other benign neoplasm of connective and other soft tissue
238 : Neoplasm of uncertain behavior of other and unspecified sites and tissues; Connective and other soft tissue; Bone soft tissue and skin
239.2 : Neoplasms of unspecified nature; Bone soft tissue and skin
274 : Gout; Gouty arthroplathy
354 : Mononeuritis of upper limb and mononeuritis multiplex
710 : Diffuse diseases of connective tissue
711 : Arthropathy associated with infections
712 : Crystal arthropathies
713 : Arthropathy associated with other disorders classified elsewhere
714 : Rheumatoid arthritis and other inflammatory polyarthropathies
715 : Osteoarthrosis and allied disorders
716 : Other and unspecified arthroplasties
717 : Internal derangement of knee
718 : Other derangement  of joint
719 : Other and unspecified disorders of joint
720 : Ankylosing spondylitis and other inflammatory spondylopathies
721 : Spondylosis and allied disorders
722 : Intervertebral disc disorders
723 : Other disorder of cervical region
724 : Other and unspecified disorders of back
725 : Polymyalgia rheumatica
726 : Peripheral enthesopathies and allied syndromes
727 : Synovitis and tenosynovitis
728 : Disorders of muscle, ligament, and fascia
729 : Other disorders of soft tissue
730 : Acute osteomyelitis
731 : Osteitis deformans and osteopathies associated with other disorders classified elsewhere
732 : Osteochondropathies
733 : Other disorders of bone and cartilage (Osteoporosis; pathologic fracture, cyst, necrosis of bone, malunion and nonunion of fracture)
734 : Flat foot
735 : Acquired deformities of toe
736 : Acquired deformities of forearm
737 : Curvature of spine
738 : Other acquired deformity (of musculoskeletal system), spondylolisthesis
739 : Nonallopathic lesions, not elsewhere classified
741 : Spina bifida
754 : Certain congenital musculoskeletal deformities
755 : Other congenital anomalies of limbs (Polydactyly)
756 : Other congenital musculoskeletal anomalies
805 : Fracture of vertebral column without mention of spinal cord injury
806 : Fracture of vertebral column with mention of spinal cord injury
807 : Fracture of vertebral column with mention of spinal cord injury
808 : Fracture of pelvis (Acetabulum, closed)
809 : Ill-defined fractures of bones and trunk
810 : Fracture of clavicle (closed)
811 : Fracture of scapula (closed)
812 : Fracture of humerus (Upper end, closed)
813 : Fracture of radius and ulna (Upper end, closed)
814 : Fracture of carpal bone(s) (Closed)
815 : Fracture of metacarpal bone(s) (Closed)
816 : Fracture of one or more phalanges of hand (Closed)
817 : Multiple fractures of hand bones
818 : Ill-defined fractures of upper limb
819 : Multiple fractures involving both upper limbs, and upper limb with rib(s) and sternum
820 : Fracture of neck of femur (transcervical fracture, closed)
821 : Fracture of other and unspecified parts of femur (Shaft or unspecified part, closed)
822 : Fracture of patella
823 : Fracture of tibia and fibula, upper end (closed)
824 : Fracture of ankle
825 : Fracture of one or more tarsal and metatarsal bones
826 : Fracture of one or more phalanges of foot
827 : Other, multiple, and ill-defined fractures of lower limb
829 : Fractures of unspecified bones
831 : Dislocation of shoulder
832 : Dislocation of elbow
833 : Dislocation of wrist
834 : Dislocation of finger
835 : Dislocation of hip
836 : Dislocation of knee
837 : Dislocation of ankle
838 : Dislocation of foot
839 : Other, multiple, and ill-defined dislocations
840 : Sprains and strains of shoulder and upper arm
841 : Sprains and strains of elbow and forearm
842 : Sprains and strains of wrist and hand
843 : Sprains and strains of hip and thigh
844 : Sprains and strains of knee and leg
845 : Sprains and strains of ankle and foot
846 : Sprains and strains of sacroiliac region
847 : Sprains and strains of other and unspecified parts of back
848 : Other and ill-defined sprains and strains
875 : Open wound of chest (wall)
876 : Open wound of back
877 : Open wound of buttock
879 : Open wound of other and unspecified sites (except limbs)
880 : Open wound of shoulder and upper arm
881 : Open wound of elbow, forearm, and wrist
882 : Open wound of hand except finger(s) alone
883 : Open wound of finger(s)
884 : Multiple and unspecified open wound of upper limb
885 : Traumatic amputation of thumb
886 : Traumatic amputation of other finger(s)
887 : Traumatic amputation of arm and hand (complete) (partial)
890 : Open wound of hip and thigh
891 : Open wound of knee, leg [except thigh], and ankle
892 : Open wound of foot except toe(s) alone
893 : Open wound of toe(s)
894 : Multiple and unspecified open wound of lower limb
895 : Traumatic amputation of toe(s)
896 : Traumatic amputation of foot (complete) (partial)
897 : Traumatic amputation of leg(s) (complete) (partial)
922 : Contusion of trunk
923 : Contusion of upper limb
924 : Contusion of lower limb and of other and unspecified sites
926 : Crushing injury of trunk
927 : Crushing injury of upper limb
928 : Crushing injury of lower limb
929 : Crushing injury of multiple and unspecified sites
954 : Injury to other nerve(s) of trunk, excluding shoulder and pelvic girdles
955 : Injury to peripheral nerve(s) of shoulder girdle and upper limb
956 : Injury to peripheral nerve(s) of pelvic girdle and lower limb
959 : Injury, other and unspecified (to musculoskeletal system)
996 : Complications peculiar to certain specified procedures
V43.6 : Organ or tissue replaced by other means (joint)
V54 : Other orthopaedic aftercare
V67 : Follow-up examination, following surgery

Edition: 

  • 2014
The Burden of Musculoskeletal Diseases in the United States - Copyright © 2014.

Source URL: https://bmus.latticegroup.com/2014-report/i0/big-picture

Links:
[1] http://www.thelancet.com/themed/global-burden-of-disease
[2] https://bmus.latticegroup.com/docs/T1.5.1.pdf
[3] https://bmus.latticegroup.com/docs/T1.5.1.csv
[4] https://bmus.latticegroup.com/docs/T1.1.1.pdf
[5] https://bmus.latticegroup.com/docs/T1.1.1.csv
[6] https://bmus.latticegroup.com/docs/T1.1.2.pdf
[7] https://bmus.latticegroup.com/docs/T1.1.2.csv
[8] https://bmus.latticegroup.com/docs/T1.1.3.pdf
[9] https://bmus.latticegroup.com/docs/T1.1.3.csv
[10] https://bmus.latticegroup.com/docs/T1.1.4.pdf
[11] https://bmus.latticegroup.com/docs/T1.1.4.csv
[12] https://bmus.latticegroup.com/docs/T1.2.1.pdf
[13] https://bmus.latticegroup.com/docs/T1.2.1.csv
[14] https://bmus.latticegroup.com/docs/T1.2.2.pdf
[15] https://bmus.latticegroup.com/docs/T1.2.2.csv
[16] https://bmus.latticegroup.com/docs/T1.3.2.pdf
[17] https://bmus.latticegroup.com/docs/T1.3.2.csv
[18] https://bmus.latticegroup.com/docs/T1.2.3.pdf
[19] https://bmus.latticegroup.com/docs/T1.2.3.csv
[20] https://bmus.latticegroup.com/docs/T1.3.1.pdf
[21] https://bmus.latticegroup.com/docs/T1.3.1.csv
[22] https://bmus.latticegroup.com/docs/T1.3.3.pdf
[23] https://bmus.latticegroup.com/docs/T1.3.3.csv
[24] https://bmus.latticegroup.com/docs/T1.4.2.pdf
[25] https://bmus.latticegroup.com/docs/T1.4.2.csv
[26] https://bmus.latticegroup.com/docs/T1.4.1.pdf
[27] https://bmus.latticegroup.com/docs/T1.4.1.csv
[28] https://bmus.latticegroup.com/docs/T1.4.3.pdf
[29] https://bmus.latticegroup.com/docs/T1.4.3.csv
[30] https://bmus.latticegroup.com/docs/T1.5.2.pdf
[31] https://bmus.latticegroup.com/docs/T1.5.2.csv
[32] https://bmus.latticegroup.com/docs/T1.6.2.pdf
[33] https://bmus.latticegroup.com/docs/T1.6.2.csv
[34] https://bmus.latticegroup.com/docs/T1.6.1.pdf
[35] https://bmus.latticegroup.com/docs/T1.6.1.csv
[36] https://bmus.latticegroup.com/docs/T1.5.3.pdf
[37] https://bmus.latticegroup.com/docs/T1.5.3.csv
[38] https://bmus.latticegroup.com/docs/T1.6.3.pdf
[39] https://bmus.latticegroup.com/docs/T1.6.3.csv
[40] https://bmus.latticegroup.com/docs/T1.7.pdf
[41] https://bmus.latticegroup.com/docs/T1.7.csv
[42] https://bmus.latticegroup.com/docs/T1.8.3.pdf
[43] https://bmus.latticegroup.com/docs/T1.8.3.csv
[44] https://bmus.latticegroup.com/docs/T1.8.1.pdf
[45] https://bmus.latticegroup.com/docs/T1.8.1.csv
[46] https://bmus.latticegroup.com/docs/T1.8.4.pdf
[47] https://bmus.latticegroup.com/docs/T1.8.4.csv
[48] https://bmus.latticegroup.com/docs/T1.8.5.pdf
[49] https://bmus.latticegroup.com/docs/T1.8.5.csv
[50] https://bmus.latticegroup.com/docs/T1.8.2.pdf
[51] https://bmus.latticegroup.com/docs/T1.8.2.csv
[52] https://bmus.latticegroup.com/docs/T1.10.1.pdf
[53] https://bmus.latticegroup.com/docs/T1.10.1.csv
[54] https://bmus.latticegroup.com/docs/T1.10.2.pdf
[55] https://bmus.latticegroup.com/docs/T1.10.2.csv
[56] https://bmus.latticegroup.com/docs/T1.10.3.pdf
[57] https://bmus.latticegroup.com/docs/T1.10.3.csv
[58] https://bmus.latticegroup.com/docs/T10001.1.pdf
[59] https://bmus.latticegroup.com/docs/T10001.1.csv
[60] https://bmus.latticegroup.com/docs/T10002.1.1.pdf
[61] https://bmus.latticegroup.com/docs/T10002.1.1.csv
[62] https://bmus.latticegroup.com/docs/T10011.10.pdf
[63] https://bmus.latticegroup.com/docs/T10011.10.csv
[64] https://bmus.latticegroup.com/docs/T10015.14.pdf
[65] https://bmus.latticegroup.com/docs/T10015.14.csv
[66] https://bmus.latticegroup.com/docs/T10007.6.pdf
[67] https://bmus.latticegroup.com/docs/T10007.6.csv
[68] https://bmus.latticegroup.com/docs/T10013.12.pdf
[69] https://bmus.latticegroup.com/docs/T10013.12.csv
[70] https://bmus.latticegroup.com/docs/T10010.9.pdf
[71] https://bmus.latticegroup.com/docs/T10010.9.csv
[72] https://bmus.latticegroup.com/2013-report/i1/introduction