For purposes of further analysis, we decided to divide the diagnostic codes defining the burden of spine problems into three groups: back disorders, disc disorders, and back injuries. This approach allows comparison to earlier editions of the text. We are aware there may be substantial overlap, and that some of the back disorders may be related to degenerative disc changes and some of the disc disorders may have another origin. The role of disc degeneration in the causation of back pain remains uncertain. Intervertebral disc degeneration and associated facet joint osteoarthritis seem to be a natural process of aging, but can alter the biomechanics and function of the spine. Studies have identified a strong genetic predisposition, but there are modifying influences including age, obesity, activity level, and smoking.
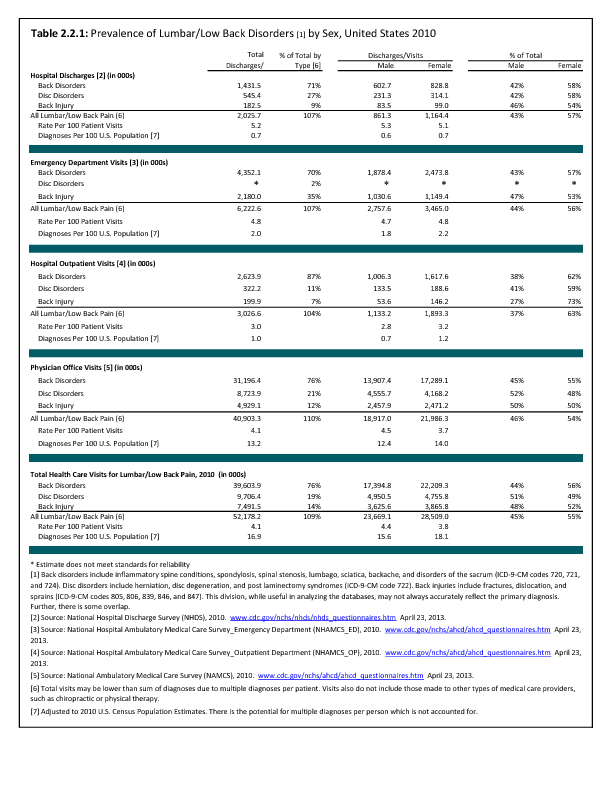
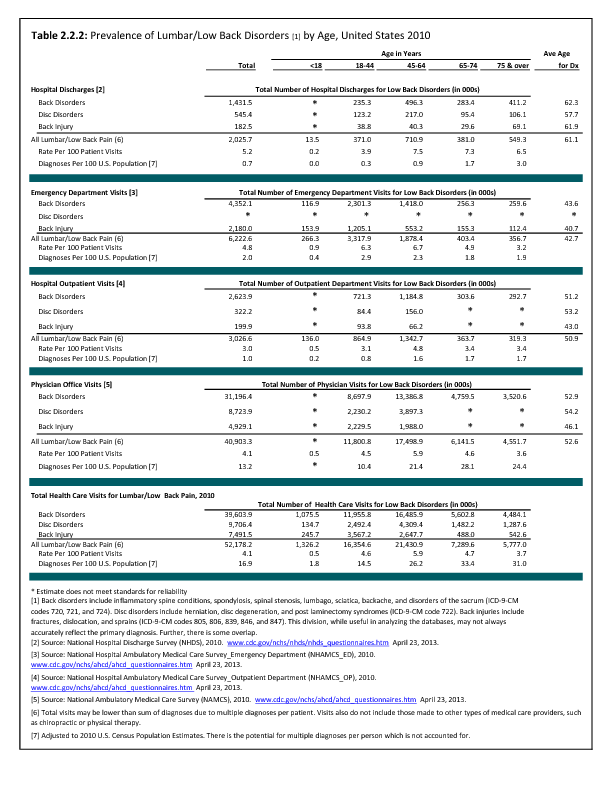
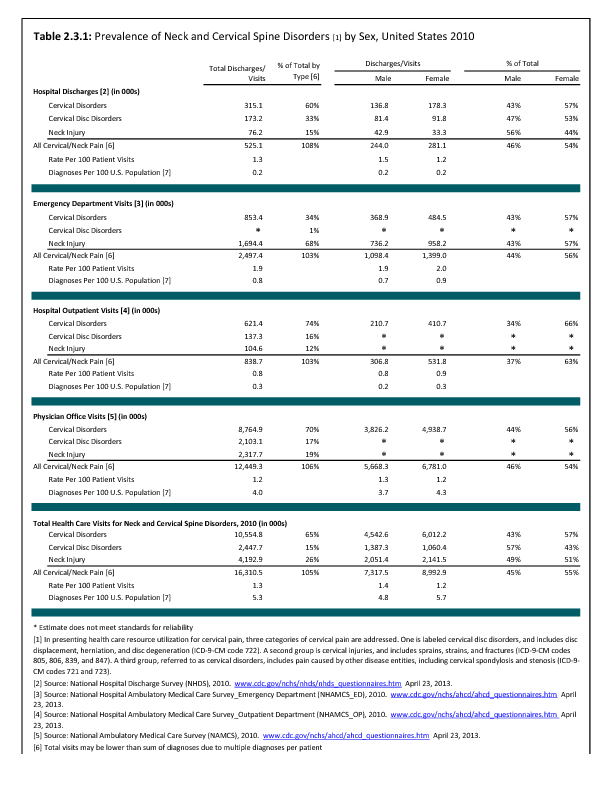
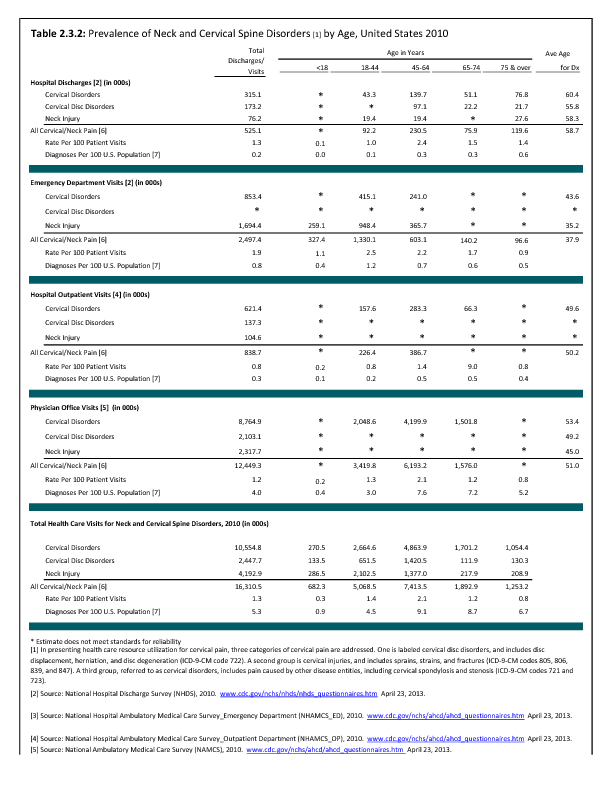
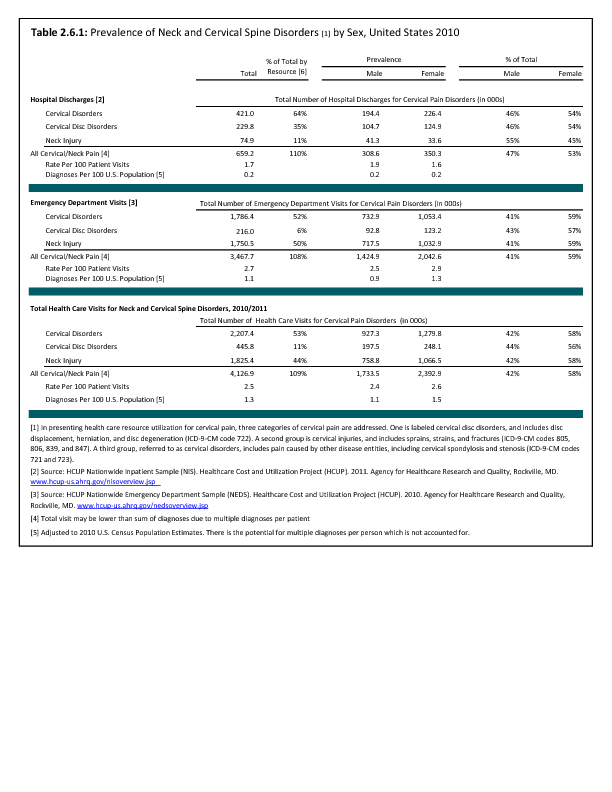
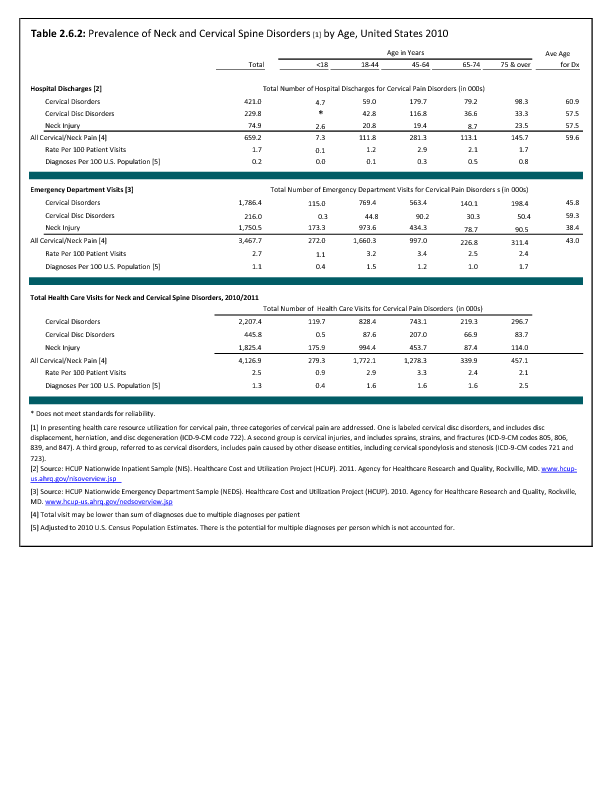
In the tables and text, we define back disorders by diagnostic ICD-9-CM Codes 720, 721, and 724. These codes include inflammatory spine conditions, spondylosis, spinal stenosis, lumbago, sciatica, backache, and disorders of the sacrum. Disc disorders include herniations, disc degeneration, and post-laminectomy syndromes (ICD-9-CM Code 722). Back injuries include fractures, dislocations, and sprains (ICD-9-CM Codes 805, 806, 839, 846, and 847). The same classifications are used for both lumbar/low back pain and cervical/neck pain.
Unfortunately, the databases do not permit diagnostic verification. Sometimes diagnoses are provided primarily for reimbursement purposes, with little emphasis on accuracy. Further, there is considerable overlap. For example, a patient with back pain of unknown origin could be given the diagnosis of lumbago, placing him or her in the back disorder category. He or she may also have disc degeneration with a diagnosis of degenerative disc disease and, therefore be placed in the disc disorder category. Or, if his or her problem developed after a lift or twist, it could be diagnosed as a back strain, falling into the back injury category.
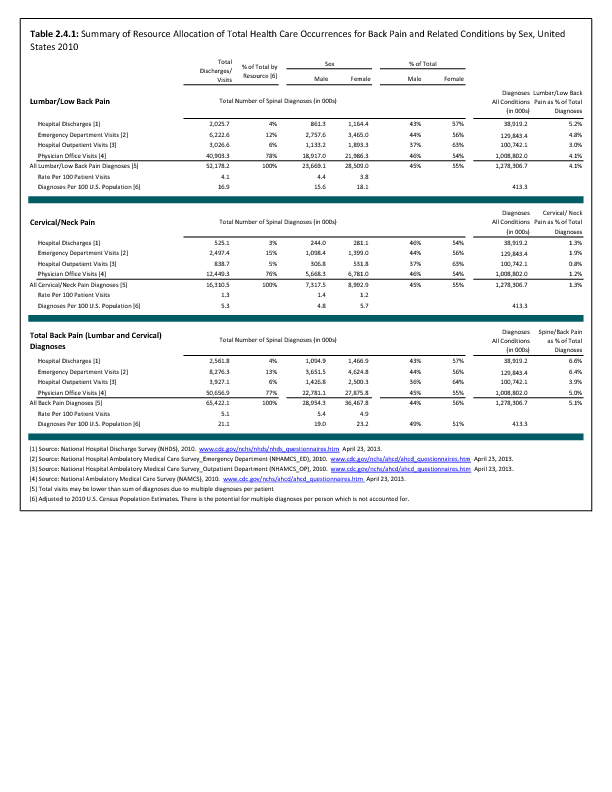
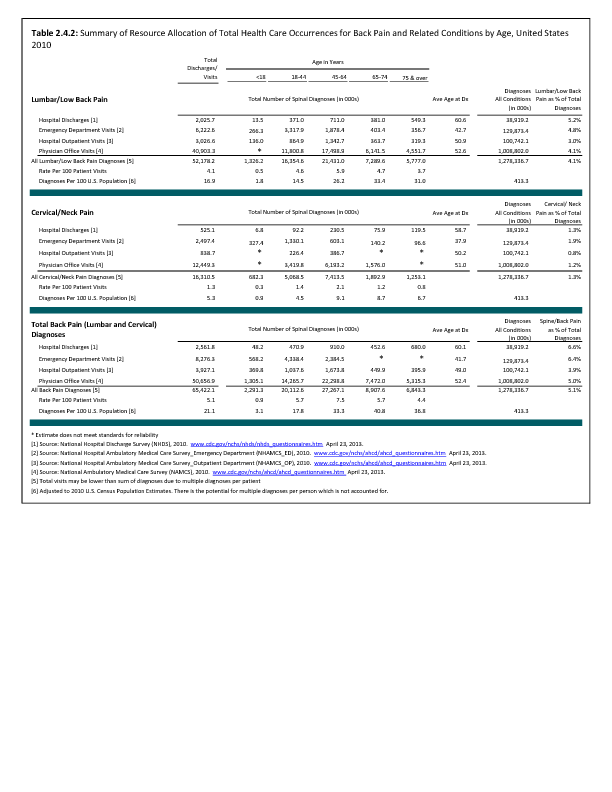
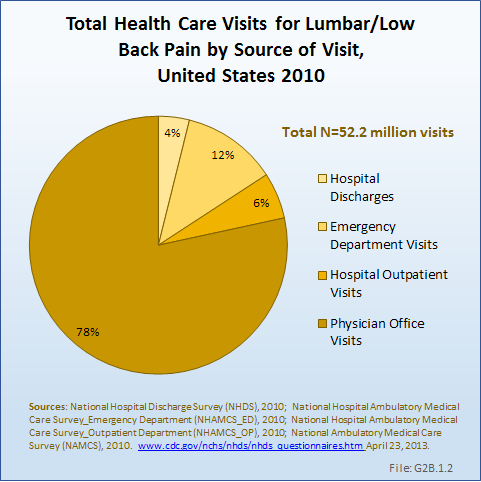
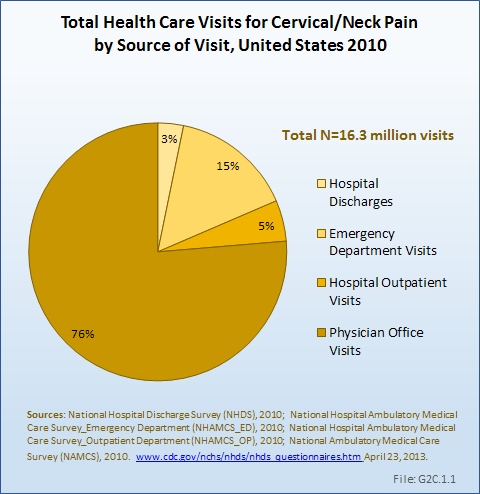
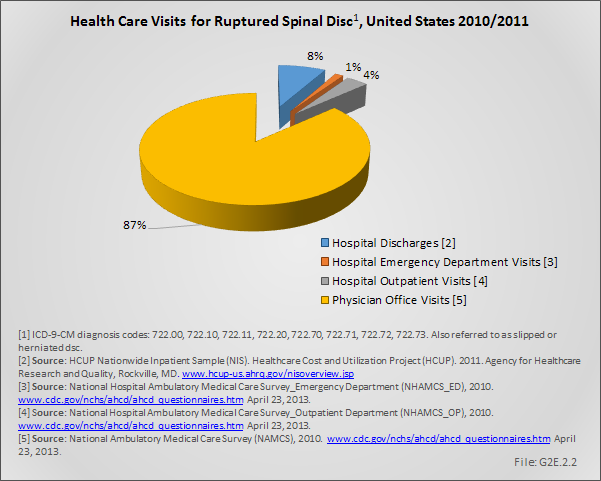
In the tables and graphs, total health care visits include hospital discharges obtained from the National Hospital Discharge Survey (NHDS) in 2010, emergency department visits obtained from the National Hospital Ambulatory Medical Care Survey Emergency Departments (NHAMCS-ED) in 2010, hospital outpatient visits obtained from the National Hospital Ambulatory Medical Care Survey Outpatients (NHAMCS-OP) 2010, and physician office visits obtained from the National Ambulatory Medical Care Survey (NAMCS) in 2010, all part of the National Health Care Surveys (NHCS) compiled annually by the Centers for Disease Control and Prevention (CDC) .
For comparative purposes, data are also analyzed for the Health Care Cost and Utilization Project (HCUP) Nationwide Inpatient Sample (NIS) and the Nationwide Emergency Department Sample (NEDS), created annually by the Agency for Health Care Research and Quality (AHRQ). These databases are much larger than the NHCS databases, but do not include outpatient and physician office visits. When the weighted analysis is compared, the two sets of databases produce very similar results. The advantage of the HCUP databases is the reliability of data for conditions that are rare, and often have a very small number of records.
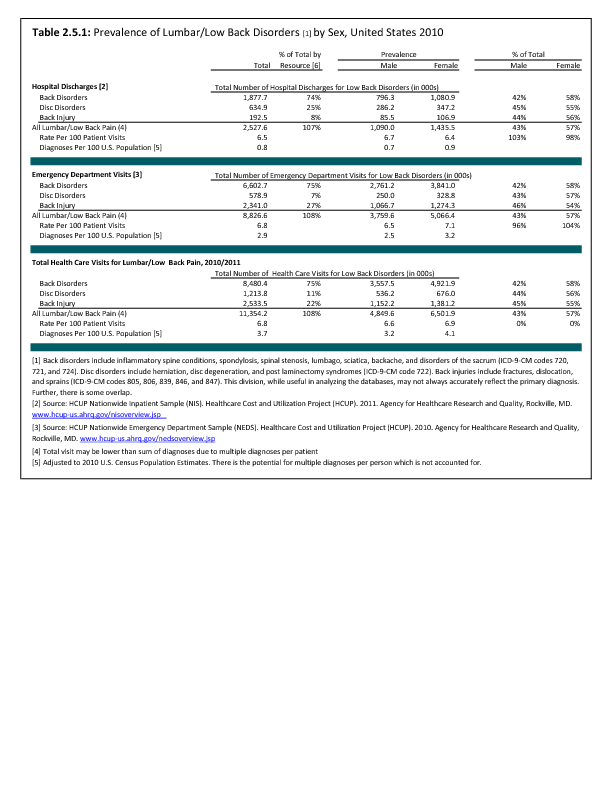
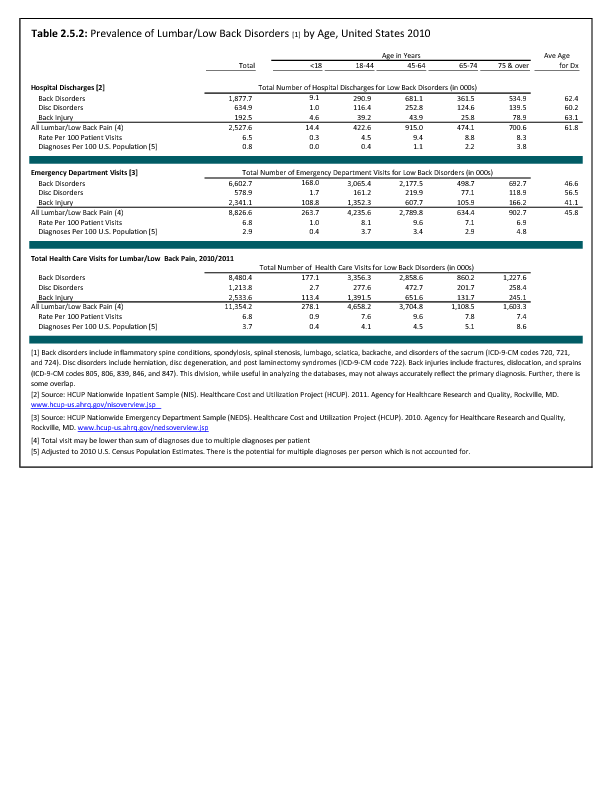
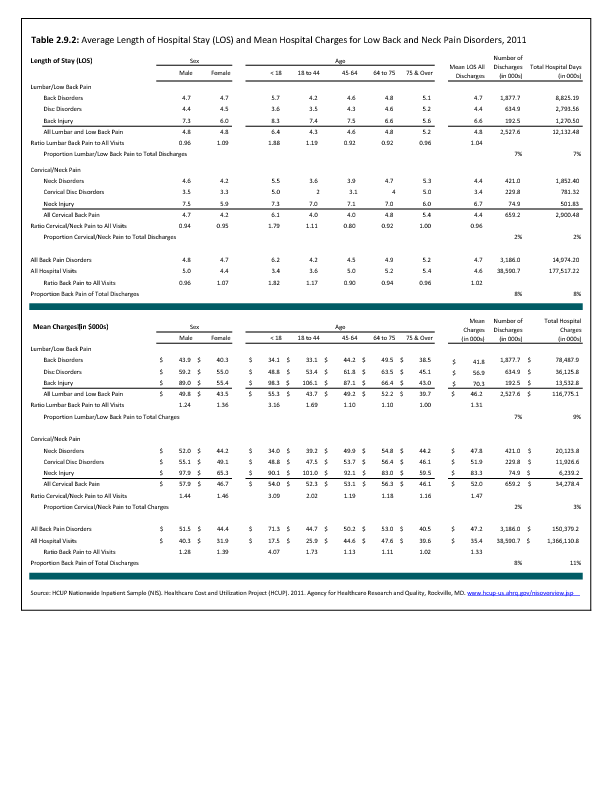
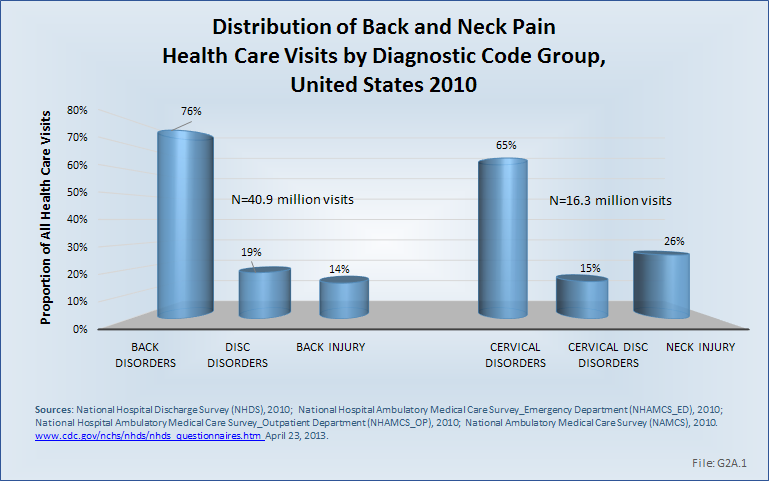
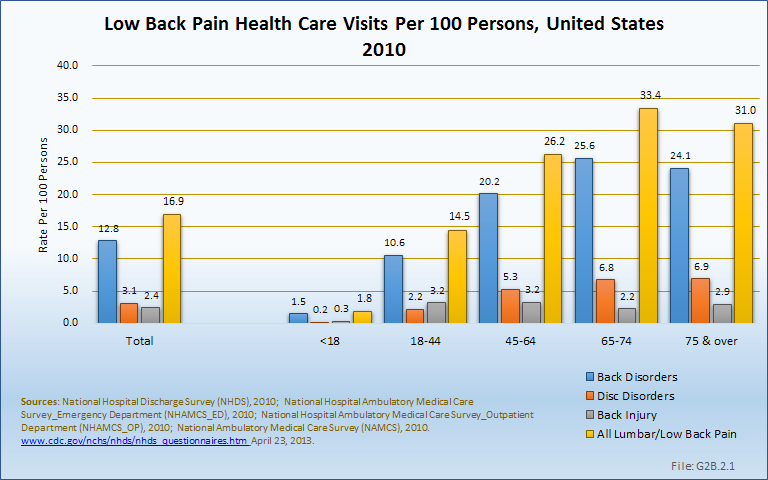
Using the diagnostic code grouping discussed above, back disorders accounted for 76% of low back pain health care resource utilization in 2010. Back disorders accounted for 7 in 10 or more visits to all health care sites. (Reference Table 2.2.1 PDF CSV).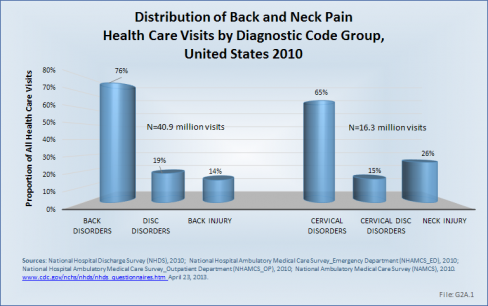
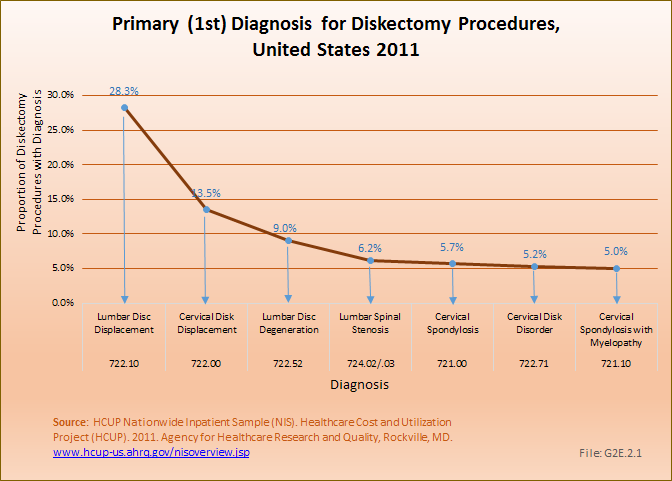
Disc disorders accounted for 19% of low back pain resource visits, and approximately 27% of hospitalizations. Emergency department visits for disc disorders were rare, comprising only 2% of all visits to the ED.
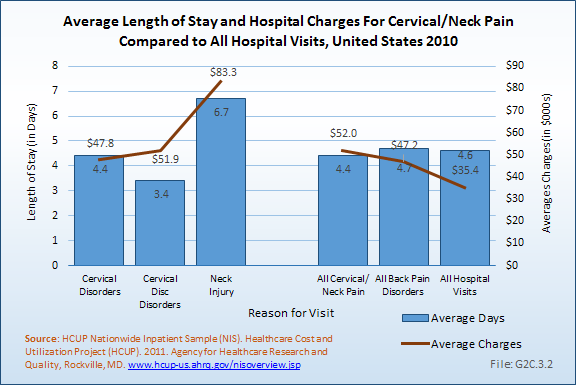
Back injuries, which include fractures, sprains, and strains, are often reported as caused by overexertion or overuse. They accounted for the remaining 14% of 2010 low back pain resource visits. Back injuries were most commonly seen in the emergency room (35%), but constituted only 9% of hospitalizations, indicating that most were manageable in an outpatient setting, and were most likely soft tissue injuries.
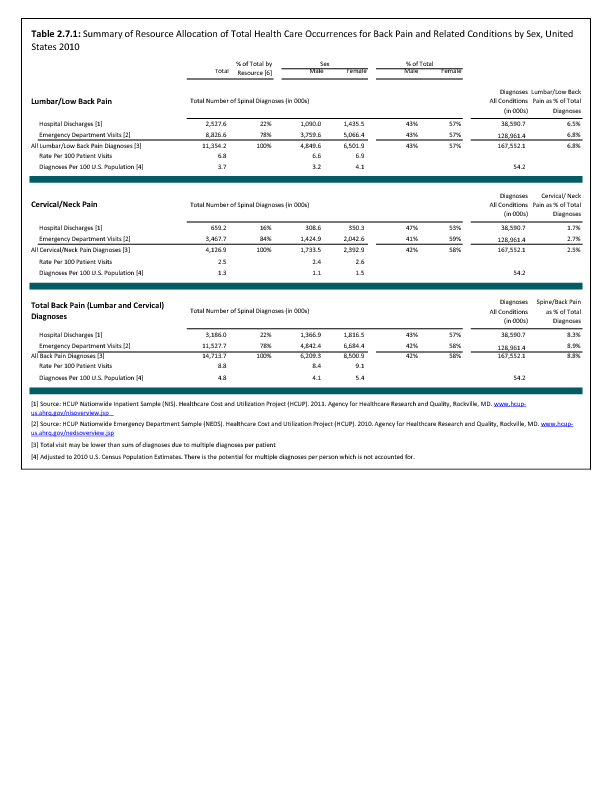
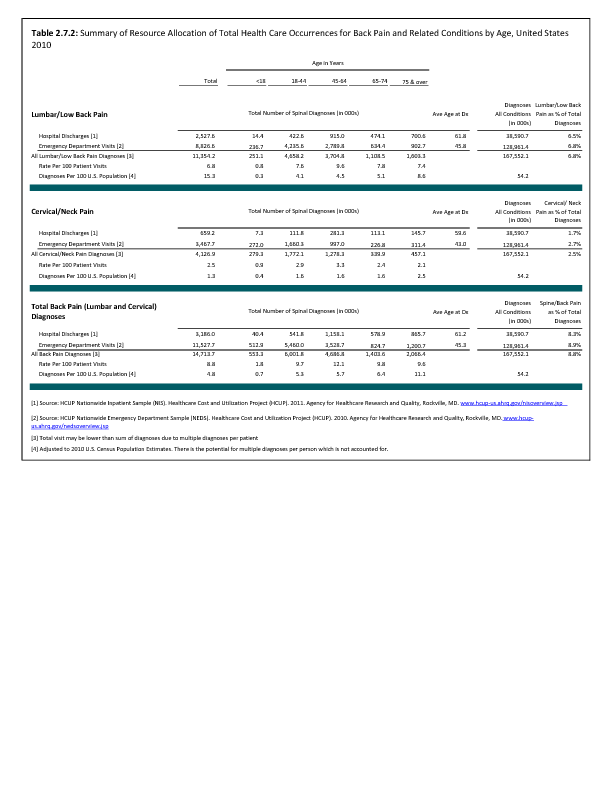
Comparative data for the HCUP databases can be found in the data tables. (Reference Table 2.7.1 PDF CSV)
Edition:
- 2014
 Download as CSV