While nonsurgical treatment for back pain is the treatment of choice, spine surgery becomes an option when neck and low back pain is disabling and not responding to nonoperative treatment alternatives. Further, in some cases such as certain fractures, infections, tumors, and severe neurologic deficits, surgery is the first treatment choice. As mentioned in earlier sections, the information we have with respect to surgical procedures is limited to that obtained from hospitals using the Nationwide Inpatient Sample and the National Hospital Discharge Survey. Because of the larger sample size, most data in this analysis uses the NIS. Unfortunately, the information is procedure-related and only indirectly patient-related. On average, two of the eight most common procedures were performed on most patients because the sum of the percentage of patients receiving a procedure is nearly twice that of procedures. (Reference Table 2.12 PDF CSV)
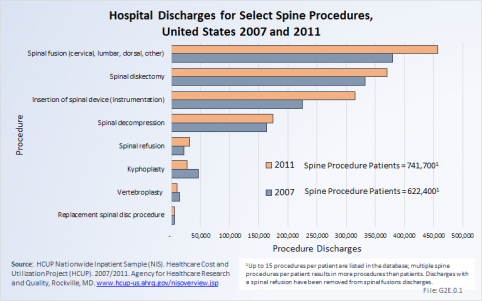
In 2007, just under 1.187 million procedures for the eight most common spine procedures were performed on 662,400 patients. In 2011, the number of patients had increased to 741,700, but total procedures for the same eight common procedures jumped even more to 1.391 million. This is an increase in the number of procedures by 17%, but only a 12% increase in the number of patients.
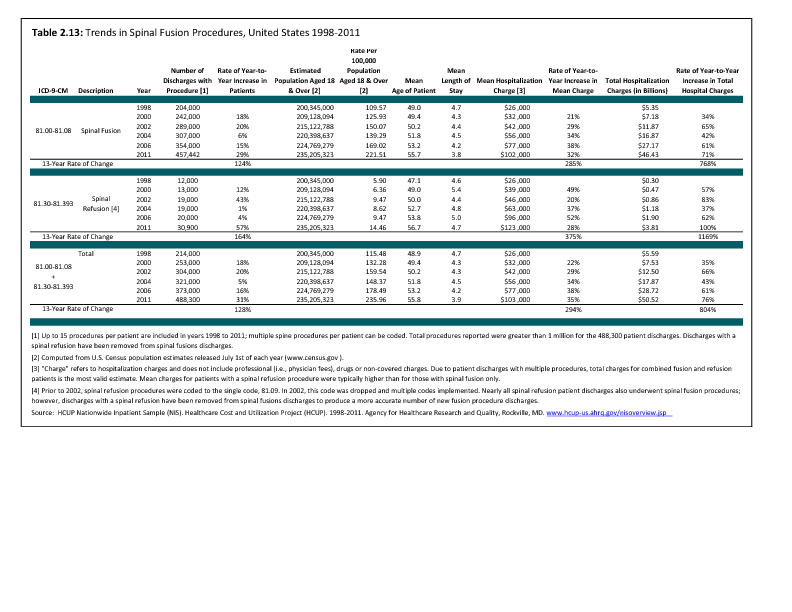
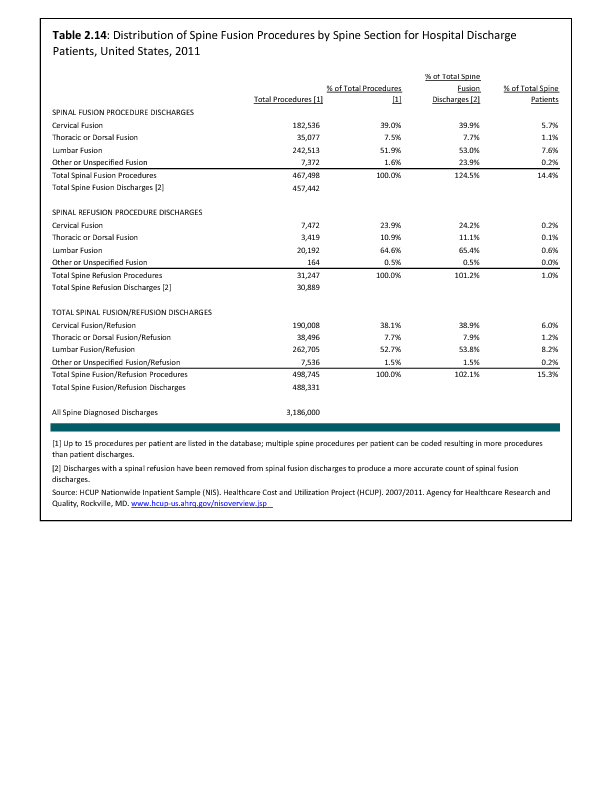
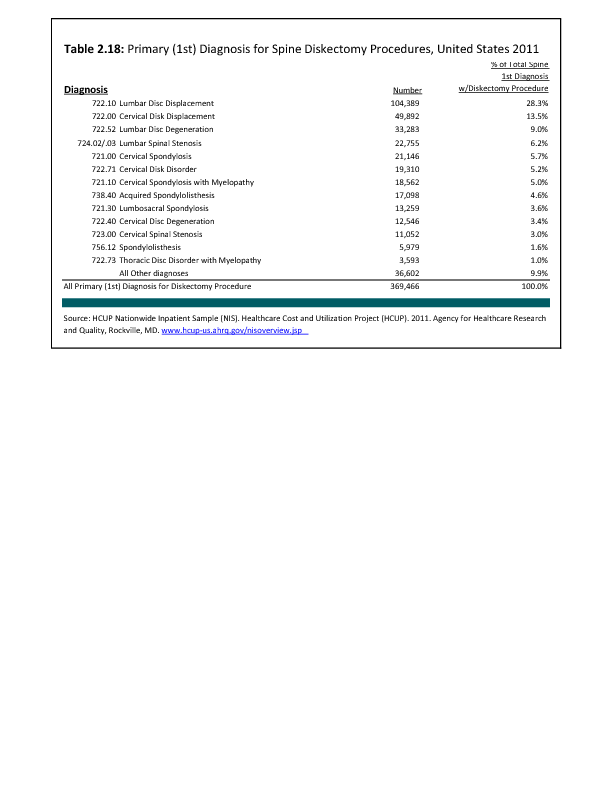
In 2007, there were 332,500 diskectomies performed compared to 369,900 in 2011. Because of the increase in spinal fusion and other procedures, as subsequently discussed, hospital diskectomies constitute 28% and 25% of all spine procedures in the two years, respectively. Although an absolute larger number of procedures in 2011, diskectomies represent a decreasing share of all procedures in 2011. To what degree this reflects a transfer of procedures to surgicenters is unknown because there is currently no national database. Spinal fusion procedures were listed as the main hospital procedure, being performed on 380,000 patients in 2007 and 457,500 patients in 2011. The majority of insertions of spinal devices, the third most common procedure group, likely occurred in patients with spinal fusions. If we assume that all patients in whom spinal devices were inserted also were fused, only 142,000 patients who were fused did not get a spinal device (18%). Spinal decompression, which may or may not be performed in conjunction with a spinal fusion or in conjunction with a diskectomy, accounted for 14% of all procedures in 2007 and 12.5% in 2011, an decrease of only 7% in the number of procedures. The number of spinal decompression procedures performed, along with other procedures for which inpatient hospitalization is not always required, may not be reflected accurately because an increasing number of these patients are operated on in outpatient surgicenters and facilities,.
Edition:
- 2014

 Download as CSV