While nonsurgical treatment for back pain is the treatment of choice, spine surgery becomes an option when neck and low back pain is disabling and not responding to nonoperative treatment alternatives. Further, in some cases such as certain fractures, infections, tumors, and severe neurologic deficits, surgery is the first treatment choice. As mentioned in earlier sections, the information we have with respect to surgical procedures is limited to that obtained from hospitals using the Nationwide Inpatient Sample. Unfortunately, the information is procedure-related and only indirectly patient-related.
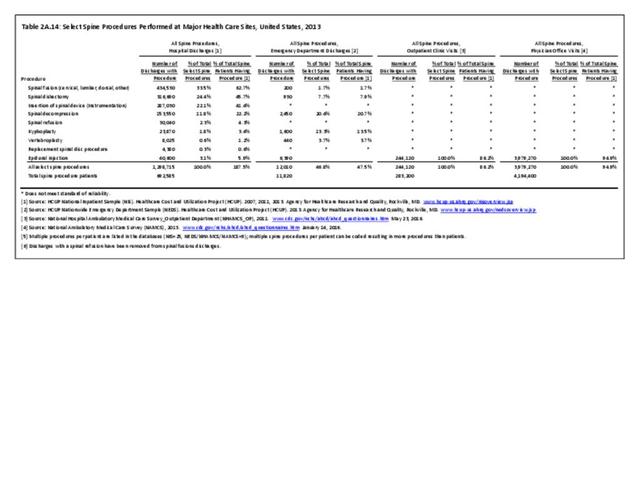
In 2007, just under 1.2 million procedures for the eight most common spine procedures were performed on 662,400 patients in hospitals. In 2011, the number of patients had increased to 741,700 with a corresponding increase in the number of hospital procedures to 1.4 million. In 2013, the number of patients receiving the most common procedures, which added epidural injections to the earlier list of eight procedures, decreased to 692,585, while total procedures decreased slightly to 1.3 million. (Reference Table 2A.15 PDF CSV)

The number of spinal decompression procedures performed, along with other procedures for which inpatient hospitalization is not always required, may not be reflected accurately because an increasing number of these patients are operated on in outpatient surgicenters and facilities. This can be, in part, illustrated here. In 2011, there were 369,900 diskectomies performed compared with 316,700 in 2013. Spinal fusion procedures were listed as the main hospital procedure, being performed 457,500 times in 2011 and 434,500 times in 2013. The majority of insertions of spinal devices, the third most common procedure group, likely occurred in patients with spinal fusions. Spinal decompression, which may or may not be performed in conjunction with a spinal fusion or in conjunction with a diskectomy, accounted for 12.5% of all procedures in 2011 and 11.8% in 2013. Changes in procedure codes for decompression between 2011 and 2013 may have partly been the cause of fewer reported decompression procedures. (Reference Table 2A.15 PDF CSV)
Compared to the inpatient hospital setting, other healthcare sites offer a limited variety of spinal procedures. In the emergency department (ED) setting, epidural injections accounted for over 6,000 procedures, more than half of the 12,000 total procedures reported in the ED. The only procedures recorded in physician office visits were epidural injections, but they accounted for the majority of epidural injections in 2013 and reflect the variety of healthcare sites in which epidural injections can be administered. (Reference Table 2A.14 PDF CSV)

Spinal Fusion
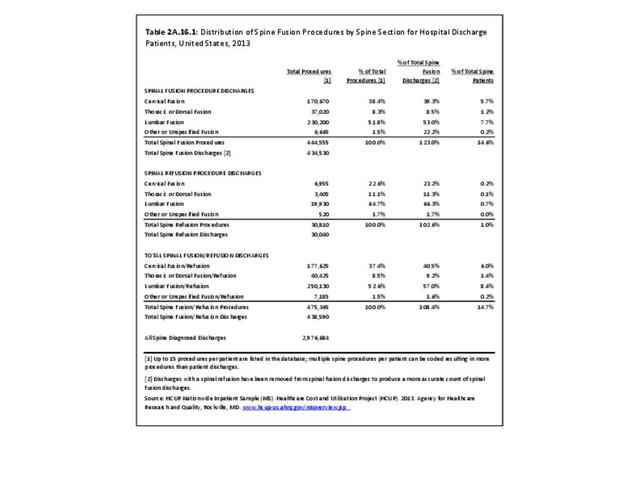
The rate of spinal fusion procedures has risen rapidly over the past several decades. Spinal fusion is performed either alone or in conjunction with decompression and/or reduction of a spinal deformity. Fusions are performed on all regions of the spine. Lumbar fusion rates and cervical fusion rates are both increasing rapidly, while thoracic fusions continue to be less frequent. Lumbar fusions remain the most common, constituting 52% of all spine fusion procedures in 2013. Spinal refusion occurs most often to the lumbar region, accounting for 65% of both refusion procedures and refusion patients. (Reference Table 2A.16.1 PDF CSV)

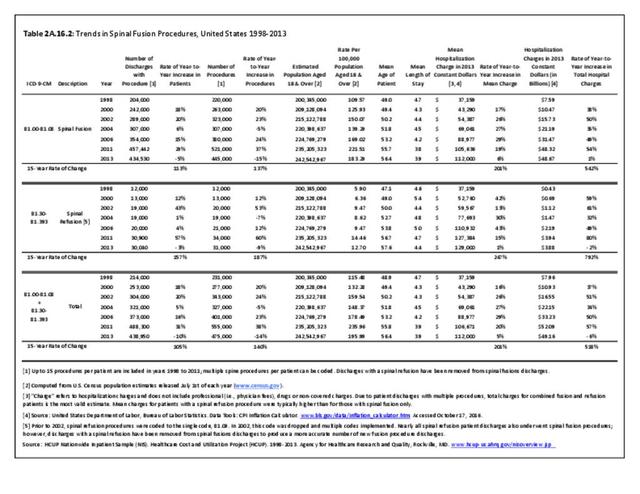
Between the years 1998 and 2013, the number of spinal fusion procedures more than doubled, from 220,000 in 1998 to 445,000 in 2013. This is a 137% increase in procedures over a 16-year period. The period from 2004 to 2011 reflected an increase of 61%, but from 2011-2013 there was a 15% decrease in recorded spinal fusions performed, most likely due to a larger proportion of these procedures being performed at an outpatient site. The rate of adult patients undergoing spinal fusion has increased from 110 per 100,000 persons in 1998 to 183 per 100,000 in 2013. During the same time period, refusion rates increased by 187% and from 6 to 13 persons per 100,000. Between 1998 and 2013, the average age of patients undergoing a fusion procedure has increased from 49.0 years to 56.4 years. (Reference Table 2A.16.2 PDF CSV)

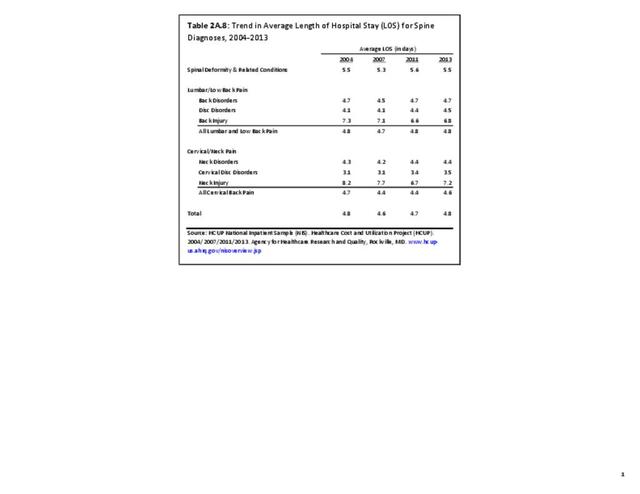
Length of Stay/Hospital Charges
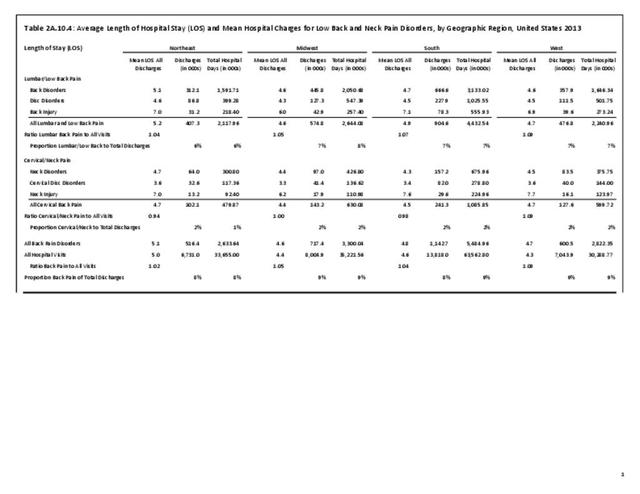
Although the mean length of stay for spinal fusion has decreased from 4.7 days in 1998 to 3.9 days in 2013, the mean hospital charge for these patients has increased significantly. The mean hospital charge in 1998 was $26,000 ($37,200 in 2013 dollars); while in 2013 the mean charge was $112,000. Increased use of instrumentation and biologicals (mainly bone substitutions) contribute to the higher cost. The total increase in hospital charges rose from $5.4 billion ($7.6 billion in 2013 dollars) to $48.7 billion over this 16-year period, an increase of more than 542%. Spinal refusion procedures are even more expensive, with an average charge of $129,000 in 2013, while the length of stay remained relatively constant. This, of course, does not mean that cost or reimbursement was even close to these dollar numbers. These charges are based on what hospitals set as their charges, and do not reflect the contractual agreements they have with the payer community. (Reference Table 2A.16.2 PDF CSV)

Likely explanations for the increase in spinal fusions include advances in technology, such as the development of new diagnostic techniques and new implant devices that allow for better surgical management. In addition, there has been increased training in spinal surgery and the population has aged, presenting an increase in age-related medical problems. Further, higher expectations regarding quality of life makes patients less accepting of an ongoing back problem and more likely to look for a surgical solution.
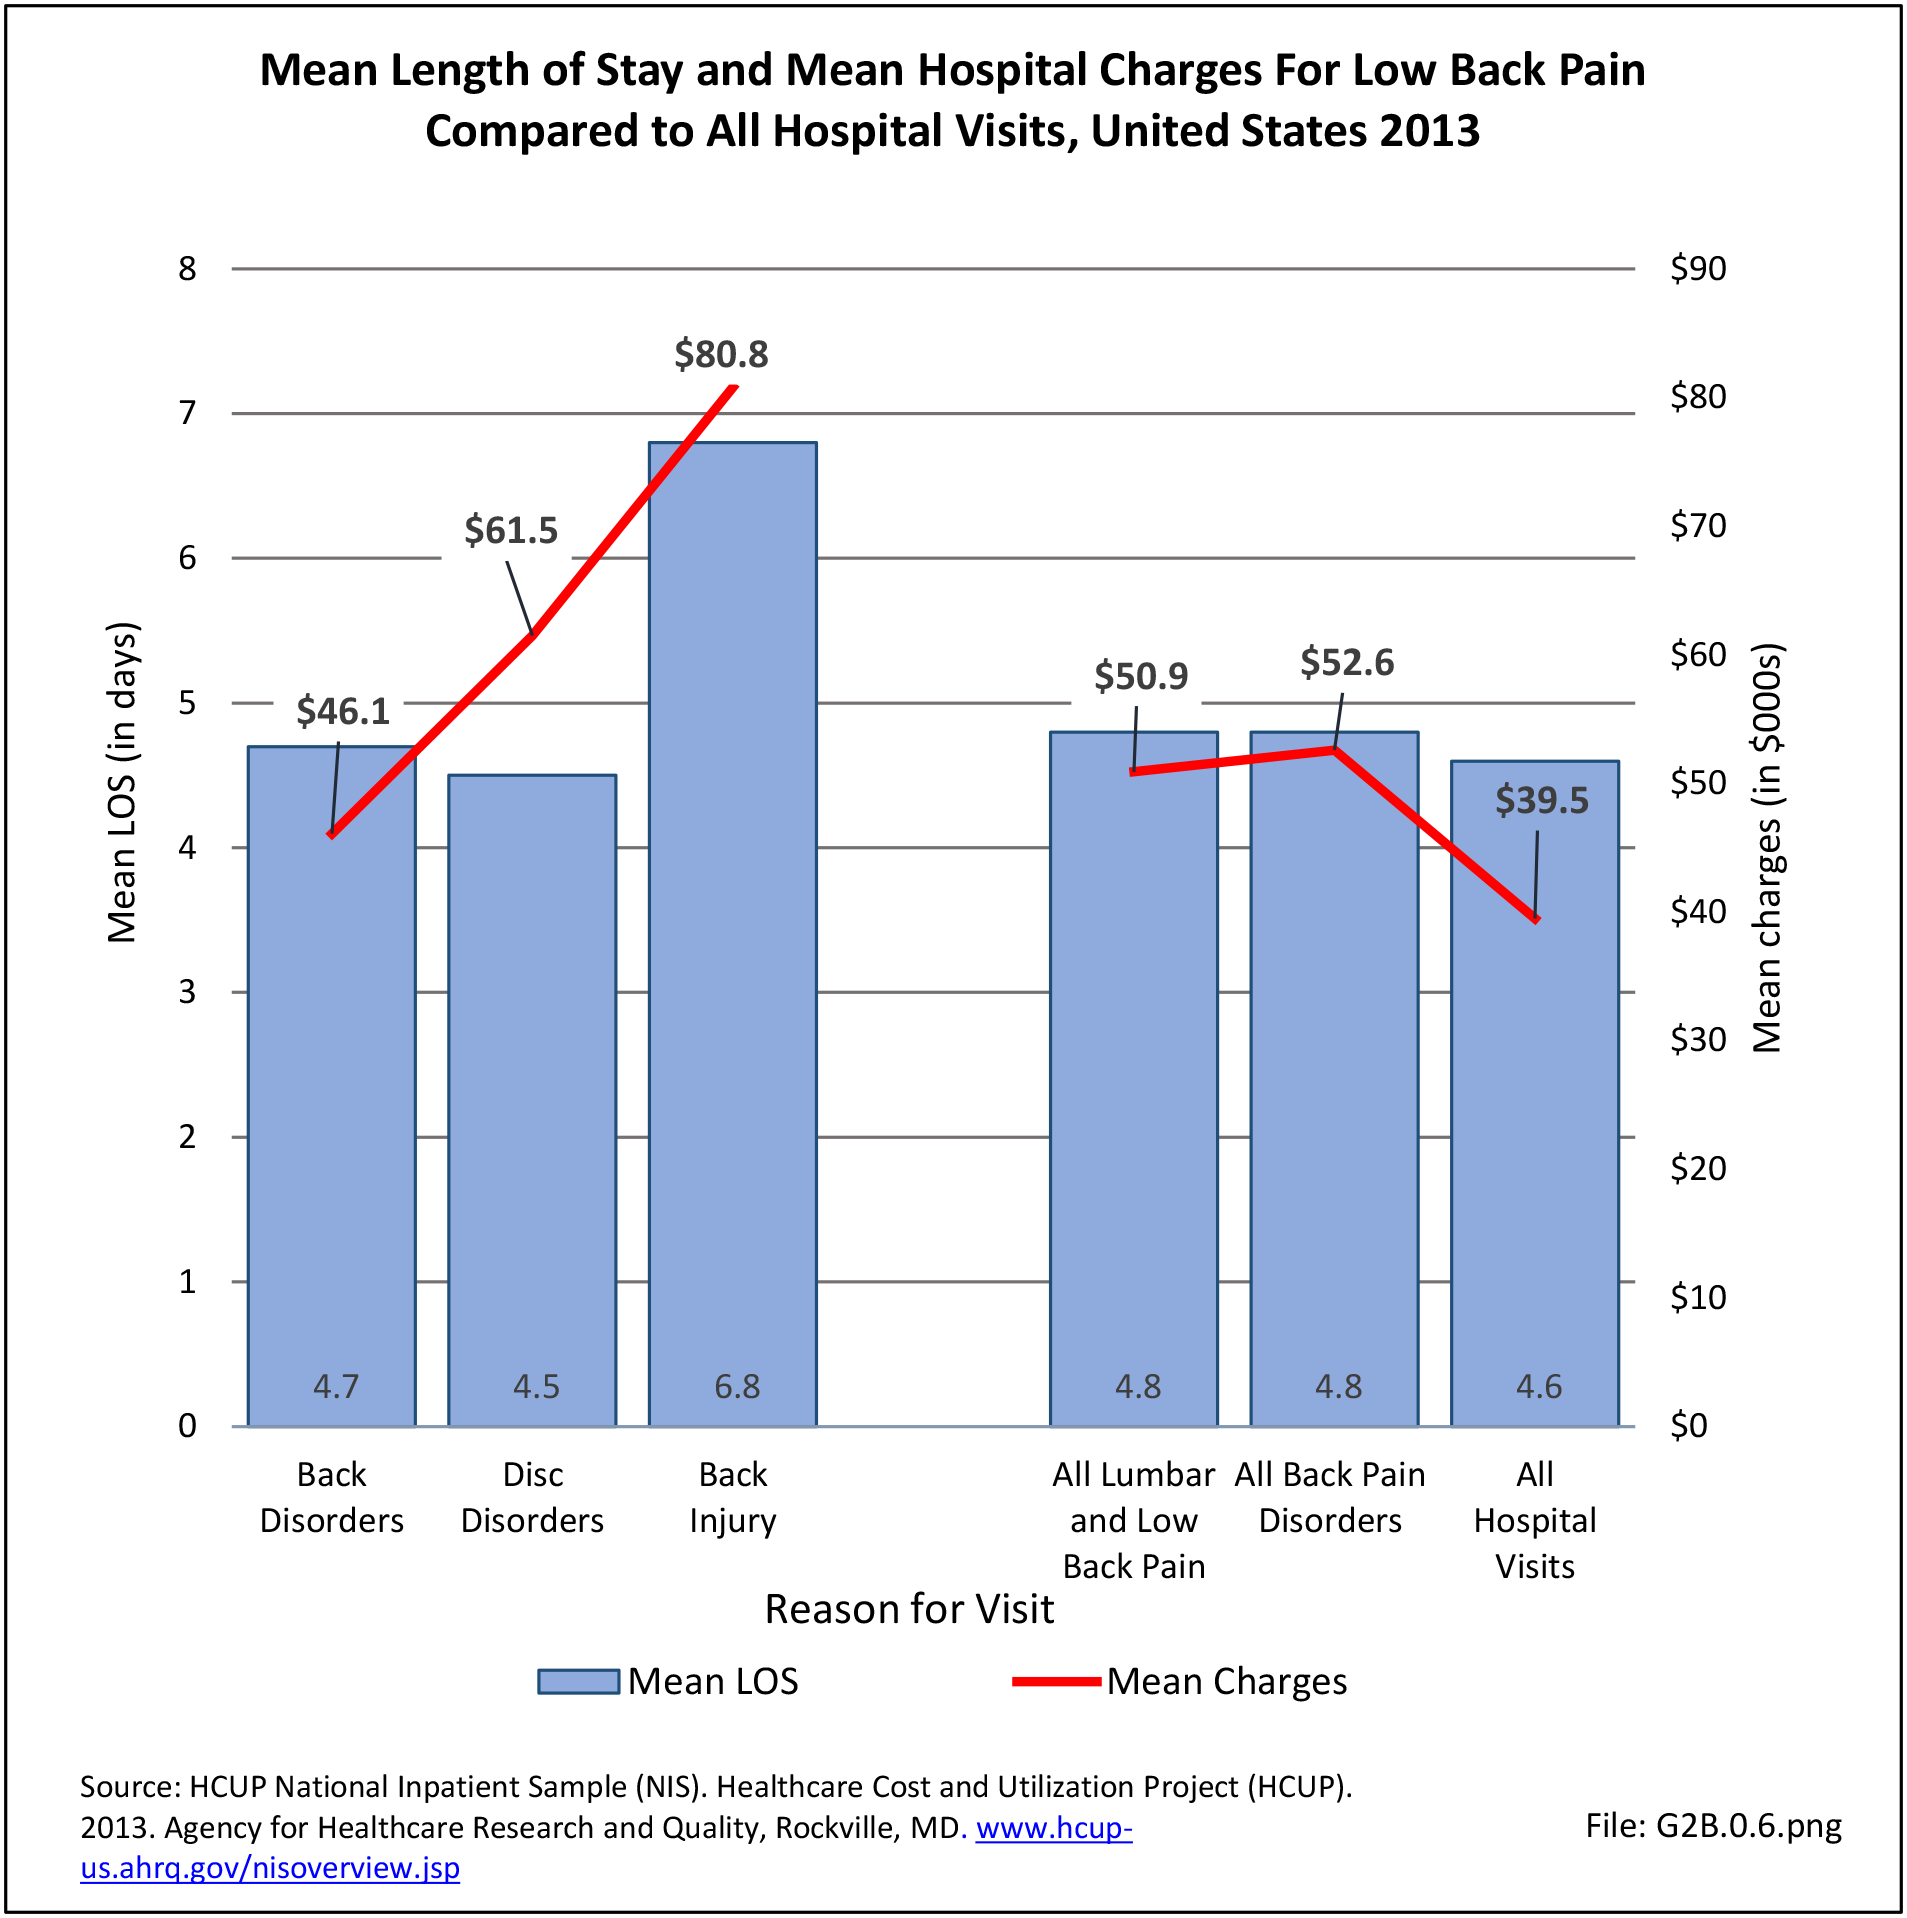
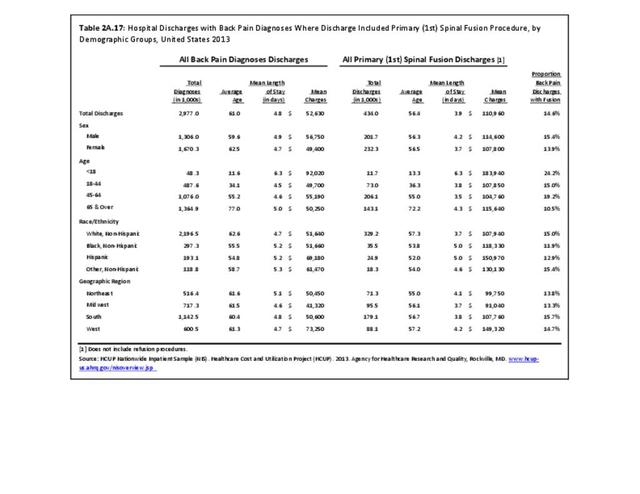
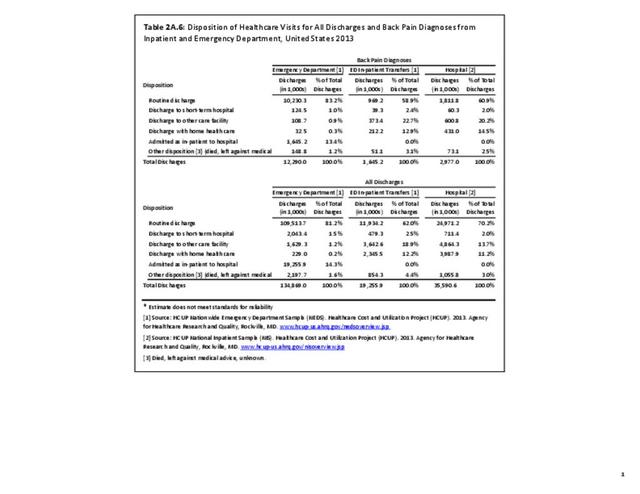
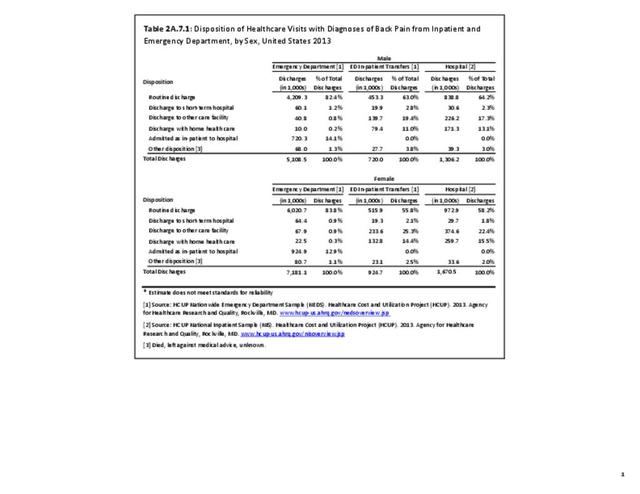
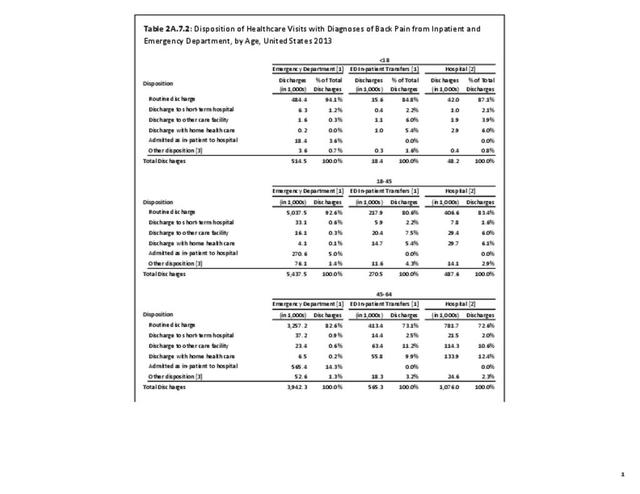
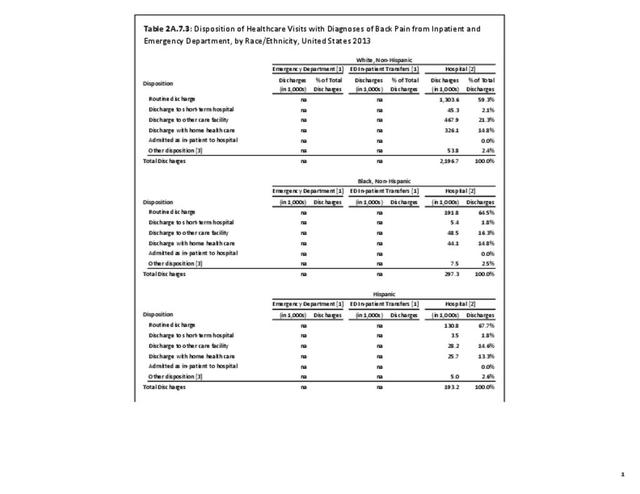
Using the Nationwide Inpatient Sample in 2013, a broad estimate can be made of fusion procedures as it relates to admissions. In 2013, 14.6% of patients discharged with a diagnoses of back pain had a spinal fusion procedure. Males (15.4% of back pain discharges) and females (13.9%) are almost equally likely to have a fusion. Patients in the 45- to 64-year age group were slightly more likely to have a fusion procedure (19.2%) than those in the 18- to 44- years age group (15%), or in the 65- years and older age group (10.5%). Patients younger than age 18, at 24.2%, were most likely to undergo a fusion procedure when hospitalized with a diagnosis of back pain, but they constitute a very small group of patients (1.6%) among those discharged with a diagnoses of back pain. Non-Hispanic white patients hospitalized with back pain were most likely to receive a fusion (15%) when compared to non-Hispanic black (12%) and Hispanic (13%) patients. Patients in the southern United States were most likely to undergo a fusion procedure (15.7%). Patients in the western United States were second most likely to receive a spinal fusion, followed by patients in the Northeast (13.8%) and Midwest (13.3%). The length of stay was shorter if a fusion was performed than if no fusion was performed (3.9 days vs. 4.8 days), but the mean charges were more than doubled for a back pain diagnosis when a fusion was performed ($52,630 vs $110,960). (Reference Table 2A.17 PDF CSV)

Primary Diagnosis
Information on the top twenty primary diagnoses and accumulative first five diagnoses for spinal fusion procedures performed in 2013 illustrates the procedure is most frequently performed in patients with lumbar spinal stenosis with or without neurogenic claudication. Lumbar disc degeneration or cervical disc displacement account for 9.6% and 9.5% of fusion procedures, respectively. (Reference Table 2A.18 PDF CSV)
 Diagnosis for Spinal Fusion Procedures, United States 2013")
Disk Displacement and Spinal Diskectomy
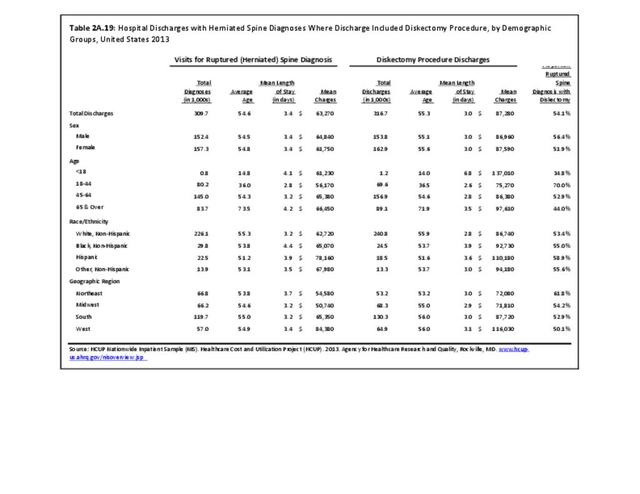
Diskectomy procedures, a surgical procedure to remove the damaged portion of a herniated disk, occurred in approximately 317,000 hosptial inpatients in 2013, with slightly more females than males undergoing the procedure. This number is likely misleading because many diskectomy procedures now occur in an outpatient setting. Of those undergoing the procedures, 35.3% had a diagnosis of either lumbar or cervical disc displacement, while 12% had a diagnosis of either lumbar or cervical disk degeneration. Approximately half of all diskectomy procedures were performed on persons in the 45 to 64 years age group, with an average age of 55.3 years. Across ethnic groups, the average age of presentation when undergoing diskectomy procedure was in the mid-50s. Non-Hispanic white patients accounted for 76% of total discharges, followed by non-Hispanic black (7.7%) and Hispanic (5.8%) patients. When comparing geographic regions, a discrepancy in charges per diskectomy was observed. The South region of the US reported the highest number of total discharges, roughly 41% of all diskectomy procedure discharges, bu this is non-unexpected given the larger share and older age of the population in the South. The Midwest ranked second in total discharges with 21%, followed by the West (20%) and Northeast (17%). (Reference Table 2A.19 PDF CSV and Table 2A.20 PDF CSV)
 Diagnosis for Diskectomy Procedures, United States 2013")
Patients spent, on average, 3.0 days in the hospital for diskectomy procedures, a surprising number given the recent trends in discharge the same day. Although accounting for a very small number of procedures, persons younger than age 18 years had an average length of stay of 6.8 days. The mean charge for these procedures in 2013 dollars was $87,280. The western United States reported the highest charges, averaging $116,000 per procedure. This is significantly higher than the rest of the country, with the South at an averaged of just below $88,000, while the Northeast and Midwest regions were approximately $72,000. Hispanic patients averaged the highest mean charges for diskectomy procedures, estimated at $110,180. This is in comparison with a $92,730 mean charge for non-Hispanic black patients and a $86,740 mean charge for non-Hispanic white patients. (Reference Table 2A.19 PDF CSV)
Table 2A.21 shows the diskectomy procedure trend in the United States from 1996 to 2013. It may seem surprising that the number is fairly stable given the population increase and the change in aging of the population. This is a reflection of the fact that more and more of these procedures are done in the outpatient setting and therefore not captured by the inpatient National Hospital Discharge Survey. (Reference Table 2A.21 PDF CSV)
Edition:
- Fourth Edition