The National Collegiate Athletic Association (NCAA) is a non-profit association that regulates athletes of more than 1,200 institutions, conferences, organizations, and individuals that organize athletic programs of many colleges and universities in the United States and Canada. Athletic programs of more than 1,100 member schools that compete are divided into three levels or divisions.1 Nearly a half-million student-athletes participate in NCAA sports that offer national championships annually, and this number continues to grow. During the 2018-2019 academic year, the number of teams competing in NCAA championship sponsored sports reached an all-time high of 19,750. However, only about 6% of high school athletes will participate in NCAA intercollegiate sports.2
While there are numerous benefits associated with participating in collegiate athletics, there is also an increased risk of injury associated with participating in many types of sports. These injuries primarily affect the musculoskeletal system, in general, and the lower and upper extremities specifically. Though awareness of risk of injury associated with participating in collegiate athletics is growing, there is little known about the long-term impact of injuries sustained while participating in collegiate athletics. Recent injury data from the NCAA Injury Surveillance System, as well as reports for specific joint injuries sustained by NCAA athletes and emerging data on the potential long-term impact of these injuries on health related quality of life, is presented.
For over 30 years, the NCAA and the Datalys Center (since 2009) has been engaged in active injury surveillance within the unique population of college athletes. Collaborative efforts between the NCAA and the National Athletic Trainers’ Association (NATA) have yielded rich injury surveillance data used to inform important rule changes to protect player safety.3 In a 2007 special issue of The Journal of Athletic Training, data from the NCAA injury surveillance system from the 1988-89 academic year through the 2003-2004 academic year were reviewed for 15 collegiate sports.4 With permission from the publisher, data from this study is included in this site. To read the full article, click here.
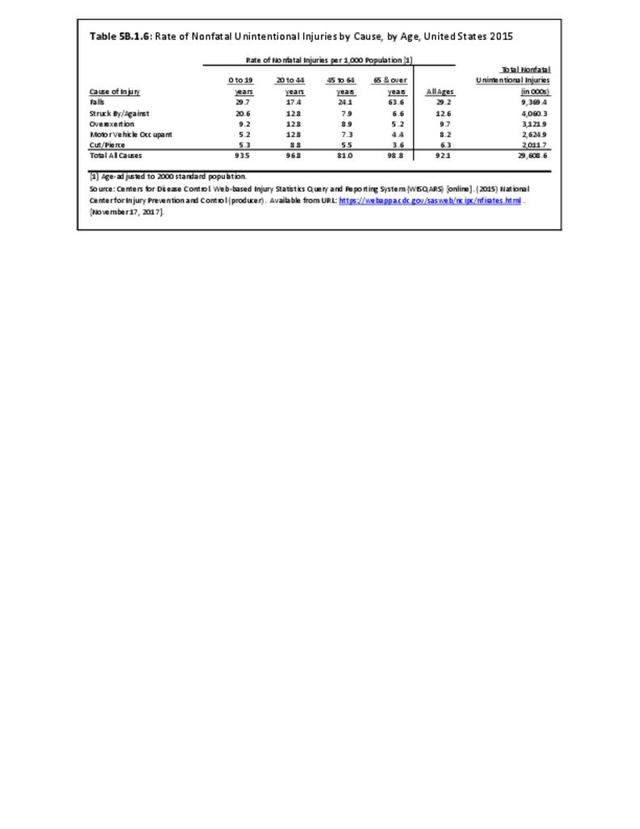
The 15 sports examined included five fall sports (men’s football, women’s field hockey, men’s soccer, women’s soccer, and women’s volleyball), six winter sports (men’s basketball, women’s basketball, women’s gymnastics, men’s gymnastics, men’s ice hockey, and men’s wrestling), and five spring sports (men’s baseball, men’s football, women’s softball, men’s lacrosse, and women’s lacrosse). Data for men’s spring football were only included in the analysis of practice injuries. These data provided an overall summary of the NCAA data from the years 1988-1989 through 2003-2004, made recommendations for injury prevention initiatives, and provided insight into the burden of musculoskeletal injury experienced by collegiate athletes. Some of these data are highlighted in this section. More recently, a series of papers on the first decade of web-based injury surveillance in high school and collegiate athletes have been published.5,6,7,8,9,10,11 These data are also briefly integrated here, as appropriate, as they provide further insight into the incidence and burden of musculoskeletal injuries in collegiate athletes. Overall, musculoskeletal injuries to the upper and lower extremity account for approximately 80% of all injuries among NCAA athletes; however, injury patterns vary slightly by sport. The CDC, which estimates 2.6 million children ages 0 through 19 years are treated in emergency departments each year for sports and recreation related injuries12, provides tips on how to prevent sports-related injuries in their Protect the Ones You Love Initiative. Other professional societies and associations such as the American Orthopaedic Society for Sports Medicine’s (AOSSM) At Your Own Risk and Stop Sports Injuries, and the National Athletic Trainers Association (NATA) Position Statements also provide recommendations for injury prevention.
Incidence Rates
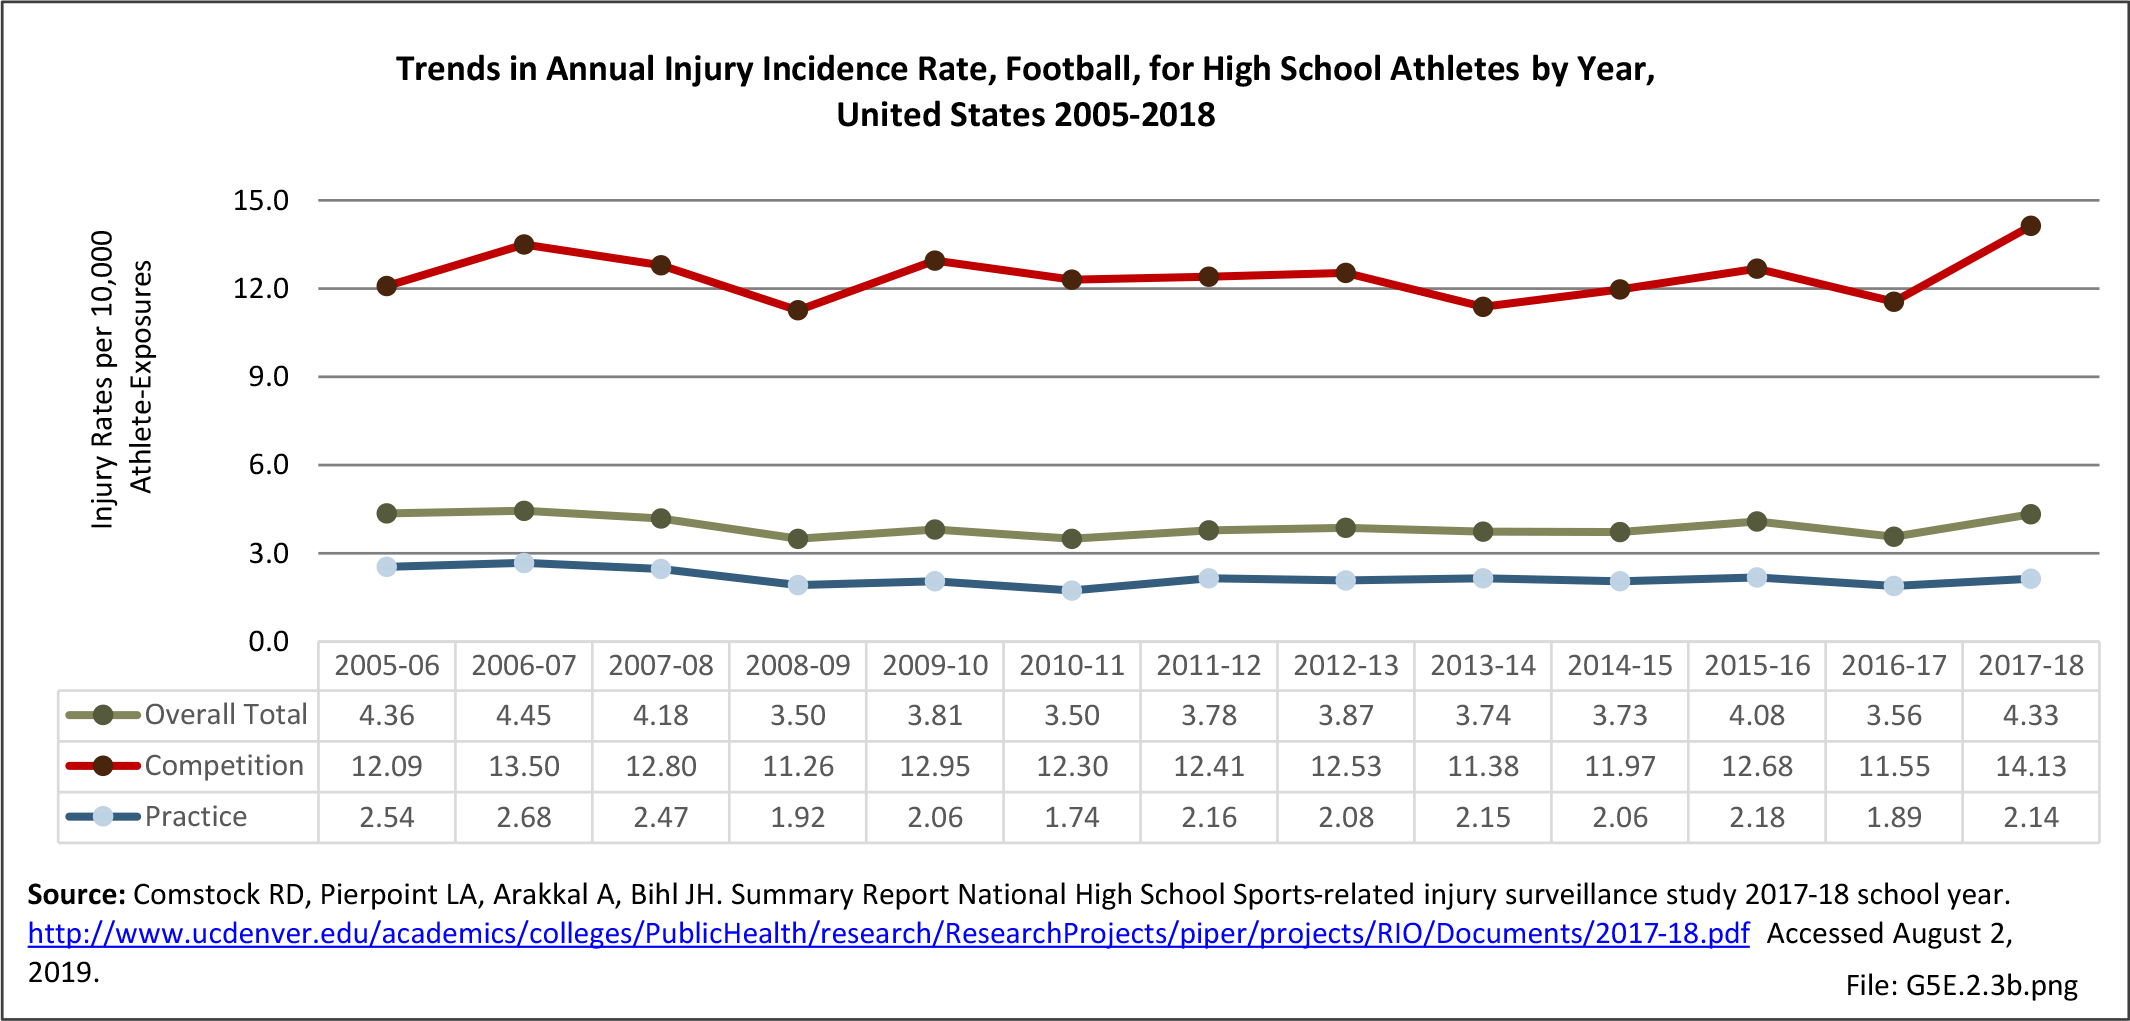
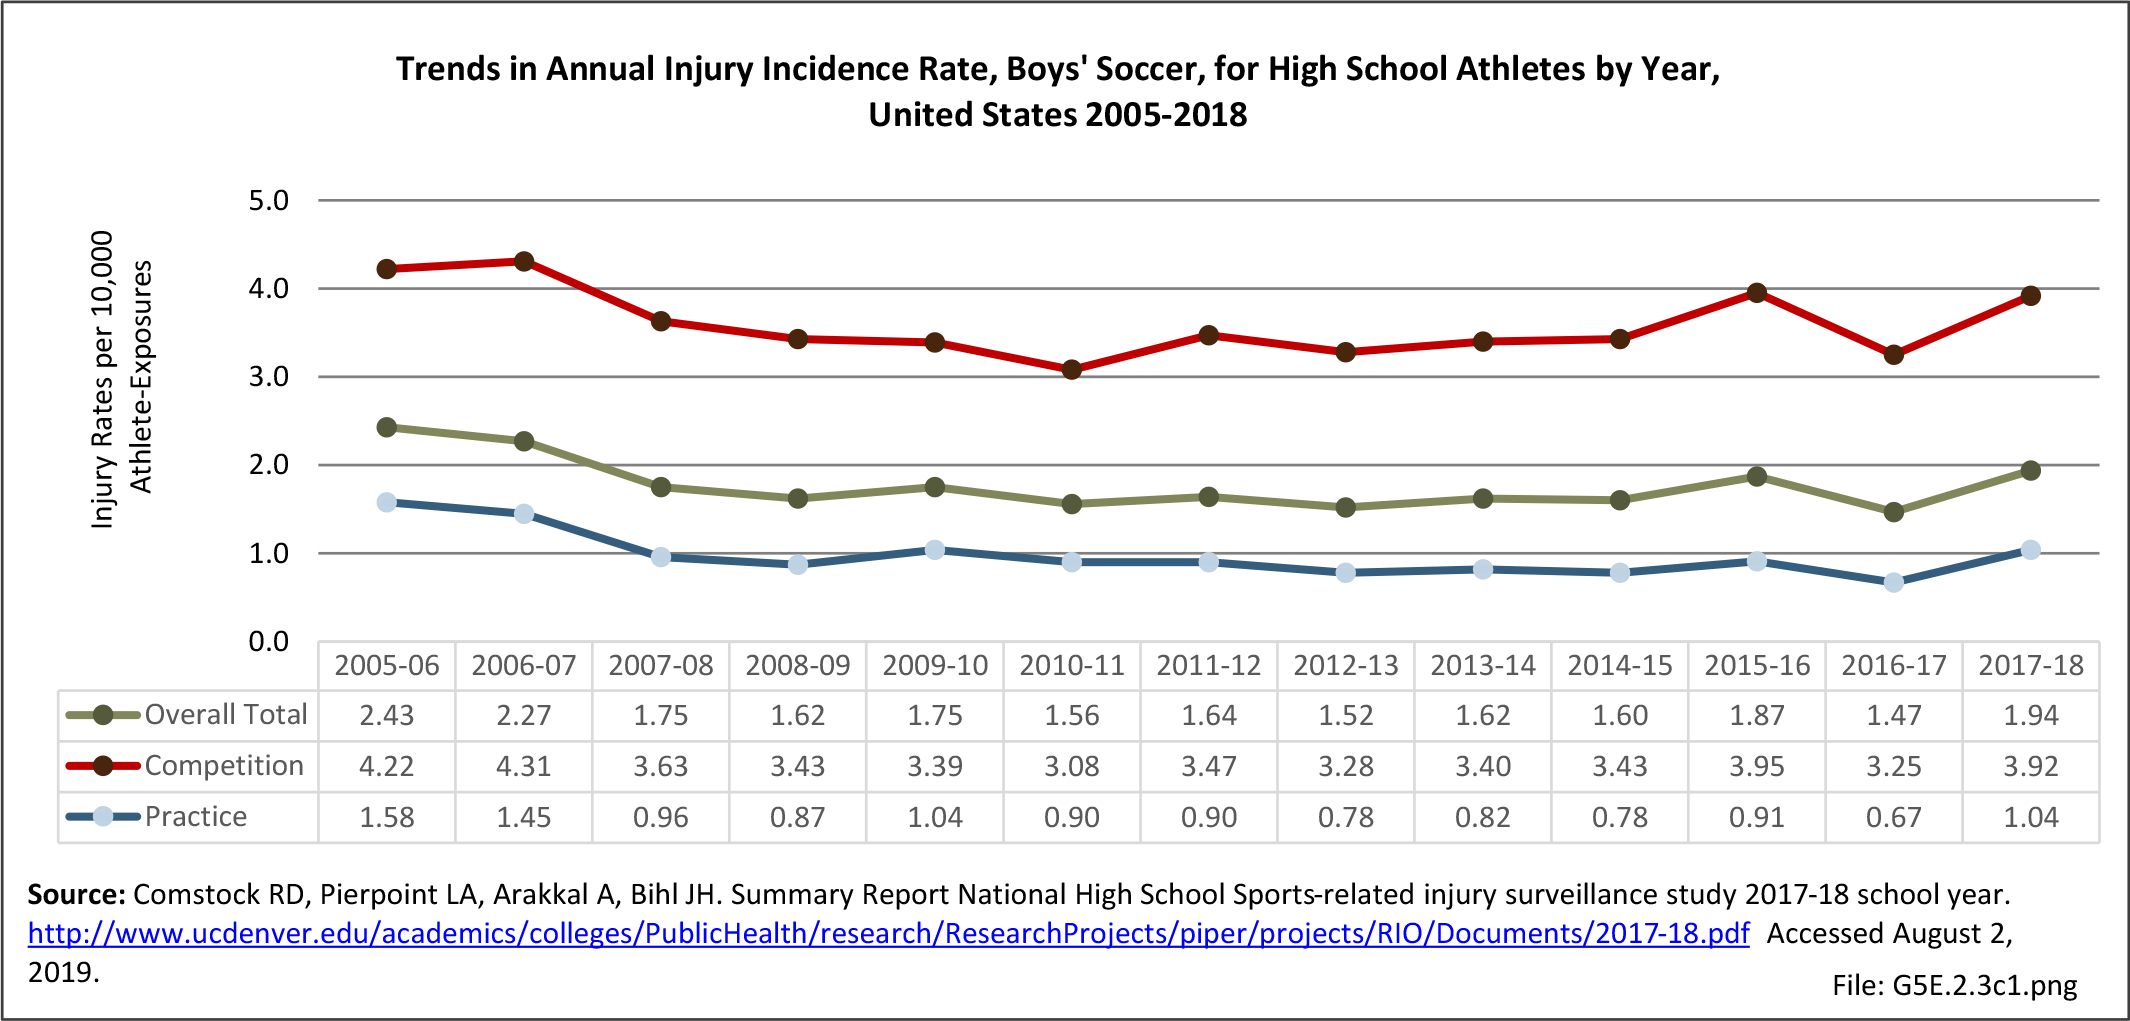
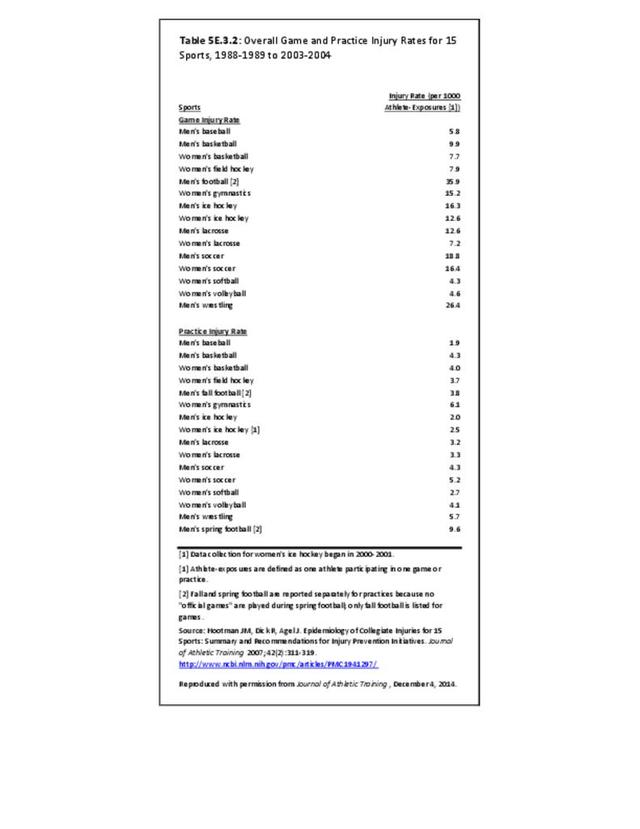
Overall, incidence rates for the 15 sports examined range from a high of 35.9 per 1,000 game athlete-exposures for men’s football to a low of 1.9 for men’s practice basketball. Among men, the highest injury rates were observed in football, wrestling, soccer, and ice hockey. Among women, the highest injury rates were experienced in soccer, gymnastics, ice hockey, and field hockey. (Reference Table 5E.3.2 PDF CSV)

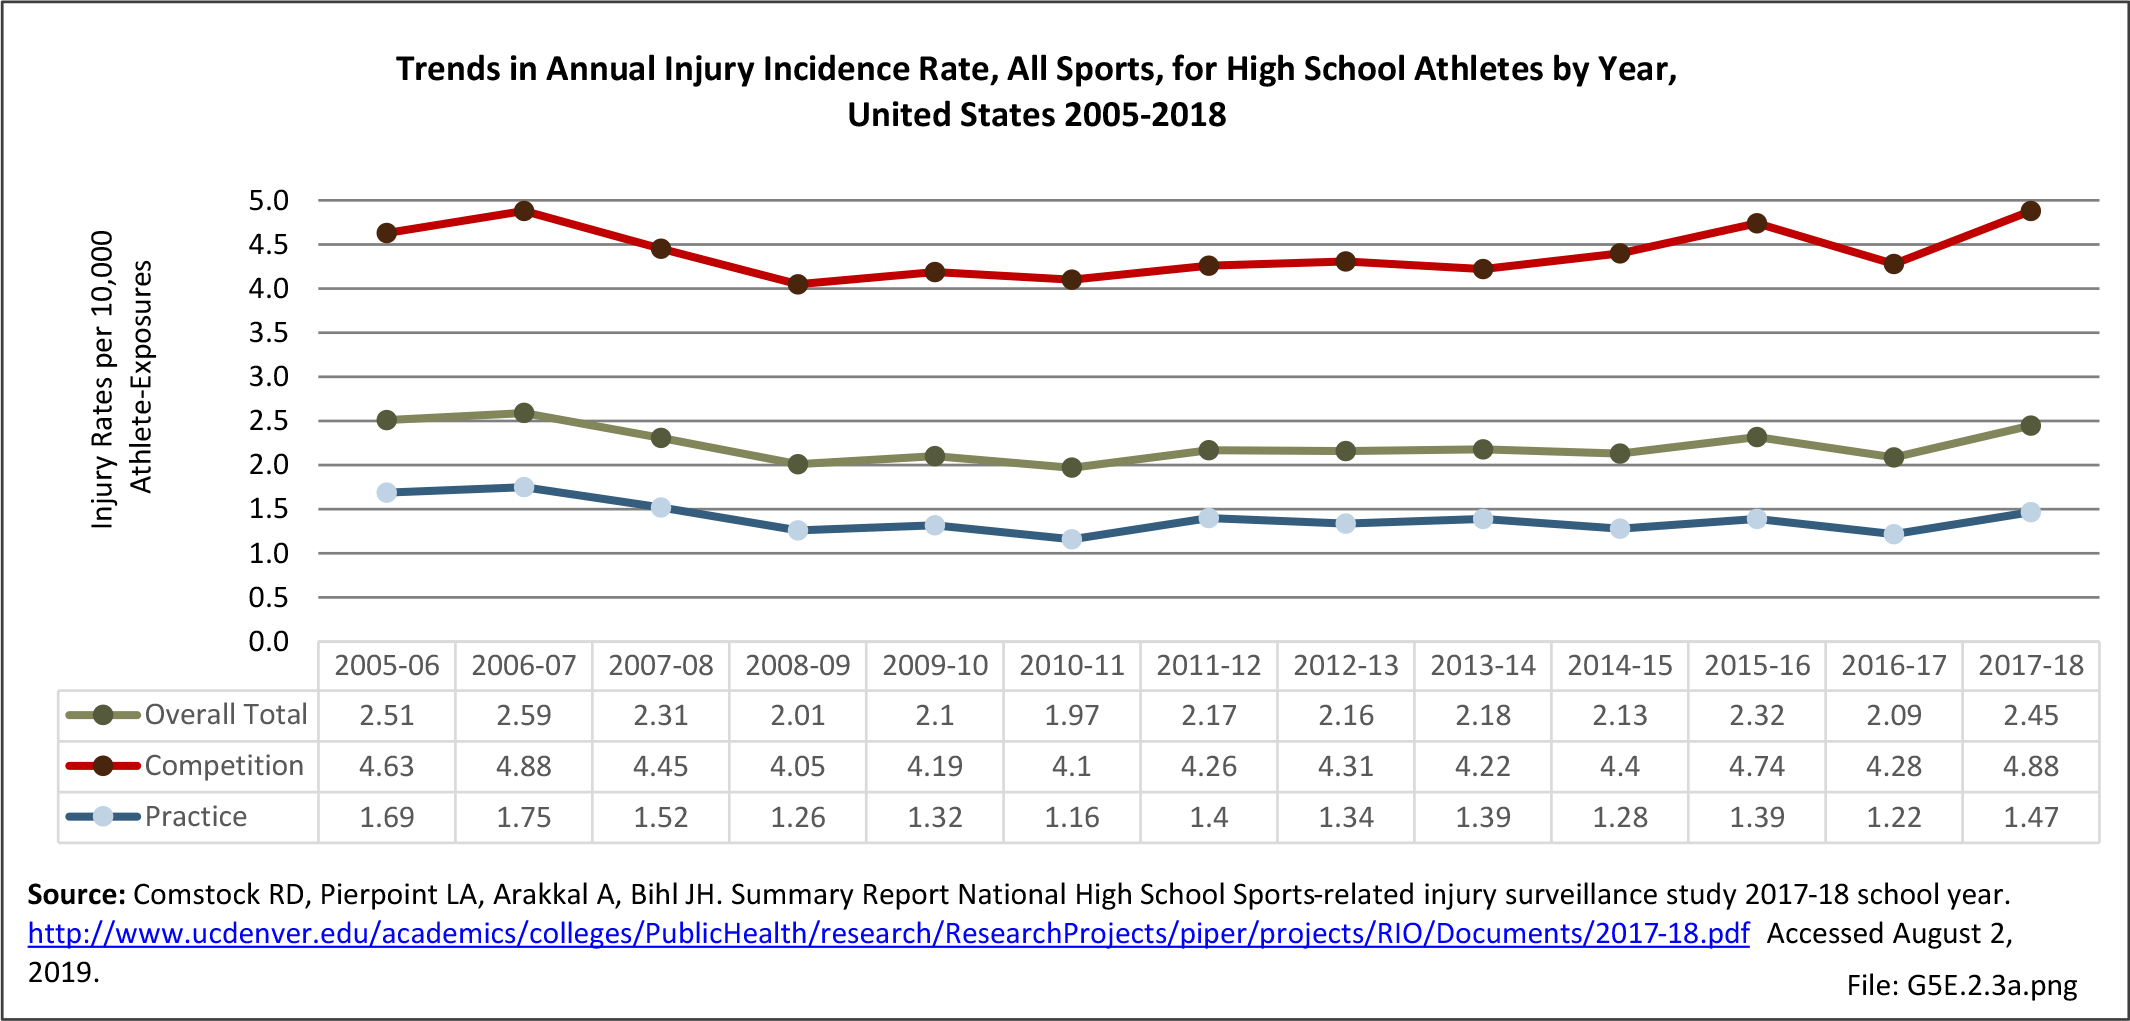
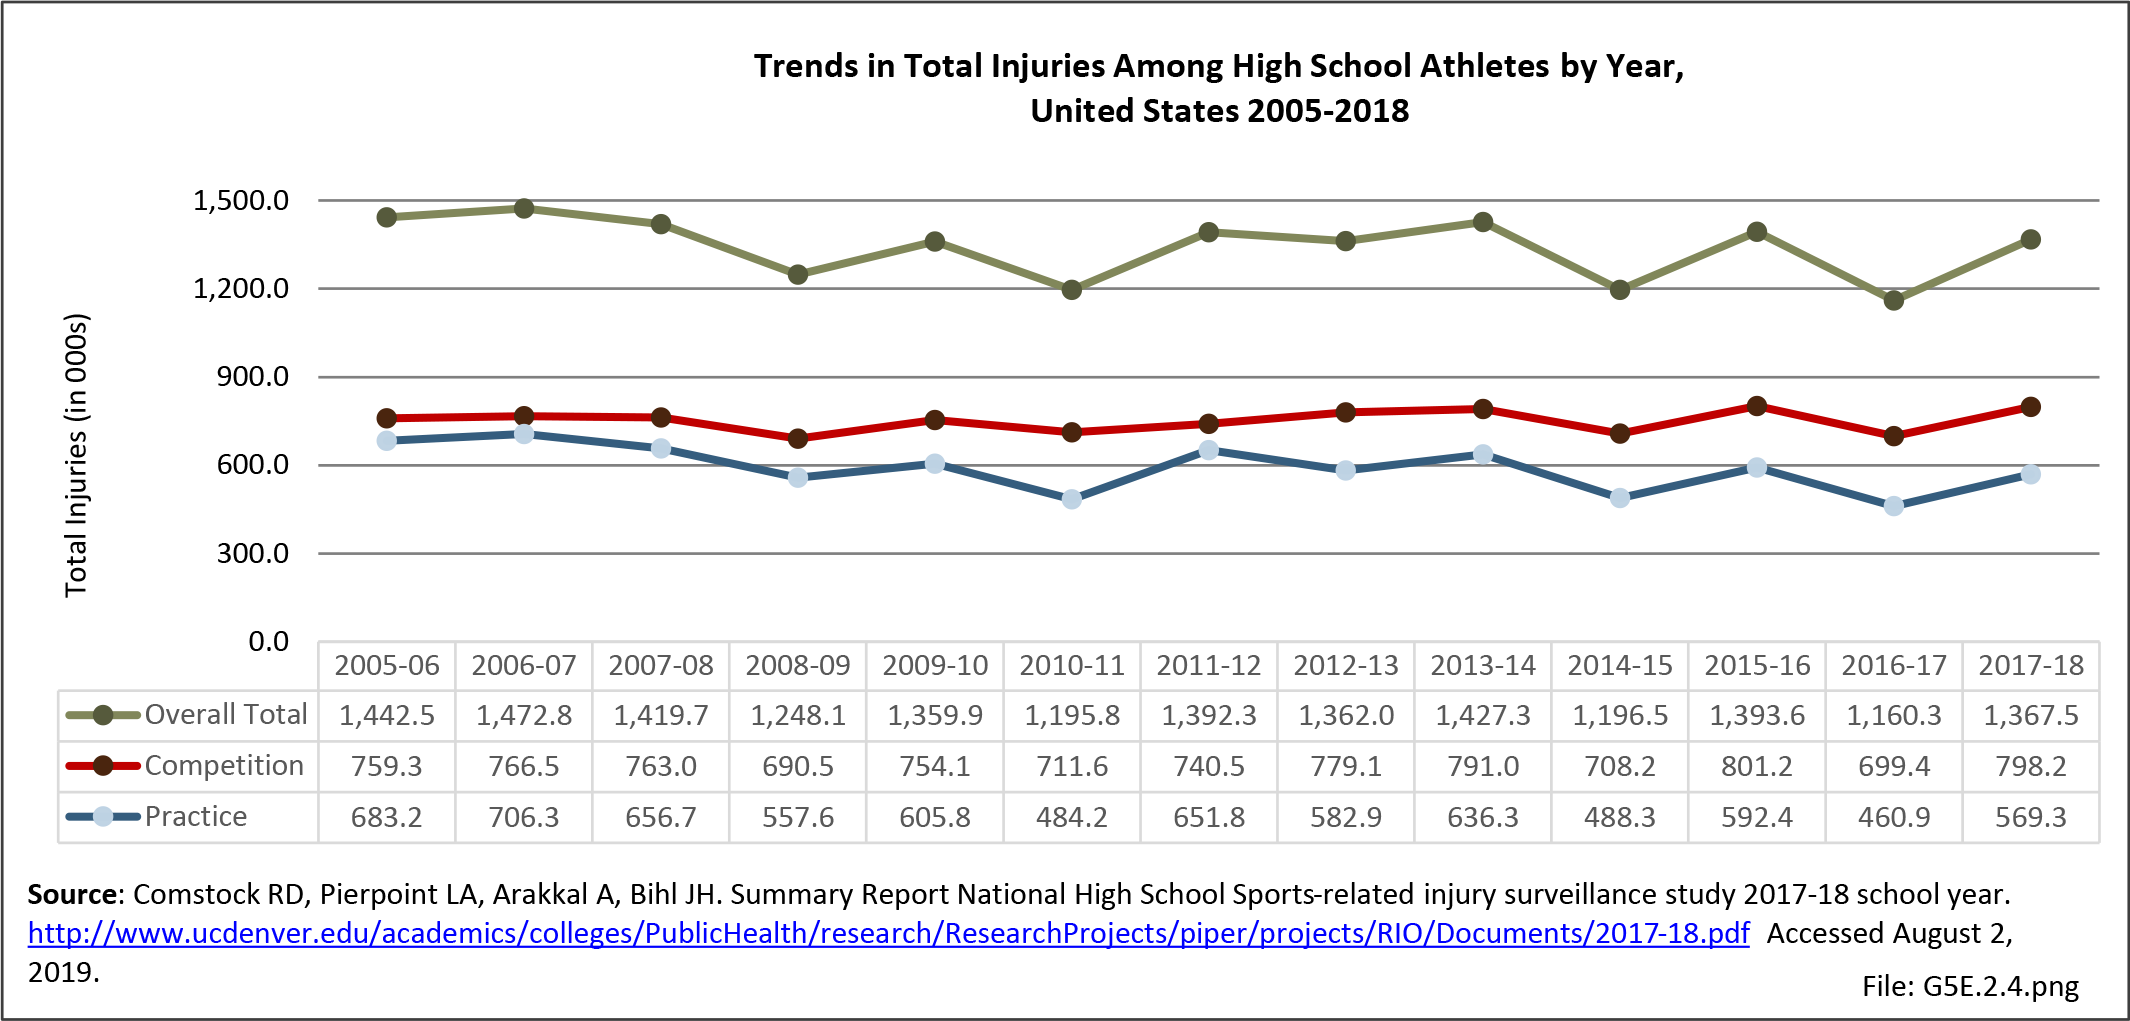
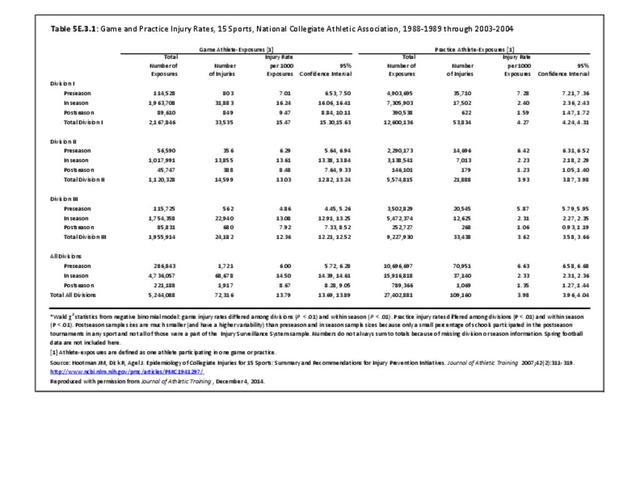
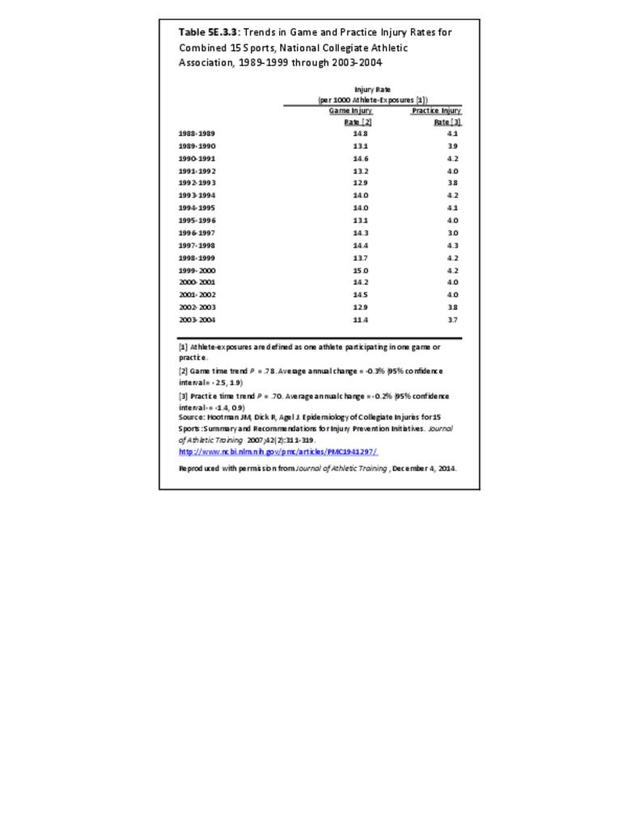
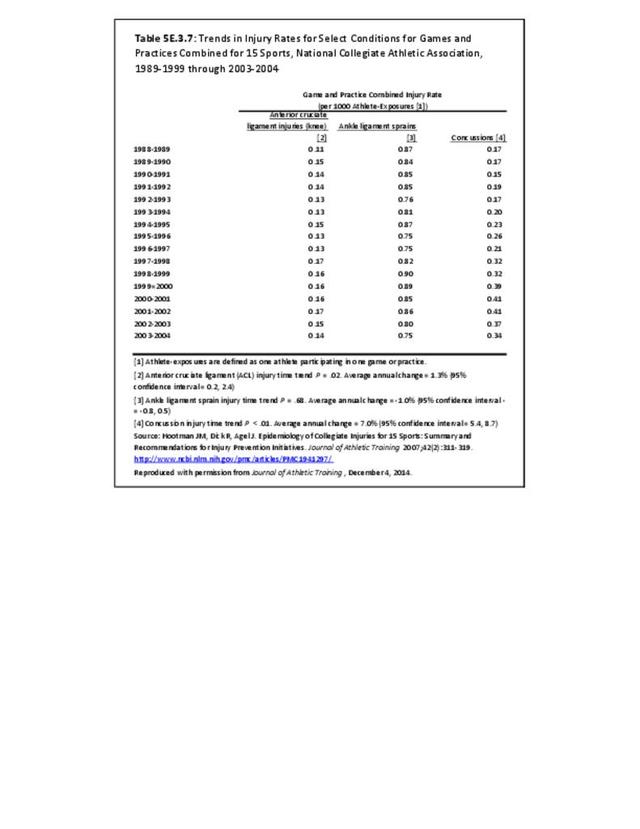
When data for all 15 sports are combined, injury rates are significantly higher in games (13.8 injuries per 1,000 athlete exposures) when compared to practice (4.0 injuries per 1,000 athlete exposures). Pre-season practice injury rates were significantly higher when compared to in-season or post-season training sessions. (Reference Table 5E.3.1 PDF CSV) Combined injury rates for all 15 NCAA sports studied remained relatively stable over time. No significant changes were observed in injury rates during games or practices over the 16-year study period. (Reference Table 5E.3.7 PDF CSV)

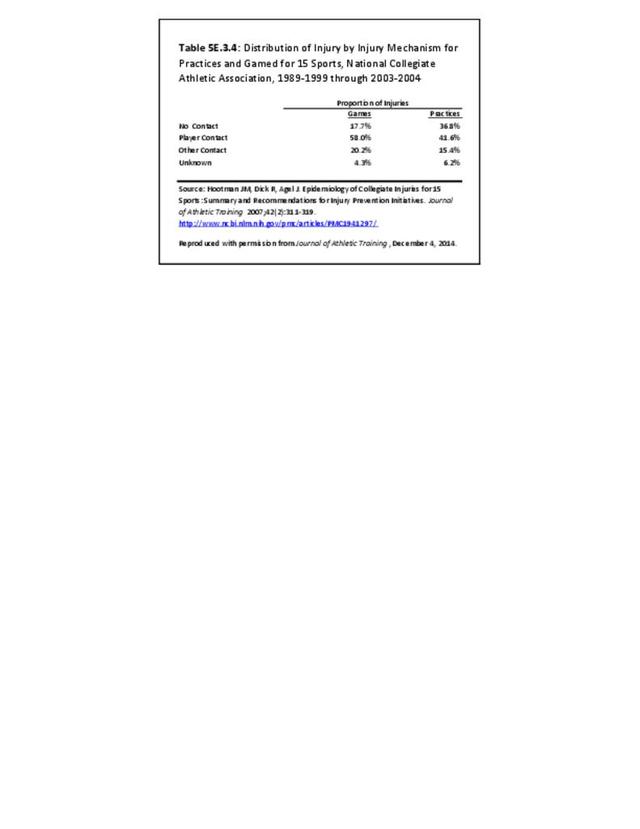
The majority of injuries resulted from contact with another player, regardless of whether or not injuries were sustained in practices or games. (Reference Table 5E.3.4 PDF CSV)

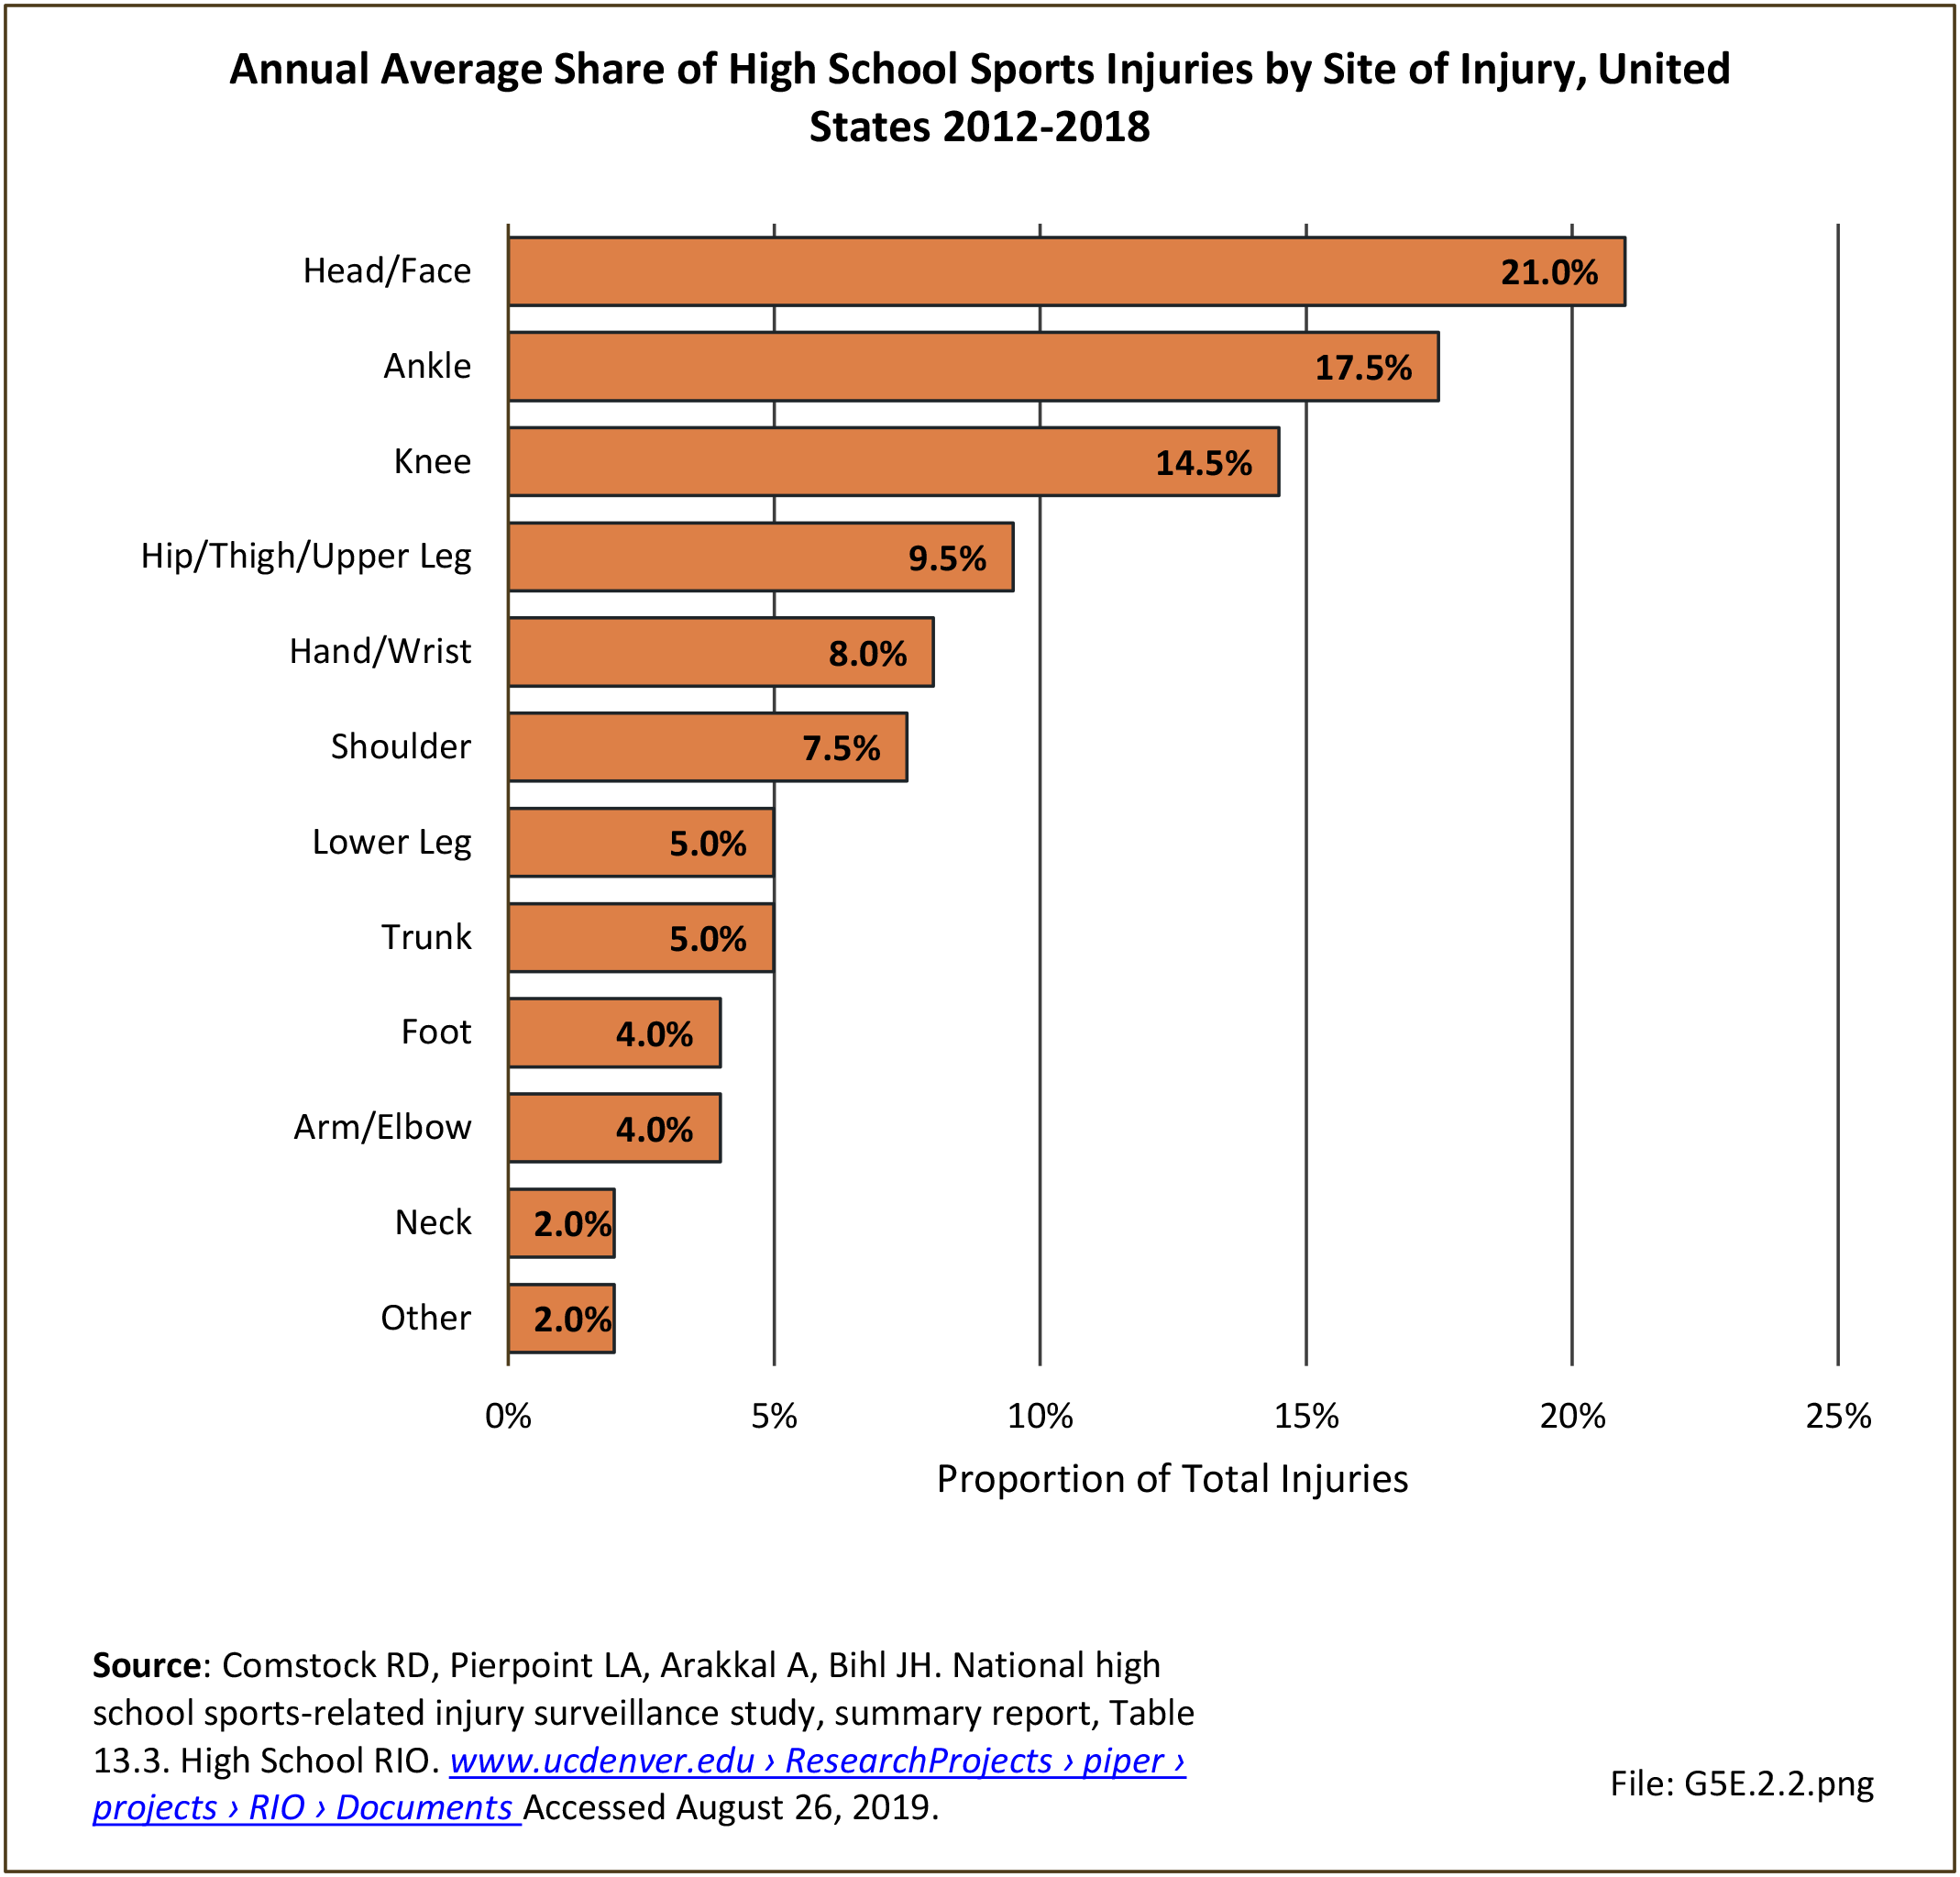
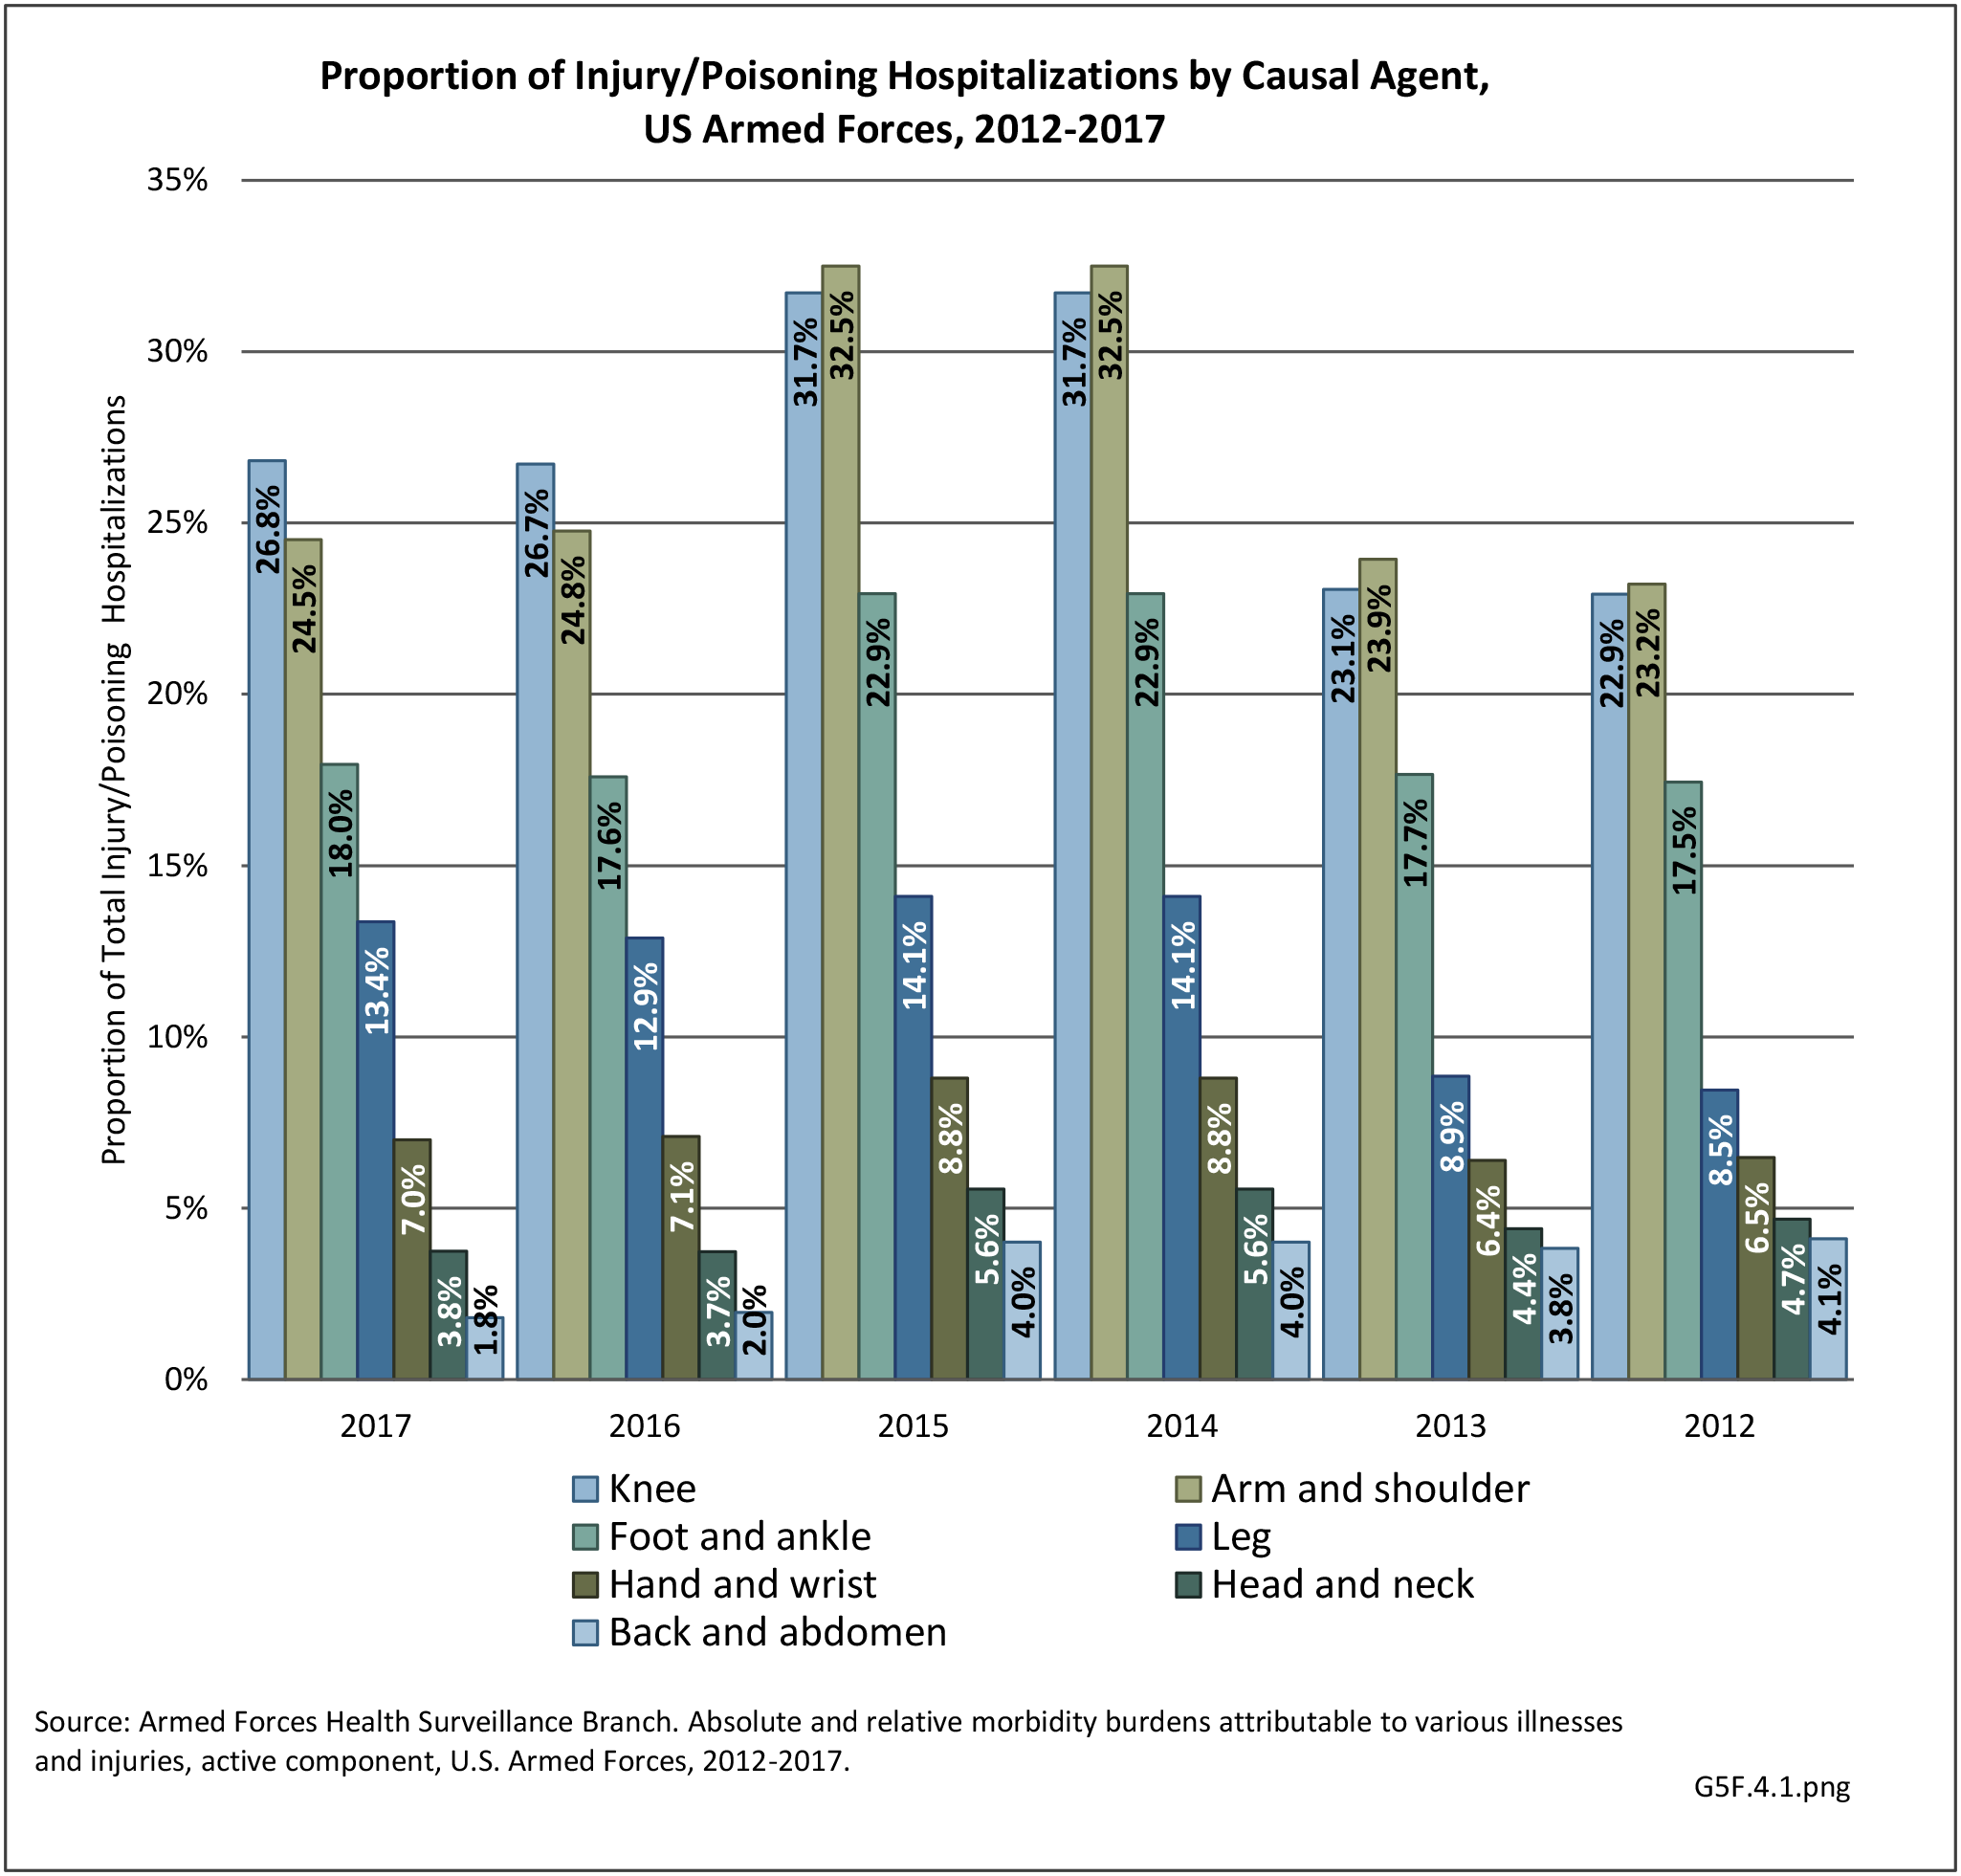
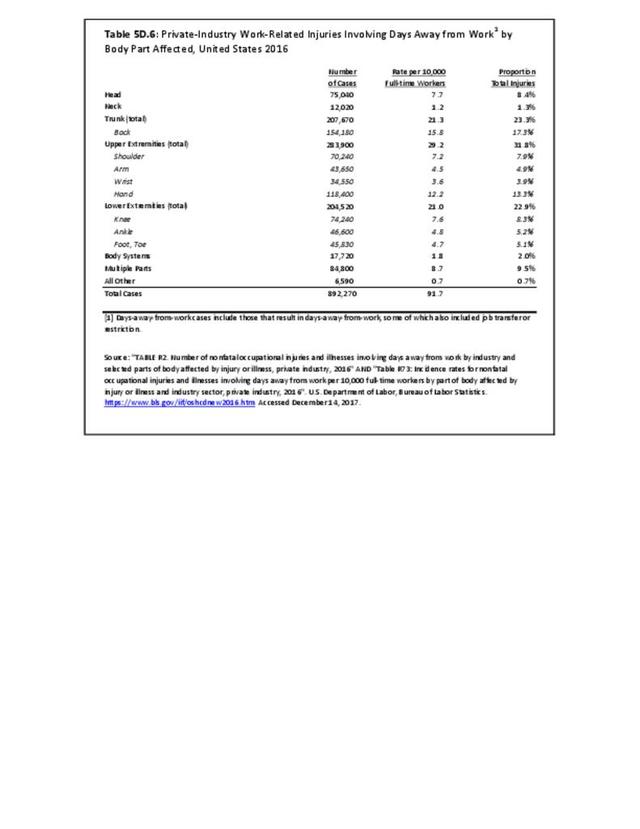
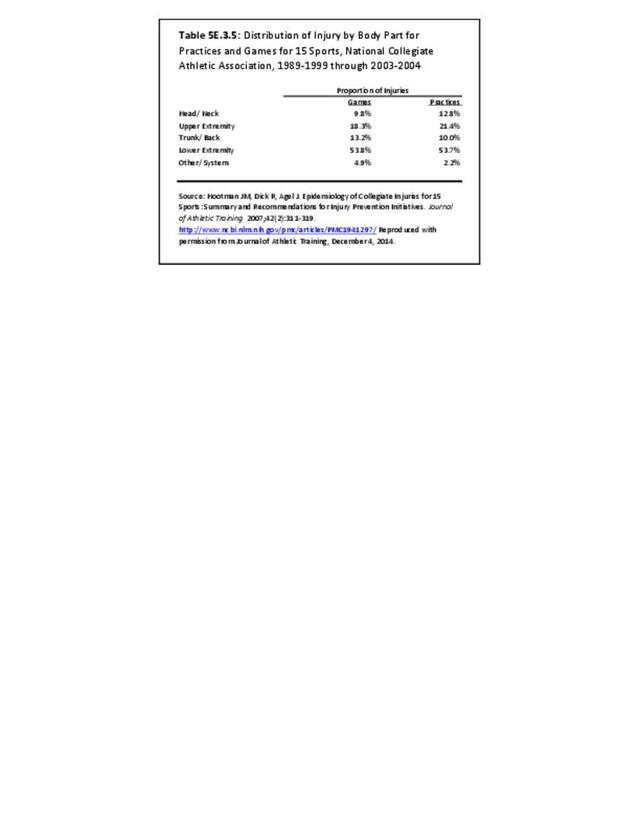
The majority of injuries documented during the study period affected the musculoskeletal system, with 72% of all injuries in games and 75% of all injuries in practices affecting the extremities. Regardless of whether injuries occurred in practices or games, over half of all injuries reported across the 15 sports examined during the study period were to the lower extremity. (Reference Table 5E.3.5 PDF CSV)

Specific Injury Rates
The NCAA injury surveillance system has also been used to examine the incidence and injury patterns of specific injuries among collegiate athletes.13,14These studies have primarily focused on those injuries that likely have the greatest burden in terms of time loss from sport, the need for surgical intervention, and the potential for long-term impact on health. Specifically, joint injuries have been a primary concern as it is well documented that these injuries can lead to chronic instability and increase the risk of osteoarthritis and degenerative joint disease.
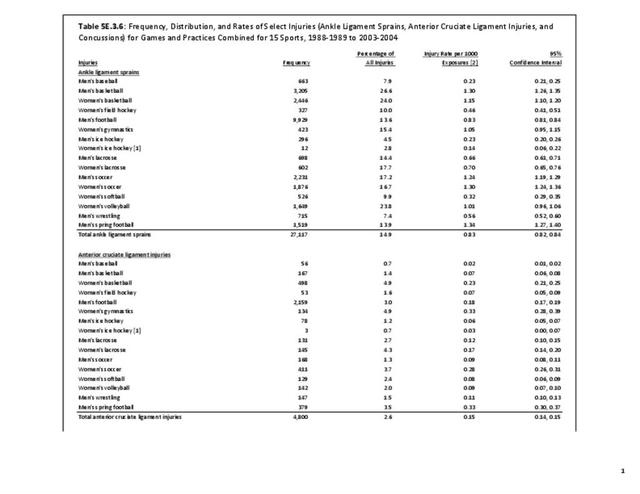
Acute traumatic anterior cruciate ligament (ACL) injuries in the knee often lead to chronic pain and instability, and generally require surgical repair to restore function and stability. There is also substantial evidence to suggest that acute traumatic knee joint injuries such as ACL tears significantly increase the risk for post-traumatic osteoarthritis. Several studies have focused on the rate of ACL injuries among collegiate athletes.4,11,15,16,17 estimated that approximately 2,000 athletes participating in 15 different men’s and women’s NCAA sports sustain an ACL tear annually. The average annual rate of ACL injury during the 16-year study period examined was 0.15 per 1,000 athlete-exposures. Arendt and Dick16 first reported that there were disparities in ACL injury incidence rates between males and females participating in the NCAA gender matched sports of soccer and basketball. This observation was confirmed in a follow-up study that examined data from 1990 through 2002.15 The authors reported that the rate of ACL injuries was 3 times higher in female soccer players (0.33) when compared to male soccer players (0.11). Similarly, they reported that the rate of ACL injuries was 3.6 times higher in female basketball players (0.29) when compared to males (0.08). Regardless of sport, the rates in females were significantly higher when compared to males. They also reported that ACL injury rates declined significantly in male soccer players during the study period but remained constant among female soccer players. (Reference Table 5E.3.6 PDF CSV)
 Injuries for Games and Practices Combined for 15 Sports, United States 1988-1989 to 2003-2004")
Despite the decreases in ACL injury rates observed by Agel et al15 in male soccer players, Hootman et al4 reported that ACL injury rates among males and females combined, participating in 15 different NCAA sports, significantly increased during the 16-year study period. On average, they reported a 1.3% annual increase in the rate of ACL injury over time (P=0.02). (Reference Table 5E.3.7 PDF CSV)

Dragoo et al13 compared ACL injury rates between NCAA football players participating on artificial turf and those participating on natural grass. They reported that the rate of ACL injury on artificial surfaces was significantly higher (1.39 times higher) than the injury rate on grass surfaces. A more recent study reports the injury rate on artificial turf 1.63 times higher than on grass surfaces.18 They also noted that non-contact injuries occurred more frequently on artificial turf surfaces (44%) than on natural grass (36%).
Ankle sprains are also common among NCAA athletes and they frequently lead to chronic pain, instability, and functional limitations. Hootman et al4 estimated that approximately 11,000 athletes participating in 15 different men’s and women’s NCAA sports sustain an ankle sprain annually. The average annual rate of ankle sprain injury during the 16-year study period examined was 0.86 per 1,000 athlete-exposures. They also examined the annual injury rates for ankle sprains among males and females participating in these sports combined between 1988 and 2004. They reported that injury rates remained constant during the 16-year study period. On average, there was a non-significant 0.1% (P=0.68) annual decrease in the rate of ankle sprains during the study period. (Reference Table 5E.3.6 PDF CSV)

Shoulder injuries, especially those that result in instability, also impact a significant number of NCAA athletes and can lead to chronic pain, recurrent instability, and functional limitations. Recurrent shoulder instability has also been associated with the increased risk of osteoarthritis in the shoulder. Surgical reconstruction is common following shoulder instability in young athletes. Owens et al14 examined the injury rates and patterns for shoulder instability among NCAA athletes over the 16-year period from 1988 through 2004 in the same 15 sports described previously. The overall injury rate for shoulder instability during the study period was 0.12 per 1,000 athlete-exposures. On average, this is comparable to just under 2,000 shoulder instability events experienced annually in NCAA athletes. Injury rates for shoulder instability were significantly higher in games when compared to practice. Overall, NCAA athletes were 3.5 (95% CI: 3.29-3.73) times more likely to experience shoulder instability events in games when compared to practices. Just over half (53%) of the shoulder instability events documented during the study period were first time instability events, with the remaining injuries being recurrent instability events (47%). Most shoulder instability events were due to contact with another athlete (68%) and other contact (20%). Nearly half (45%) of all shoulder instability events experienced by NCAA athletes during the study period resulted at least 10 days of lost playing time, with the remainder returning to play within 10 days of injury.
- 1. Division I is the highest level of intercollegiate athletics sanctioned NCAA in the United States. Division I schools include the major collegiate athletic powers, with larger budgets, more elaborate facilities, and more athletic scholarships than Divisions II and III, as well as many smaller schools committed to the highest level of intercollegiate competition. Division II is an intermediate-level division of competition in the NCAA. It offers an alternative to both the highly competitive, and highly expensive, level of intercollegiate sports offered in NCAA Division I and to the no athletic scholarship environment offered in Division III. Division III consists of colleges and universities that choose not to offer athletically related financial aid to their student-athletes.
- 2. NCAA: Estimated probability of competing in college athletics. http://www.ncaa.org/about/resources/research/estimated-probability-competing-college-athletics Accessed October 8, 2019.
- 3. Hootman JM. Celebrating 25 years of making sports safer. J Athl Train 2007;42(2):170.
- 4. a. b. c. d. Hootman JM, Dick R, Agel J. Epidemiology of collegiate injuries for 15 sports: summary and recommendations for injury prevention initiatives. J Athl Train. Apr-Jun 2007;42(2):311-319.
- 5. Wasserman EB, Register-Mihalik JK, Sauers EL, et al. The first decade of web-based sports injury surveillance: Descriptive epidemiology of injuries in US high school girls’ softball (2005-2006 through 2013-2014) and national collegiate athletic association women’s softball (2004-2005 through 2013-2014). J Athl Train. 2019;54(2):212-225.
- 6. Wasserman EB, Register-Mihalik JK, Sauers EL, et al. The first decade of web-based sports injury surveillance: Descriptive epidemiology of injuries in US high school boys’ baseball (2005-2006 through 2013-2014) and national collegiate athletic association men’s baseball (2004-2005 through 2013-2014). J Athl Train. 2019;54(2):198-211.
- 7. Kerr ZY, Gregory AJ, Wosmek J, et al. The first decade of web-based sports injury surveillance: Descriptive epidemiology of injuries in US high school girls’ volleyball (2005-2006 through 2013-2014) and national collegiate athletic association women’s volleyball (2004-2005 through 2013-2014). J Athl Train. 2018;53(10):926-937.
- 8. Kerr ZY, Putukian M, Chang CJ, et al. The first decade of web-based sports injury surveillance: Descriptive epidemiology of injuries in US high school boys’ soccer (2005-2006 through 2013-2014) and national collegiate athletic association men’s soccer (2004-2005 through 2013-2014). J Athl Train. 2018;53(9):893-905.
- 9. DiStefano LJ, Dann CL, Chang CJ, et al. The first decade of web-based sports injury surveillance: Descriptive epidemiology of injuries in US high school girls’ soccer (2005-2006 through 2013-2014) and national collegiate athletic association women’s soccer (2004-2005 through 2013-2014). J Athl Train. 2018;53(9):880-892.
- 10. Clifton DR, Hertel J, Onate JA, et al. The first decade of web-based sports injury surveillance: Descriptive epidemiology of injuries in US high school girls’ basketball (2005-2006 through 2013-2014) and national collegiate athletic association women’s basketball (2004-2005 through 2013-2014). J Athl Train. 2018;53(11):1037-1048.
- 11. a. b. Clifton DR, Onate JA, Hertel J, et al. The first decade of web-based sports injury surveillance: Descriptive epidemiology of injuries in US high school boys’ basketball (2005-2006 through 2013-2014) and national collegiate athletic association men’s basketball (2004-2005 through 2013-2014). J Athl Train. 2018;53(11):1025-1036.
- 12. Centers for Disease Control and Prevention. Protect the ones you love: child injuries are preventable. Sports safety. https://www.cdc.gov/safechild/sports_injuries/index.html Accessed August 26, 2019.
- 13. a. b. Dragoo JL, Braun HJ, Durham JL, Chen MR, Harris AH. Incidence and risk factors for injuries to the anterior cruciate ligament in National Collegiate Athletic Association football: data from the 2004-2005 through 2008-2009 National Collegiate Athletic Association Injury Surveillance System. Am J Sports Med. May 2012;40(5):990-995.
- 14. a. b. Owens BD, Agel J, Mountcastle SB, Cameron KL, Nelson BJ. Incidence of glenohumeral instability in collegiate athletics. Am J Sports Med. Sep 2009;37(9):1750-1754.
- 15. a. b. c. Agel J, Arendt EA, Bershadsky B. Anterior cruciate ligament injury in national collegiate athletic association basketball and soccer: a 13-year review. Am J Sports Med. 2005;33(4):524-530.
- 16. a. b. Arendt E, Dick R. Knee injury patterns among men and women in collegiate basketball and soccer. NCAA data and review of literature. Am J Sports Med. 1995;23(6):694-701.
- 17. Arendt EA, Agel J, Dick R. Anterior cruciate ligament injury patterns among collegiate men and women. J Athl Train. 1999;34(2):86-92.
- 18. Loughran GJ, Vulpis CT, Murphy JP. Incidence of knee injuries on artificial turf versus natural grass in national collegiate athletic association American football: 2004-2005 through 2013-2014 seasons. Am J Sports Med. 2019 May;47(6):1294-1301. doi: 10.1177/0363546519833925. Epub 2019 Apr 17.
Edition:
- Fourth Edition