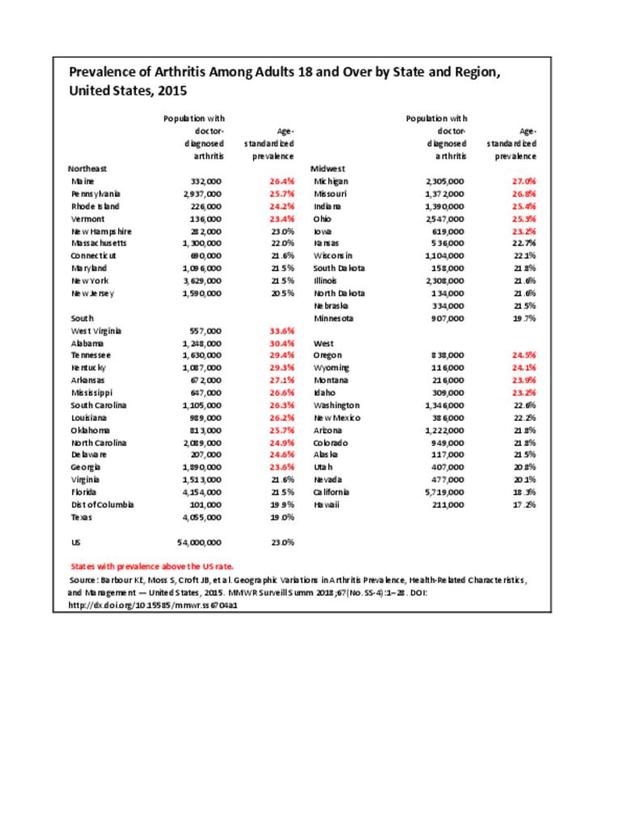
A recent study released by the CDC Arthritis Workgroup1 reported state-level arthritis prevalence estimates for the first time. Using the 2015 Behavioral Risk Factor Surveillance System (BRFSS) self-reported doctor-diagnosed data, age-adjusted for comparison across states, the median prevalence among adults across the 50 states and District of Columbia was 23.0%. State prevalence ranged from 17.2% in Hawaii to 33.6% in West Virginia. When viewed by states in the four regions used in this report, 75% of states in the South had an age-adjusted prevalence rate above that of the national rate of 23.0%. This compares to 40% in the Northeast, 42% in the Midwest, and 31% in the West. Furthermore, five states in the South (West Virginia, Alabama, Tennessee, Kentucky, and Arkansas) and two in the Midwest (Michigan and Missouri) had a majority of counties with an arthritis prevalence rate in the highest quartile (31.2%-42.7%). A summary of state age-adjusted doctor-diagnosed arthritis prevalence rates can be found by clicking HERE.
The study also looked at doctor-diagnosed arthritis prevalence among adults with three comorbid conditions. At 44.5%, prevalence of arthritis was highest among those with coronary heart disease. This was followed by adults with diabetes (37.3%) and obesity (30.9%).
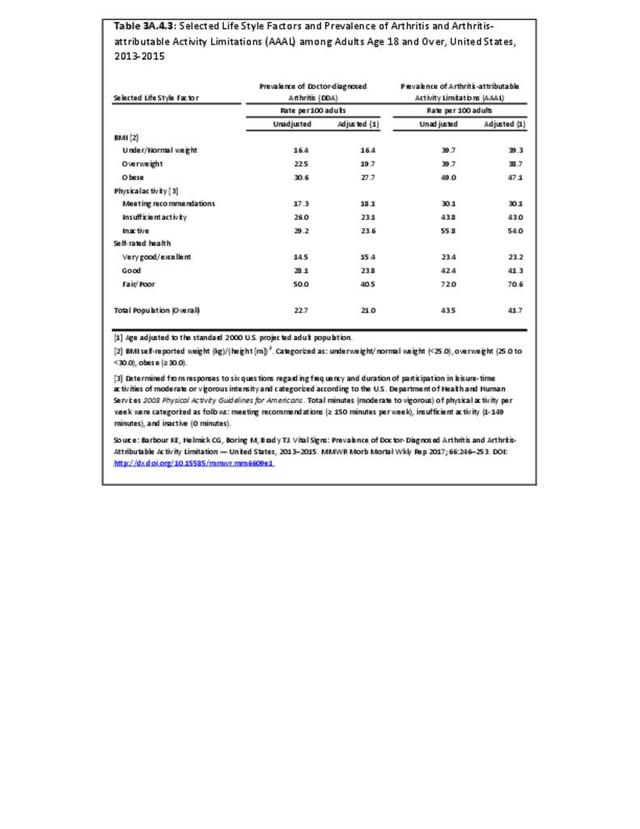
Leisure-time physical inactivity was also analyzed, and the median age-standardized percentage of inactive adults with arthritis was 35.0%. States in the western region tended to have the lowest prevalence of leisure-time physical inactivity with arthritis, while states in Appalachia and along the Ohio and Mississippi Rivers had the highest percentage of leisure-time physical inactivity, following the overall state prevalence rates for arthritis.
Findings from this study showed that estimated prevalence of arthritis varies by geographic area, with correlation to comorbid conditions and negative health-related characteristics. While direct causation cannot be made and further study is needed to understand why these geographic differences occur, the authors have postulated that known risk factors for arthritis such as comorbid conditions, occupation, socioeconomic status, and negative health-related characteristics may contribute. Access to medical care and medications may also be factors.
The full study of arthritis prevalence by state can be found at https://www.cdc.gov/arthritis/data_statistics/state-data-current.htm.
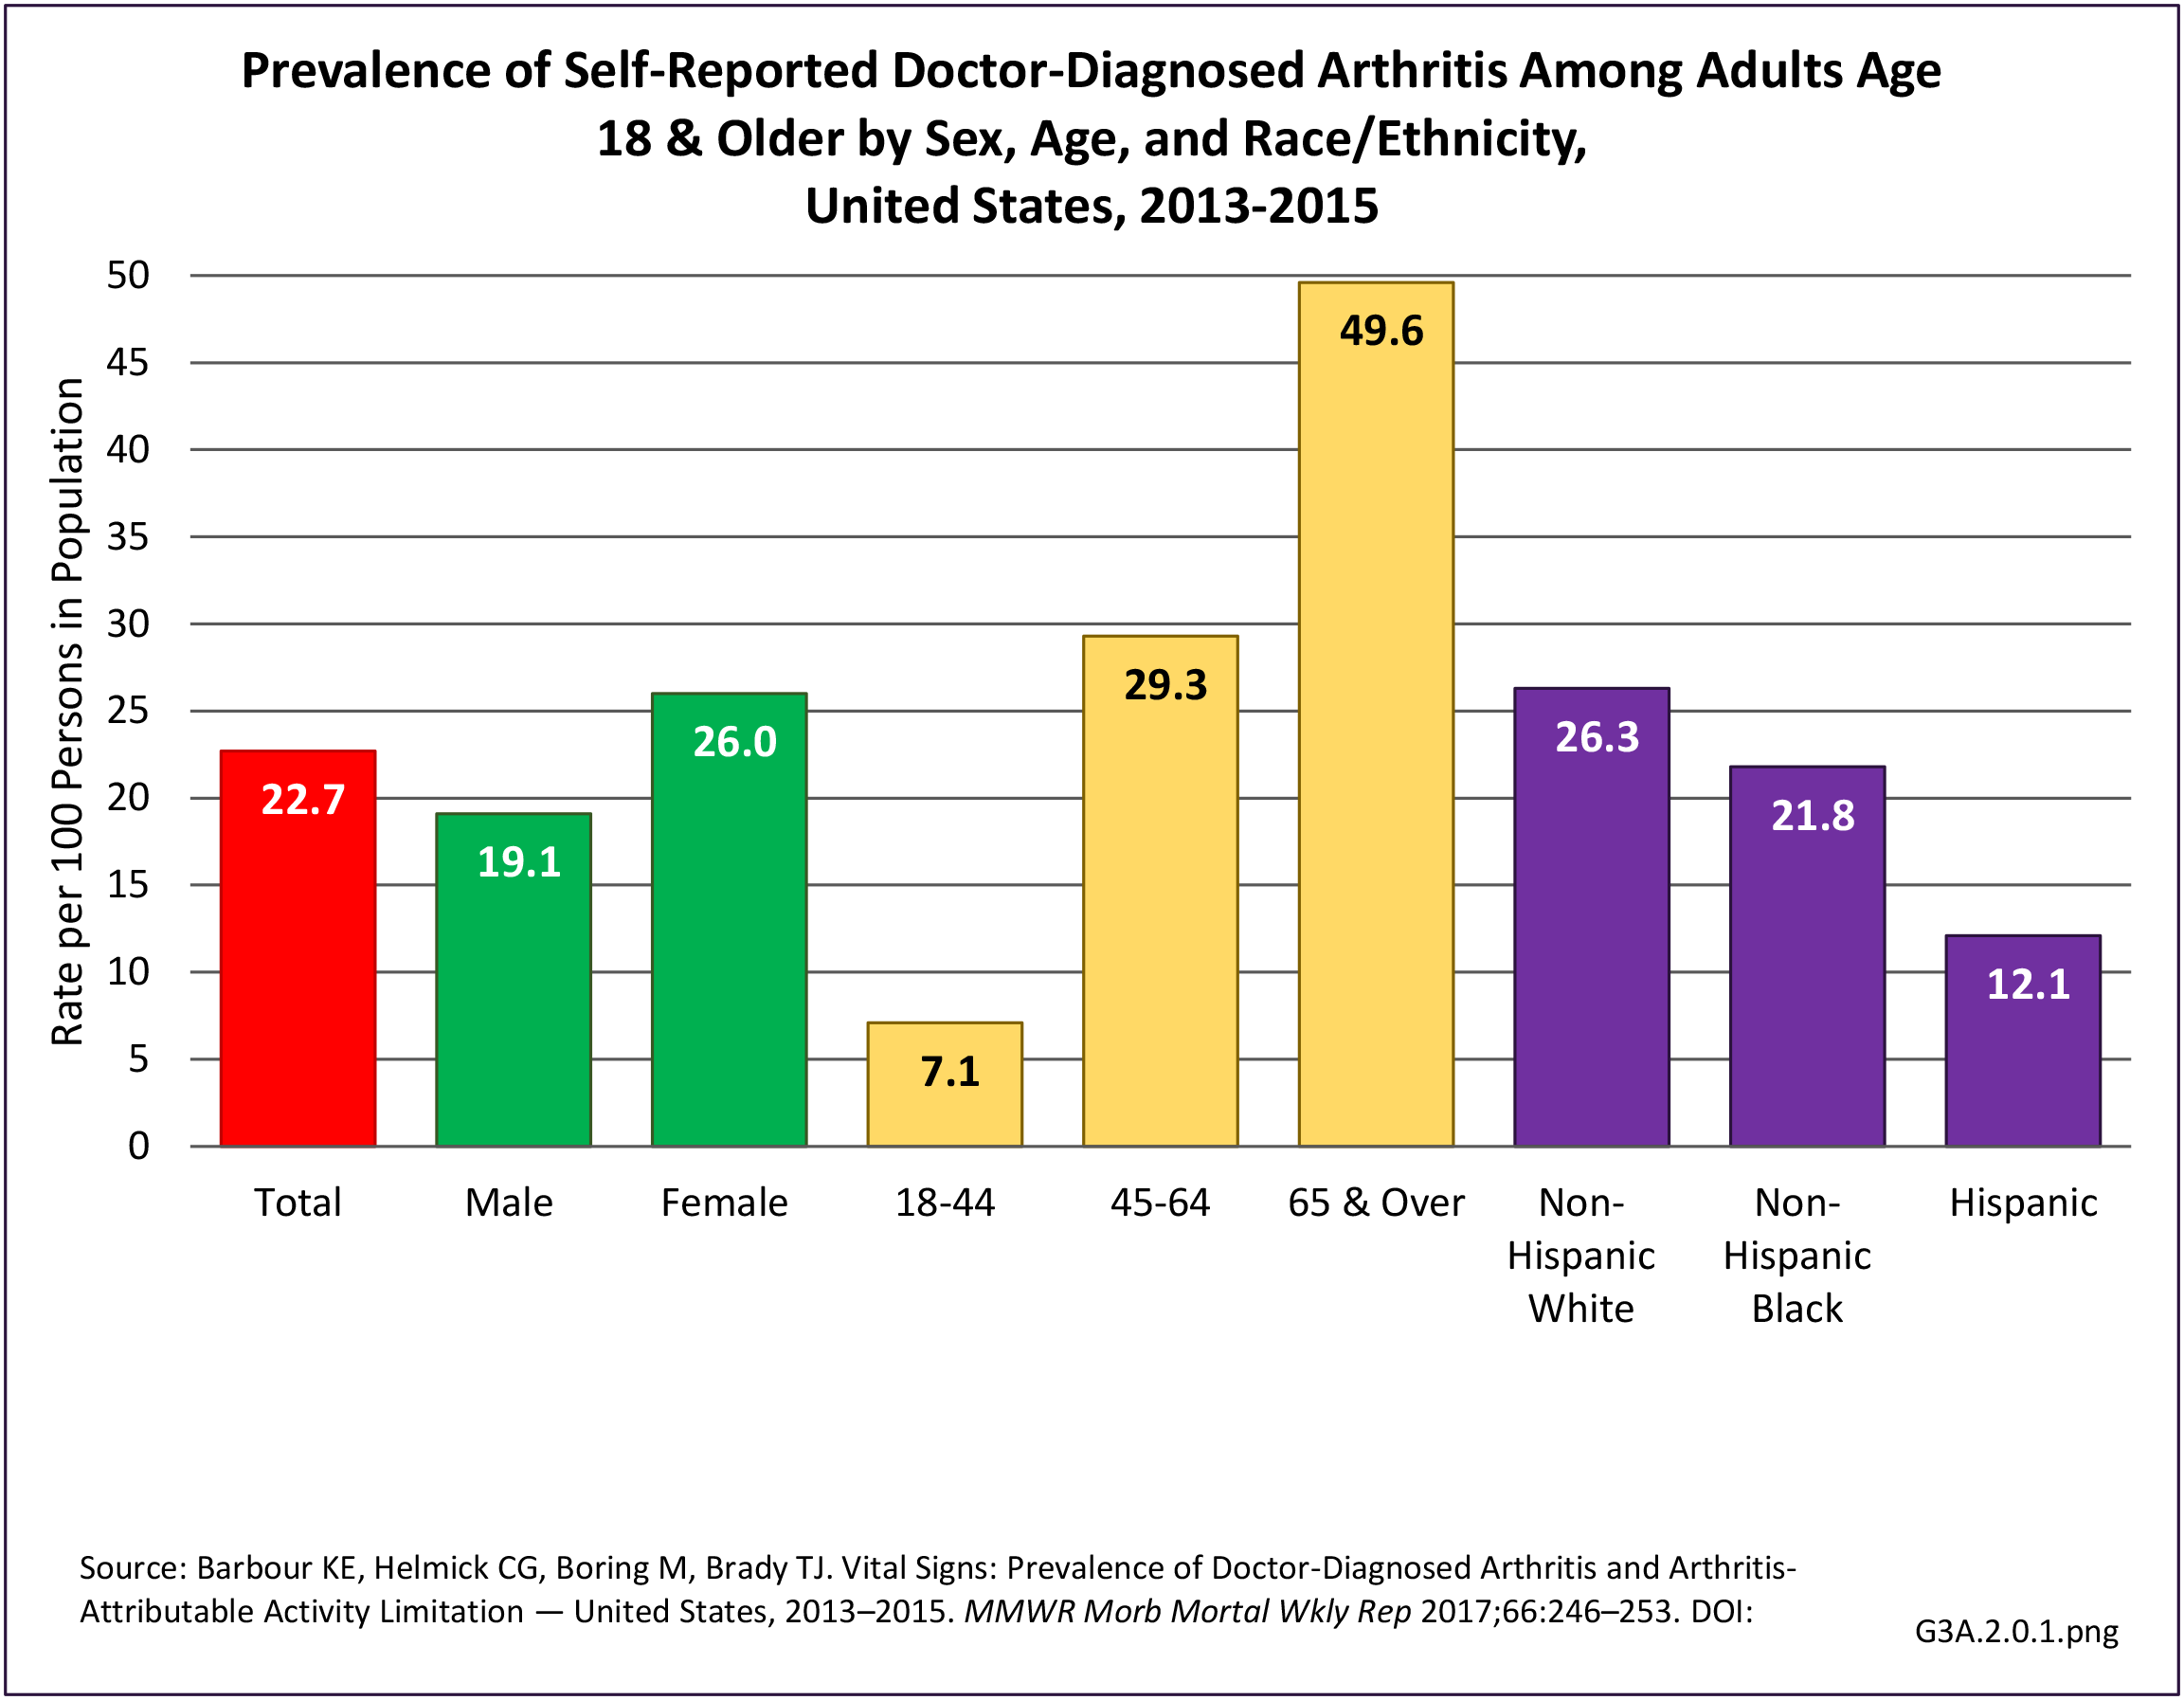
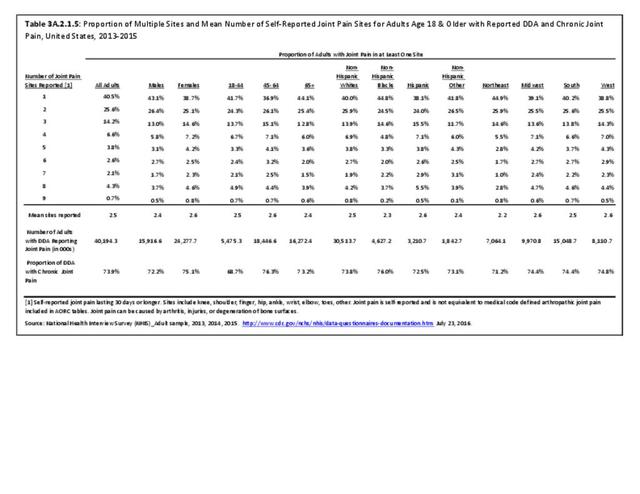
The CDC has also produced estimates of arthritis prevalence by race/ethnicity2 based on the NHIS 2013-2015 data. The lowest prevalence rate was found among non-Hispanic Asians (11.8%), with non-Hispanic multi-racial adults having the highest rate (25.2%). Among adults with arthritis, non-Hispanic Asians also reported the lowest prevalence of arthritis-attributable activity limitations (37.6%), while American Indian/Alaska Natives reported the highest prevalence of limitations (51.5%).

Access to Care
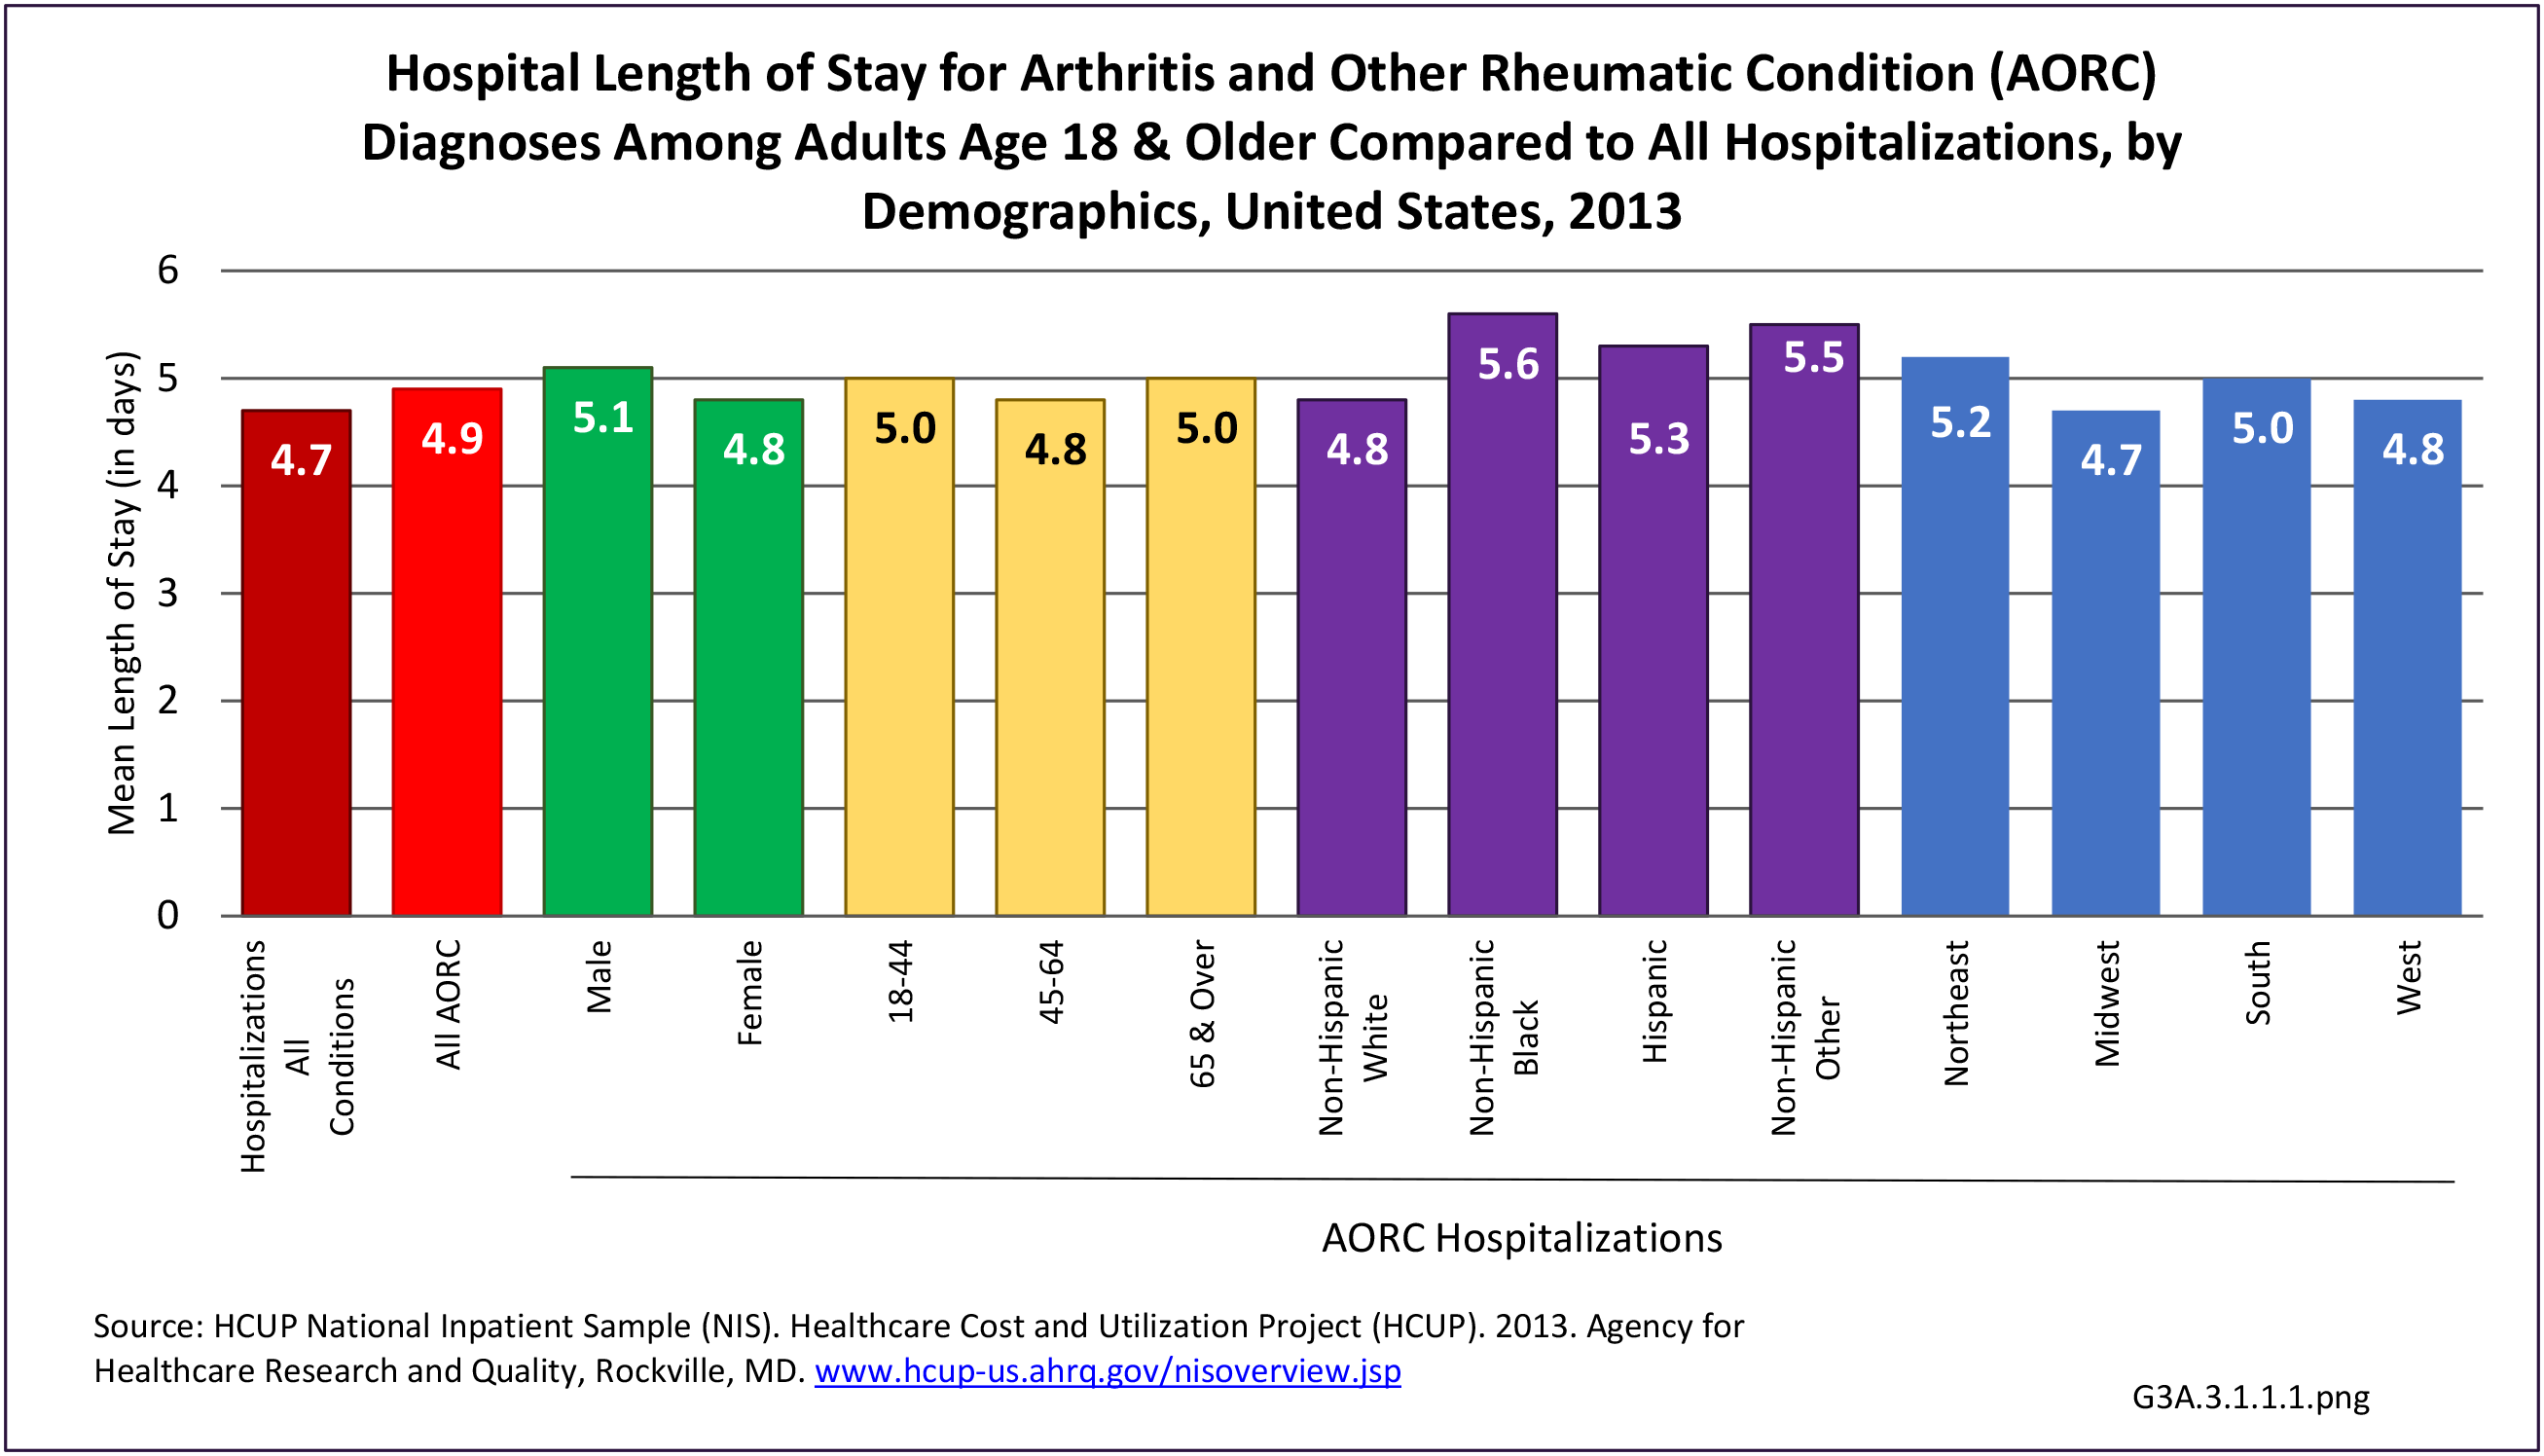
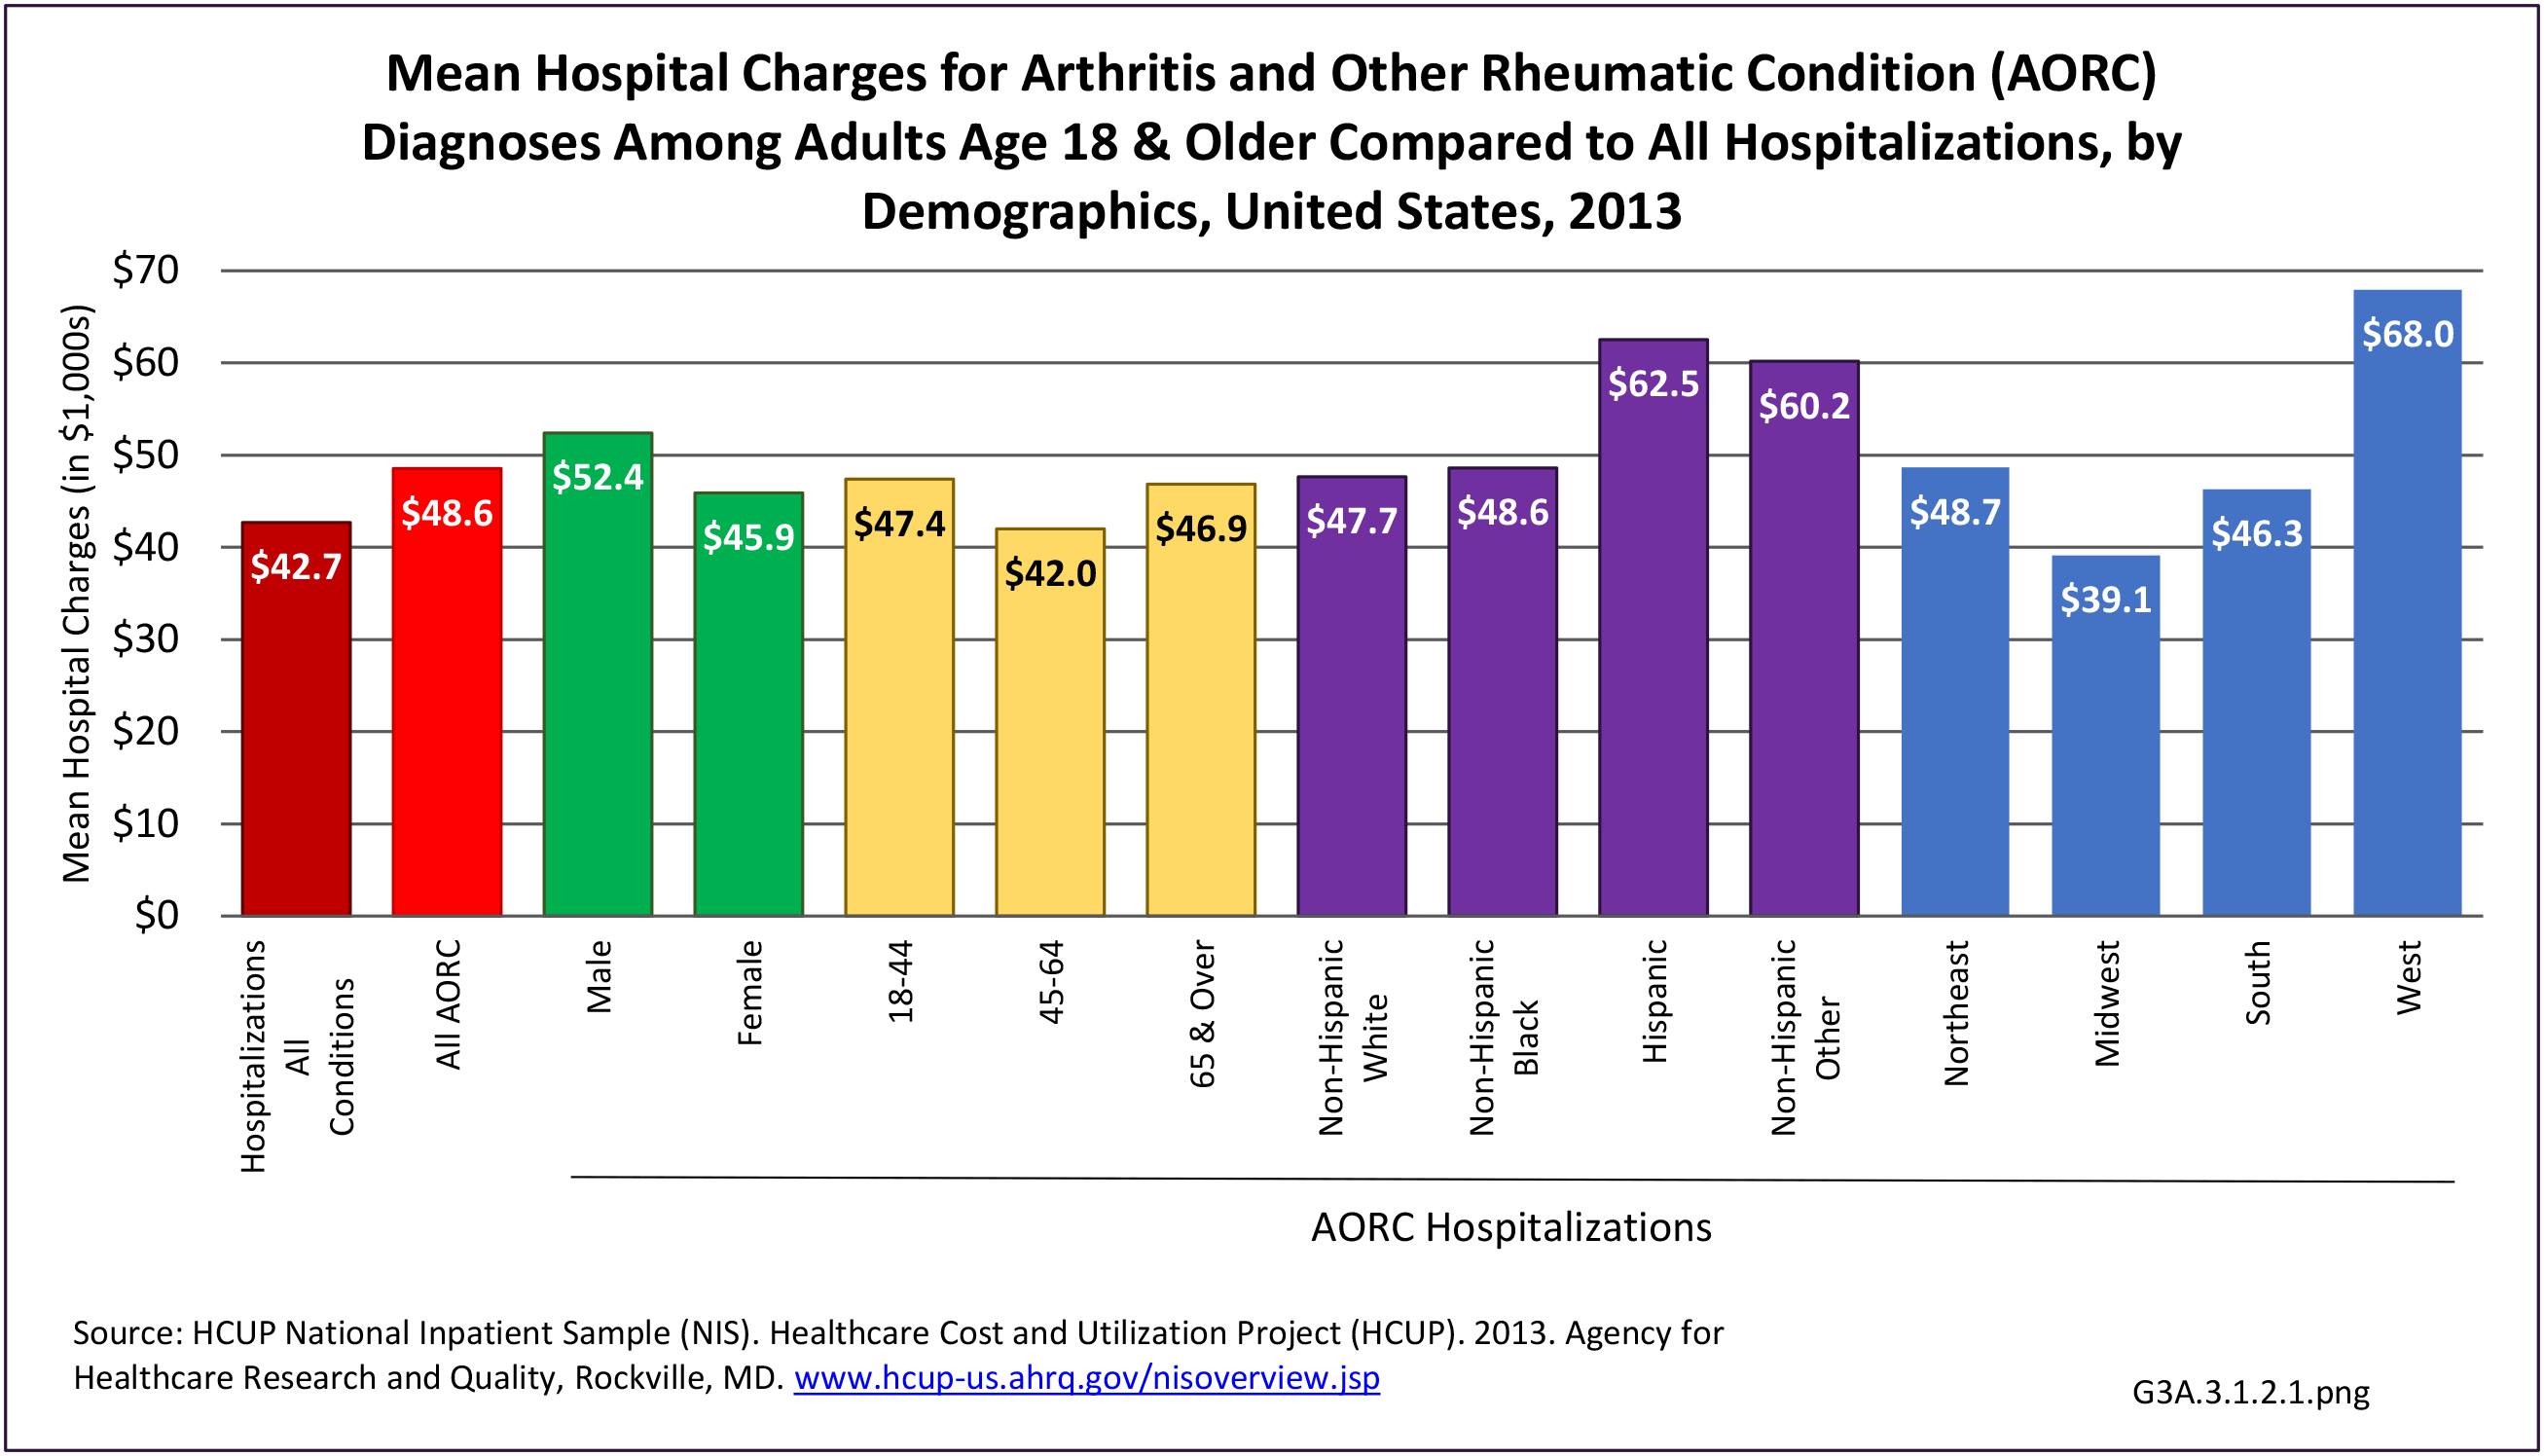
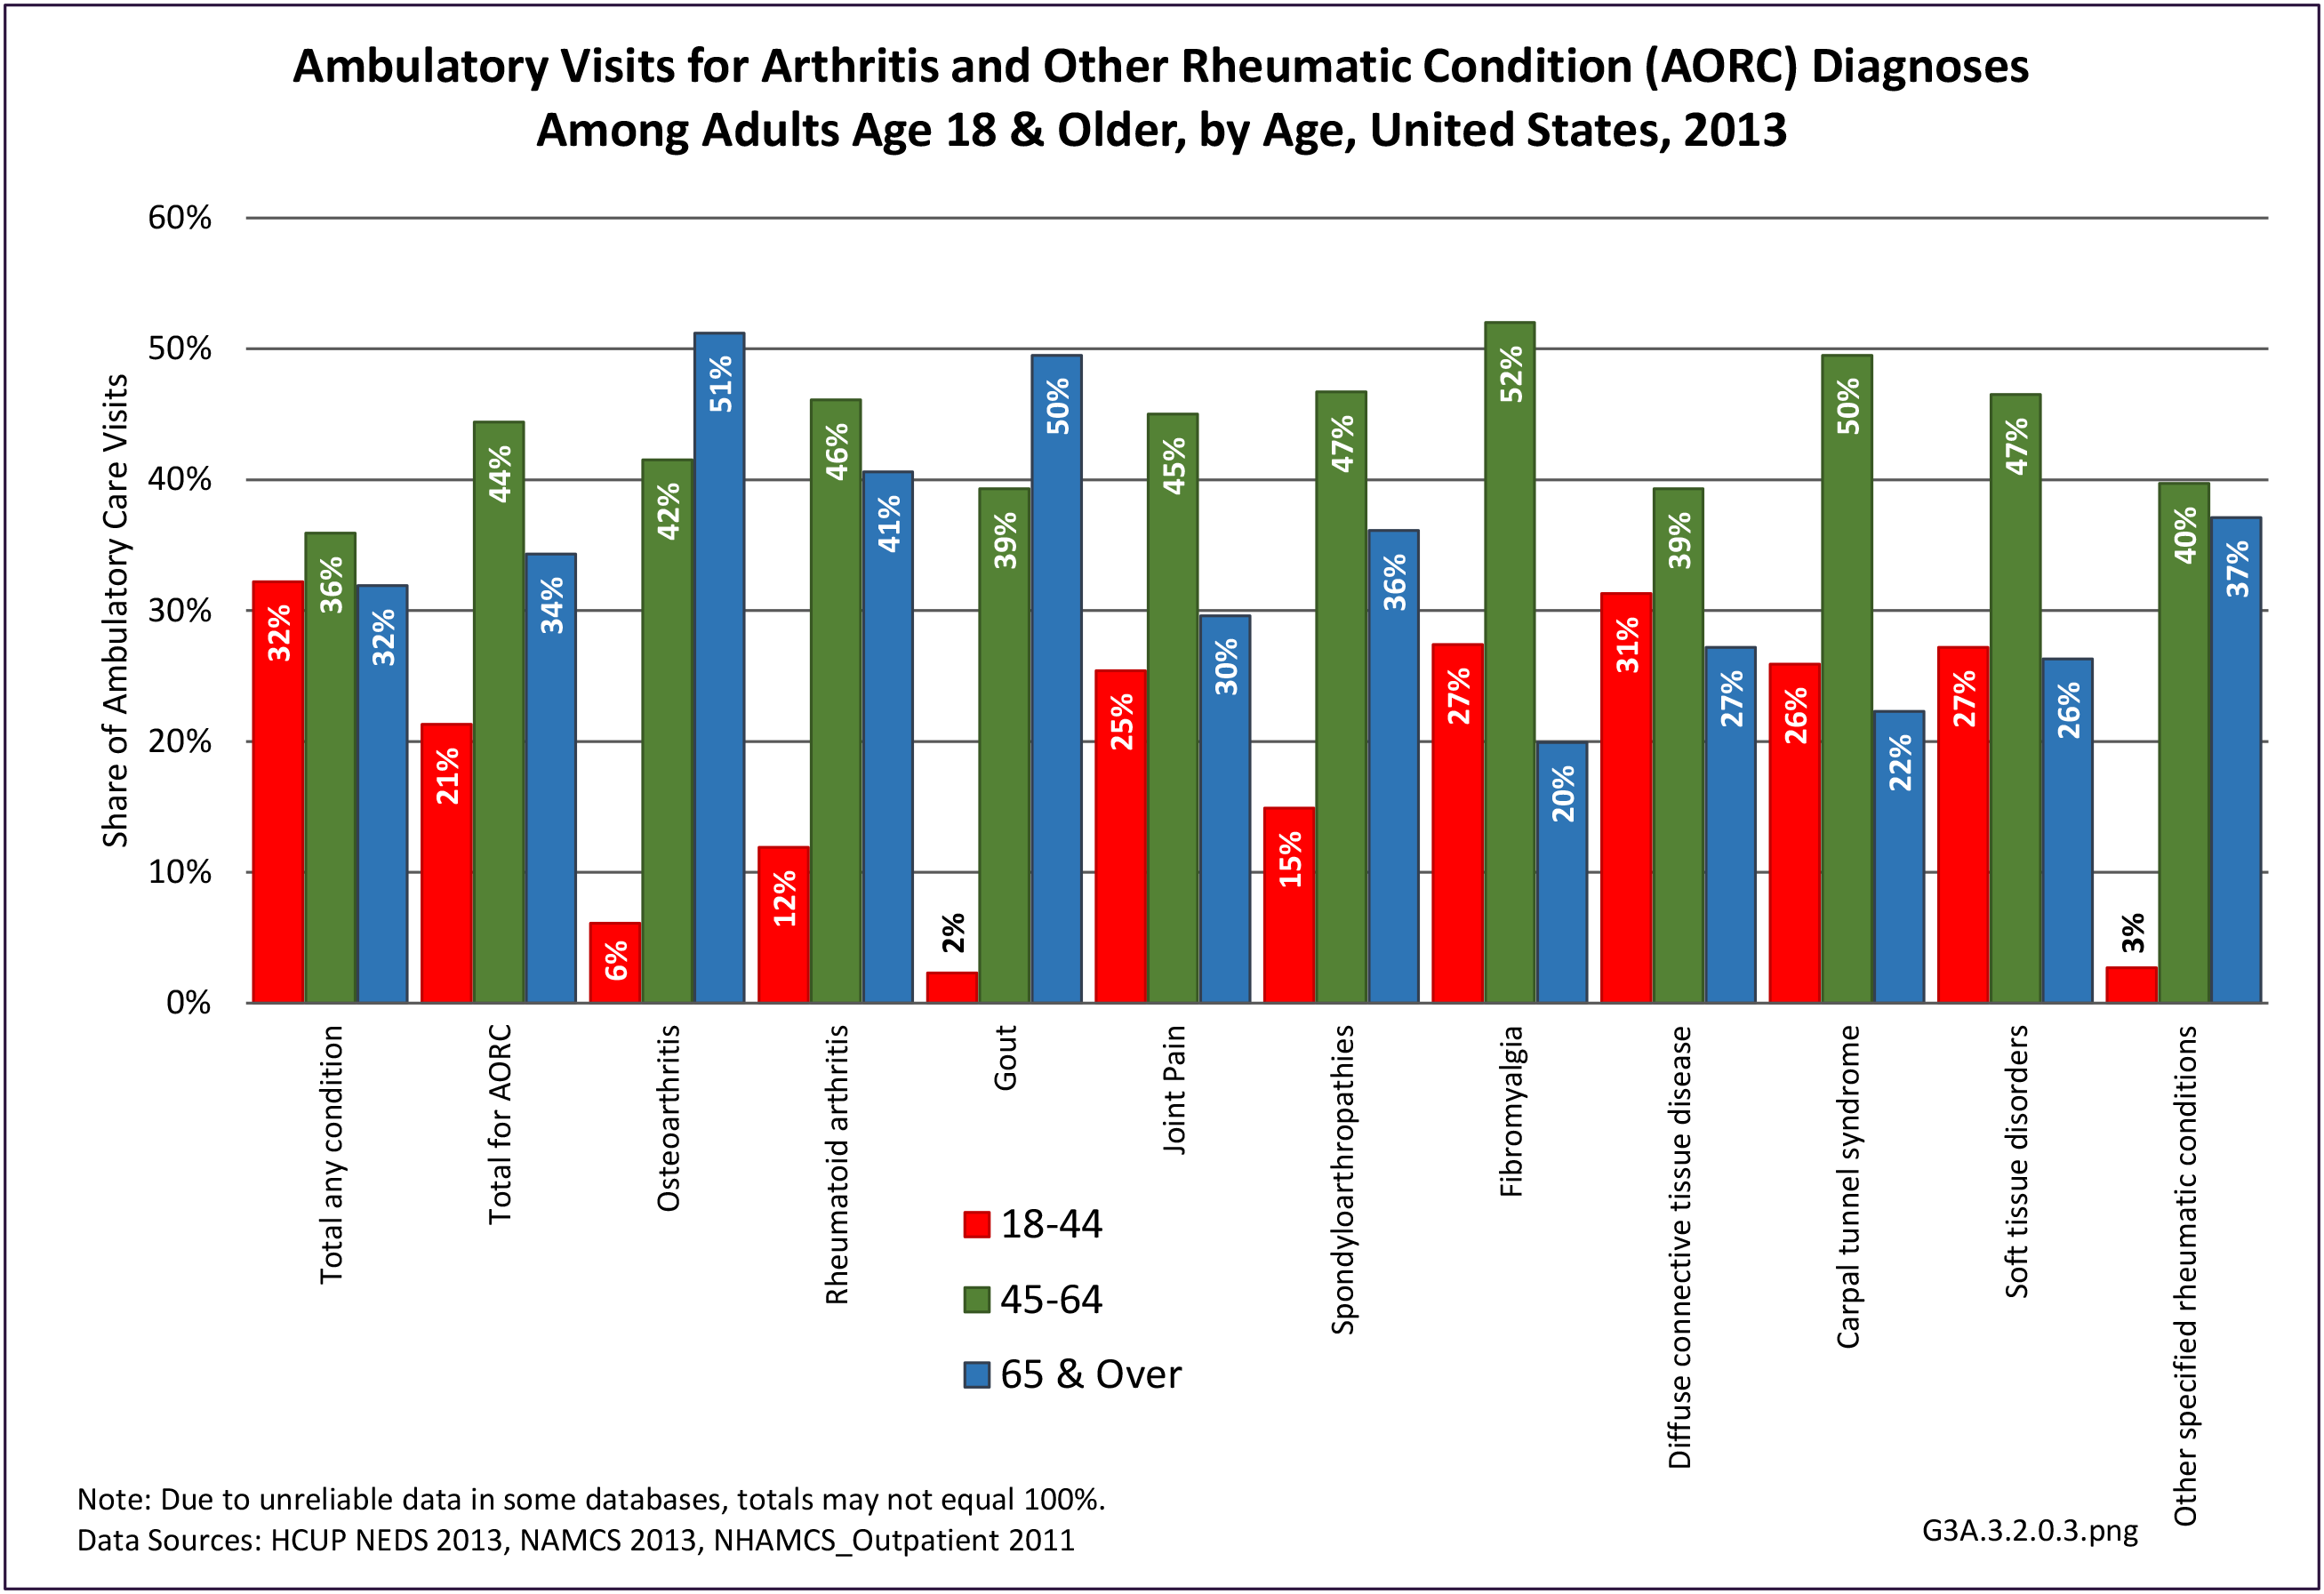
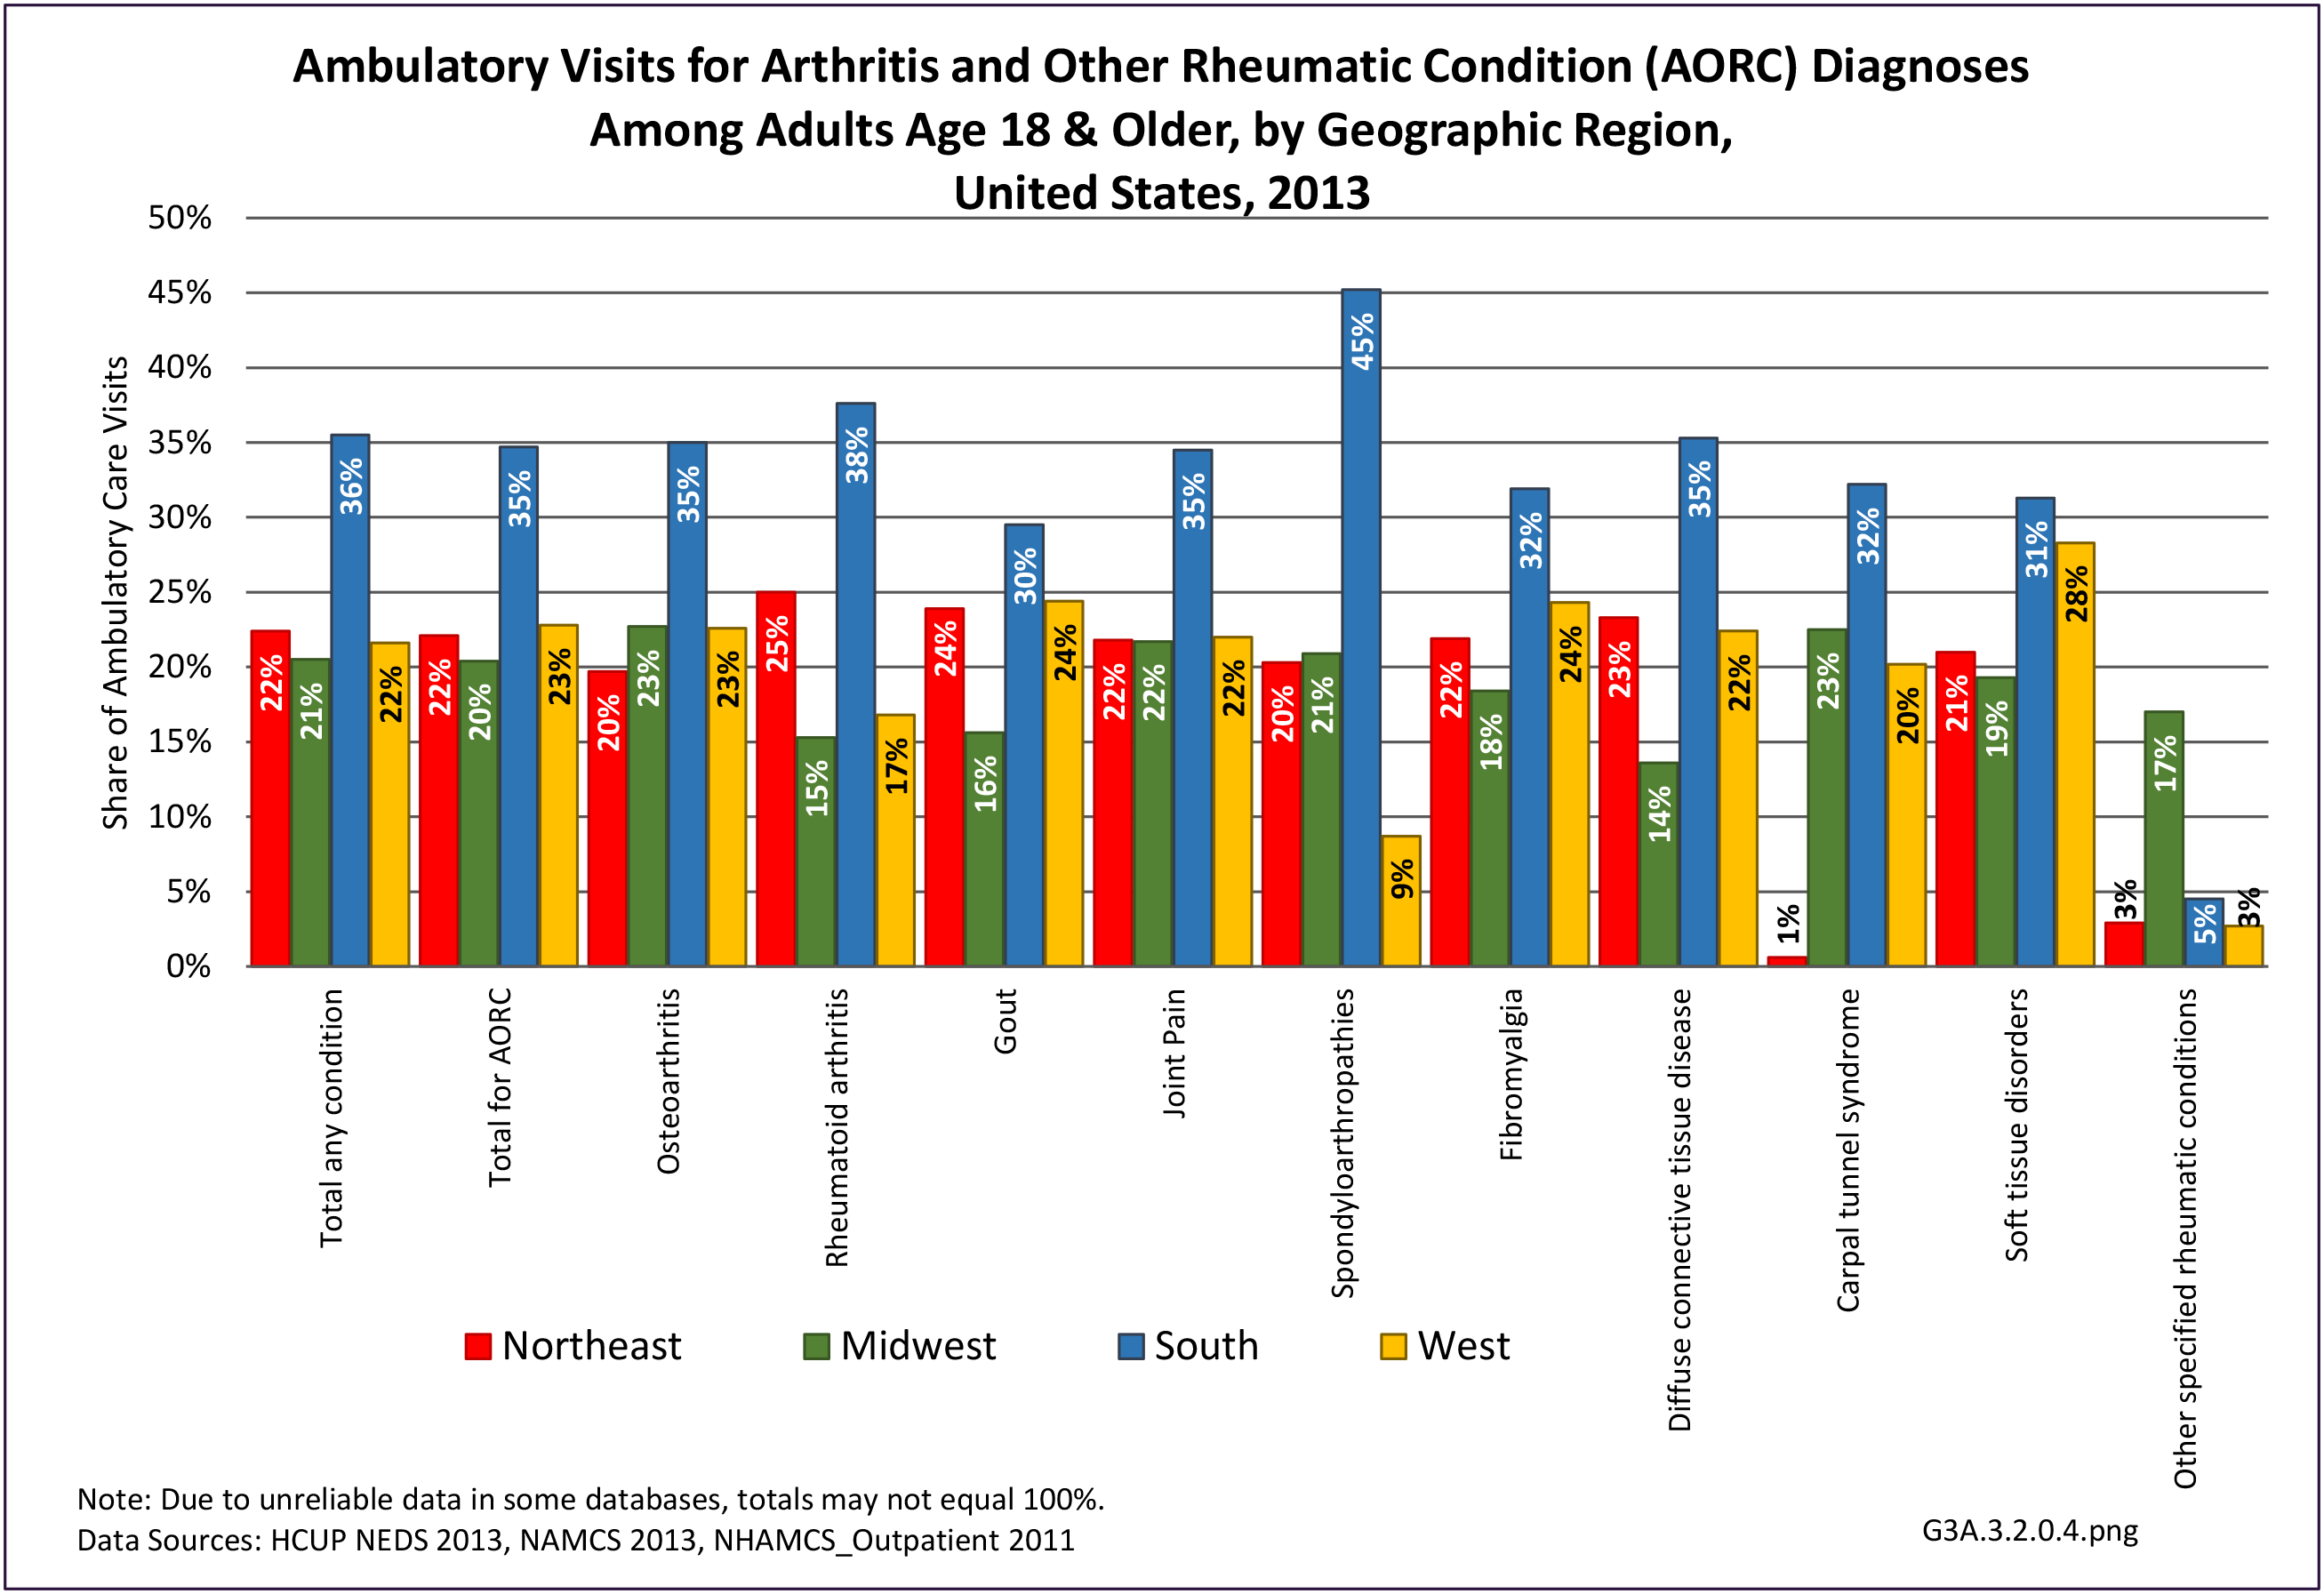
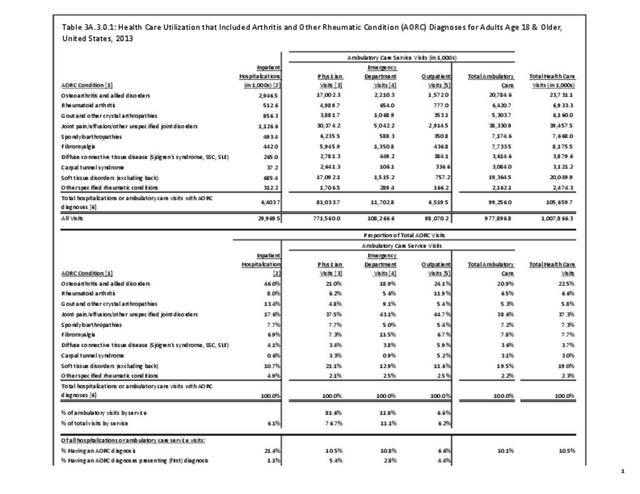
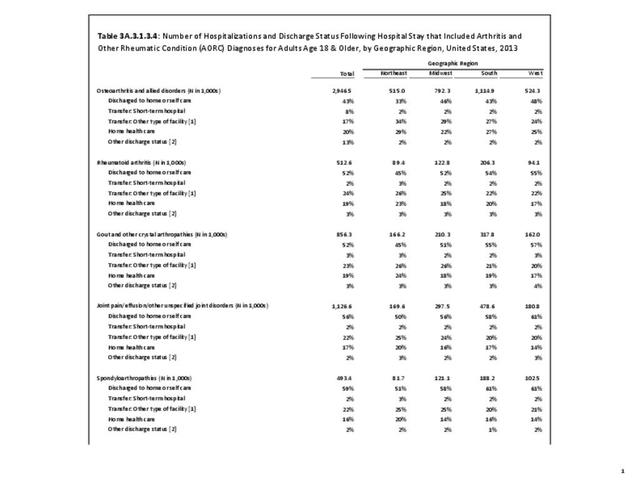
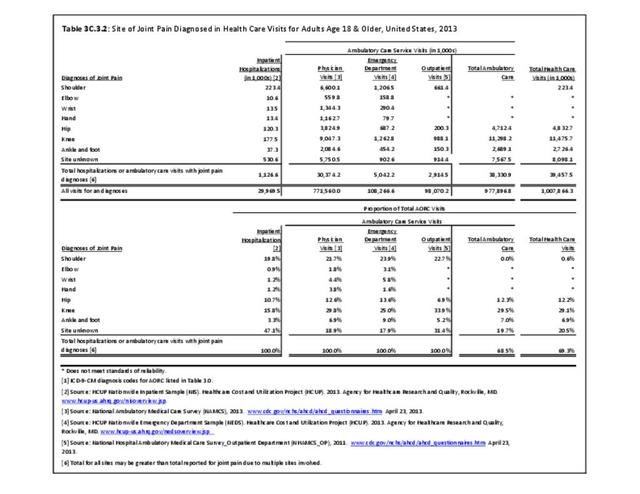
While medical professionals in many specialities and with a range of credentials treat patients with arthritis, those specializing in rheumatology are often at the frontline. A recently published workforce study by the American College of Rheumatology highlighted significant disparities in access to care within geographic regions of the US. Their findings showed access to care (defined as the ratio of adult rheumatology physicians to adult population) to be easiest in the Northeast (26,677 ratio) and most difficult in the Southern states (66,163 in the Southwest and 60,087 in the Southeast). This compares to a national average of rheumatologists per population of 41,658.3 Comparing this finding to the number of hospitalization and ambulatory healthcare visits, the highest number of visits, or need for care, was in the South. Furthermore, the study cited above reported the highest arthritis prevalence in the South.
In addition to regional differences, access to care based on population size is also the norm, as patients in areas with less than 50,000 population often must travel 200 or more miles to see a rheumatologist. The ratio of pediatric rheumatologists is much higher (229,442 children/physician), and it is estimated that only one-quarter of those aged 18 or younger with juvenile arthritis are currently able to see a rheumatologist.3
- 1. Barbour KE, Moss S, Croft JB, et al. Geographic variations in arthritis prevalence, health-related characteristics, and management — United States, 2015. MMWR Surveill Summ 2018;67(No. SS-4):1–28. DOI: http://dx.doi.org/10.15585/mmwr.ss6704a1.
- 2. Barbour KE, Helmick CG, Boring M, Brady TJ. Vital signs: prevalence of doctor-diagnosed arthritis and arthritis-attributable activity limitation — United States, 2013–2015. Morb Mortal Wkly Rep. 2017;66:246–253. DOI: http://dx.doi.org/10.15585/mmwr.mm6609e1.
- 3. a. b. American College of Rheumatology. 2015 Workforce study of rheumatology specialists in the United States. Atlanta, GA. 2015. https://www.rheumatology.org/portals/0/files/ACR-Workforce-Study-2015.pdf Accessed March 26, 2018.
Edition:
- Fourth Edition