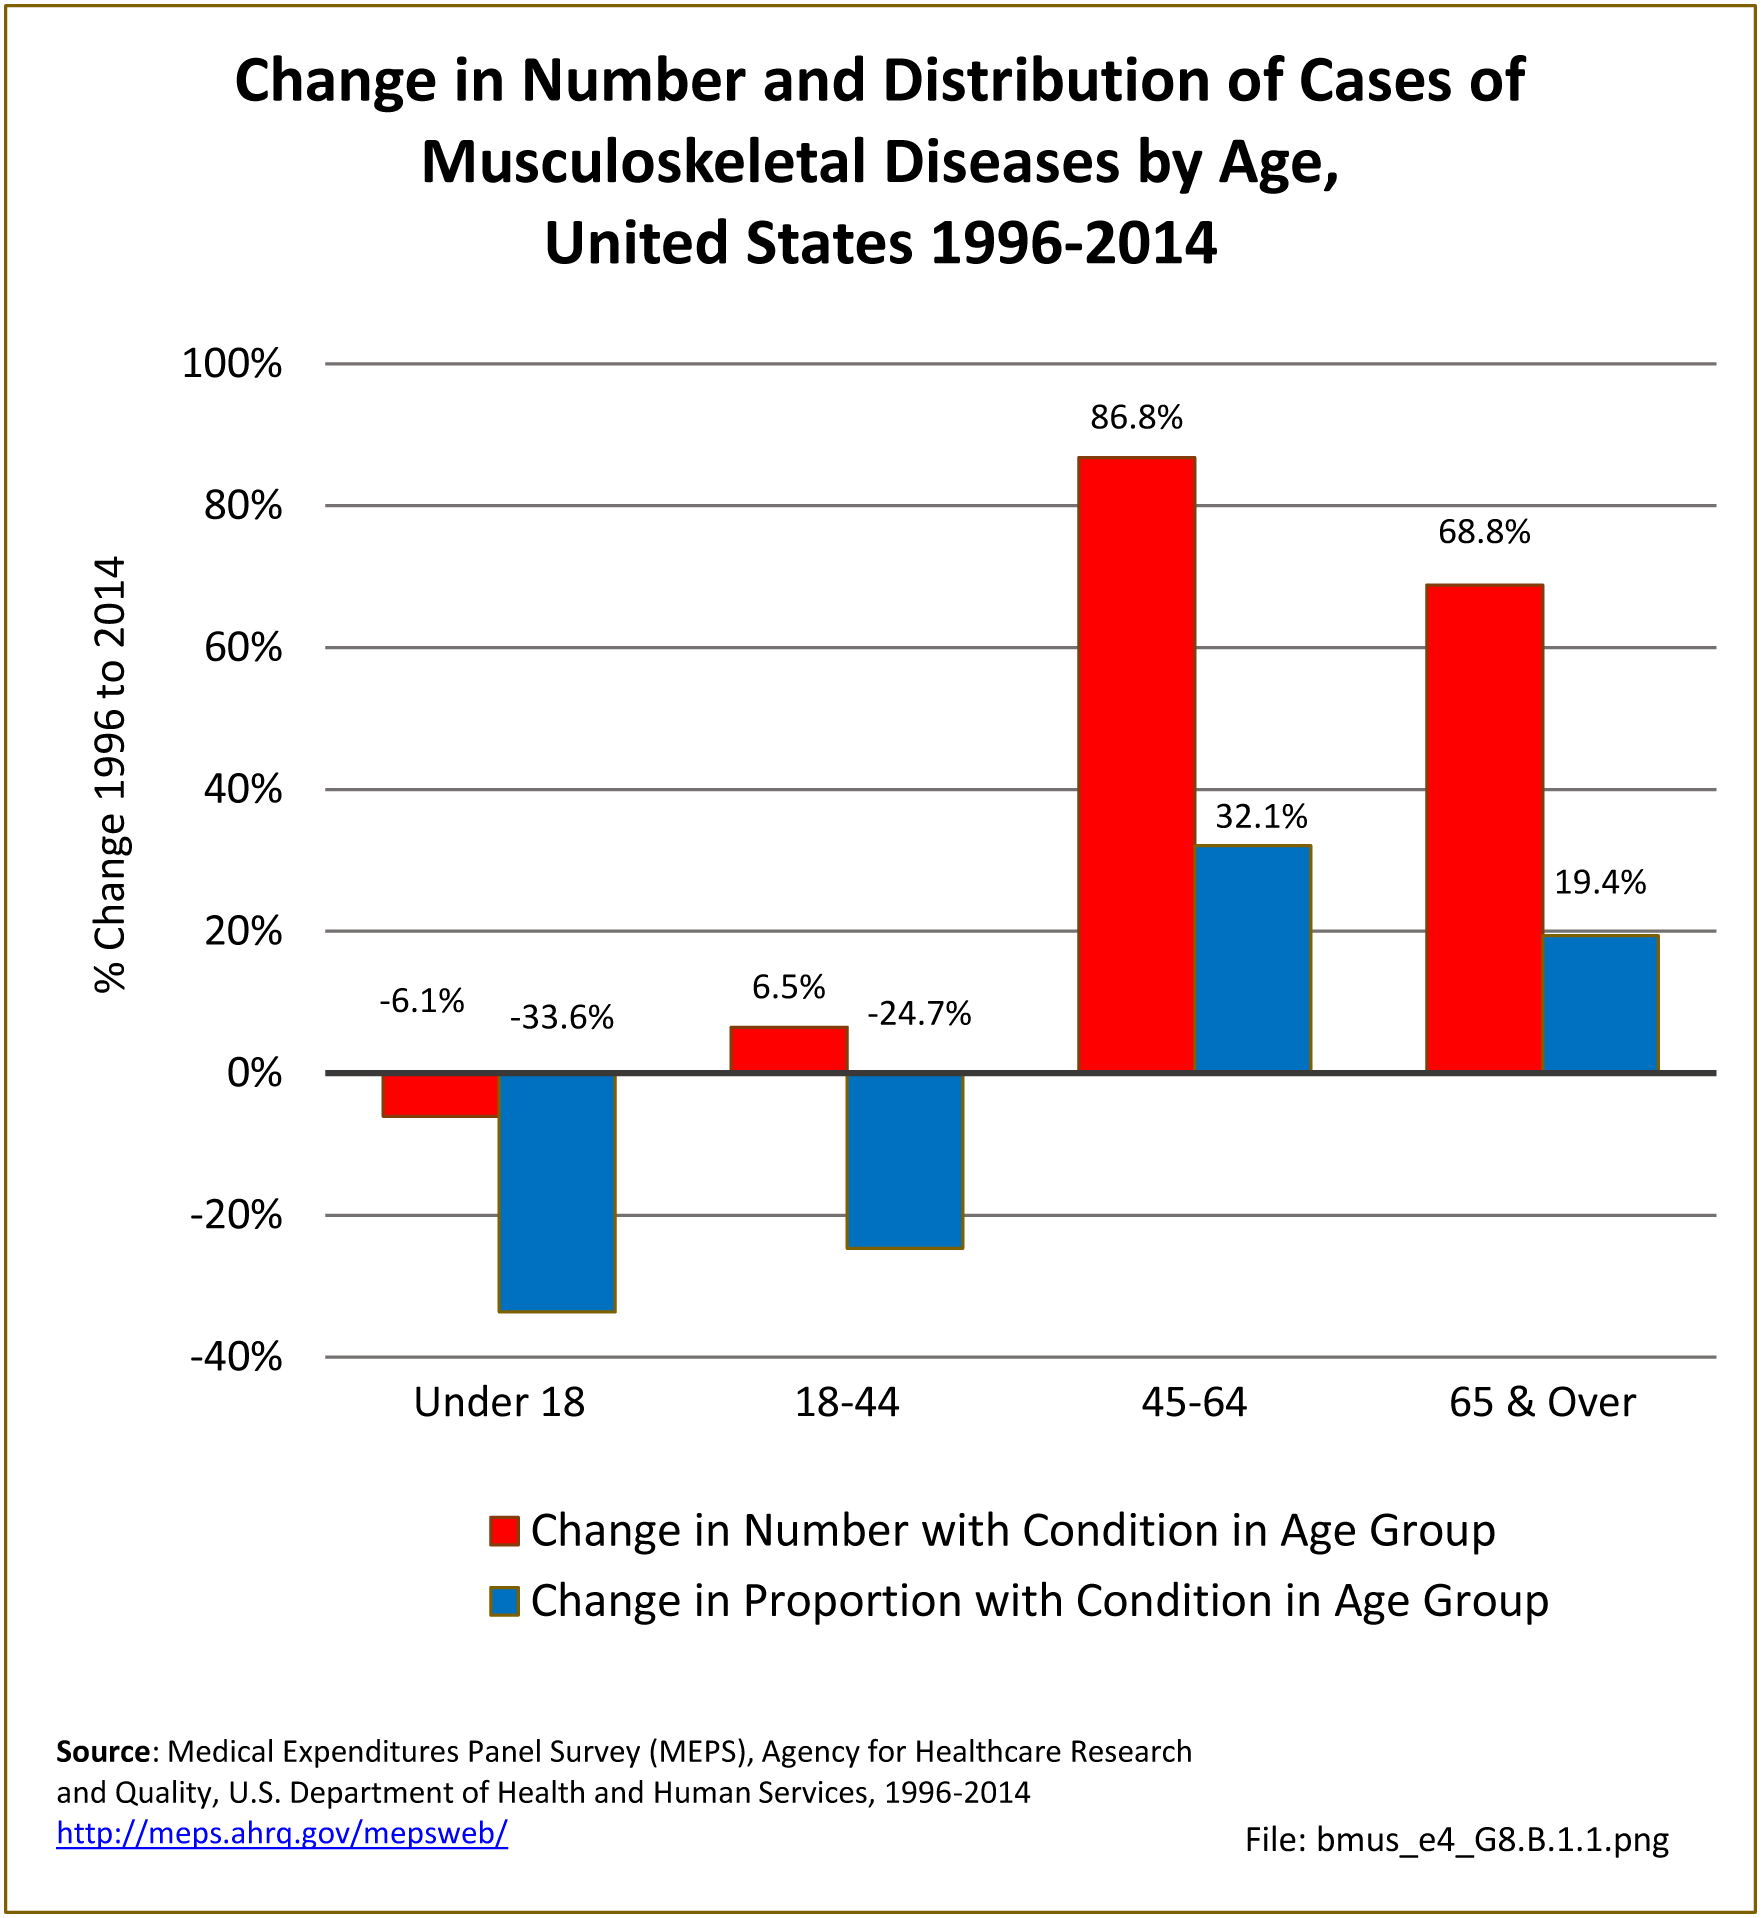
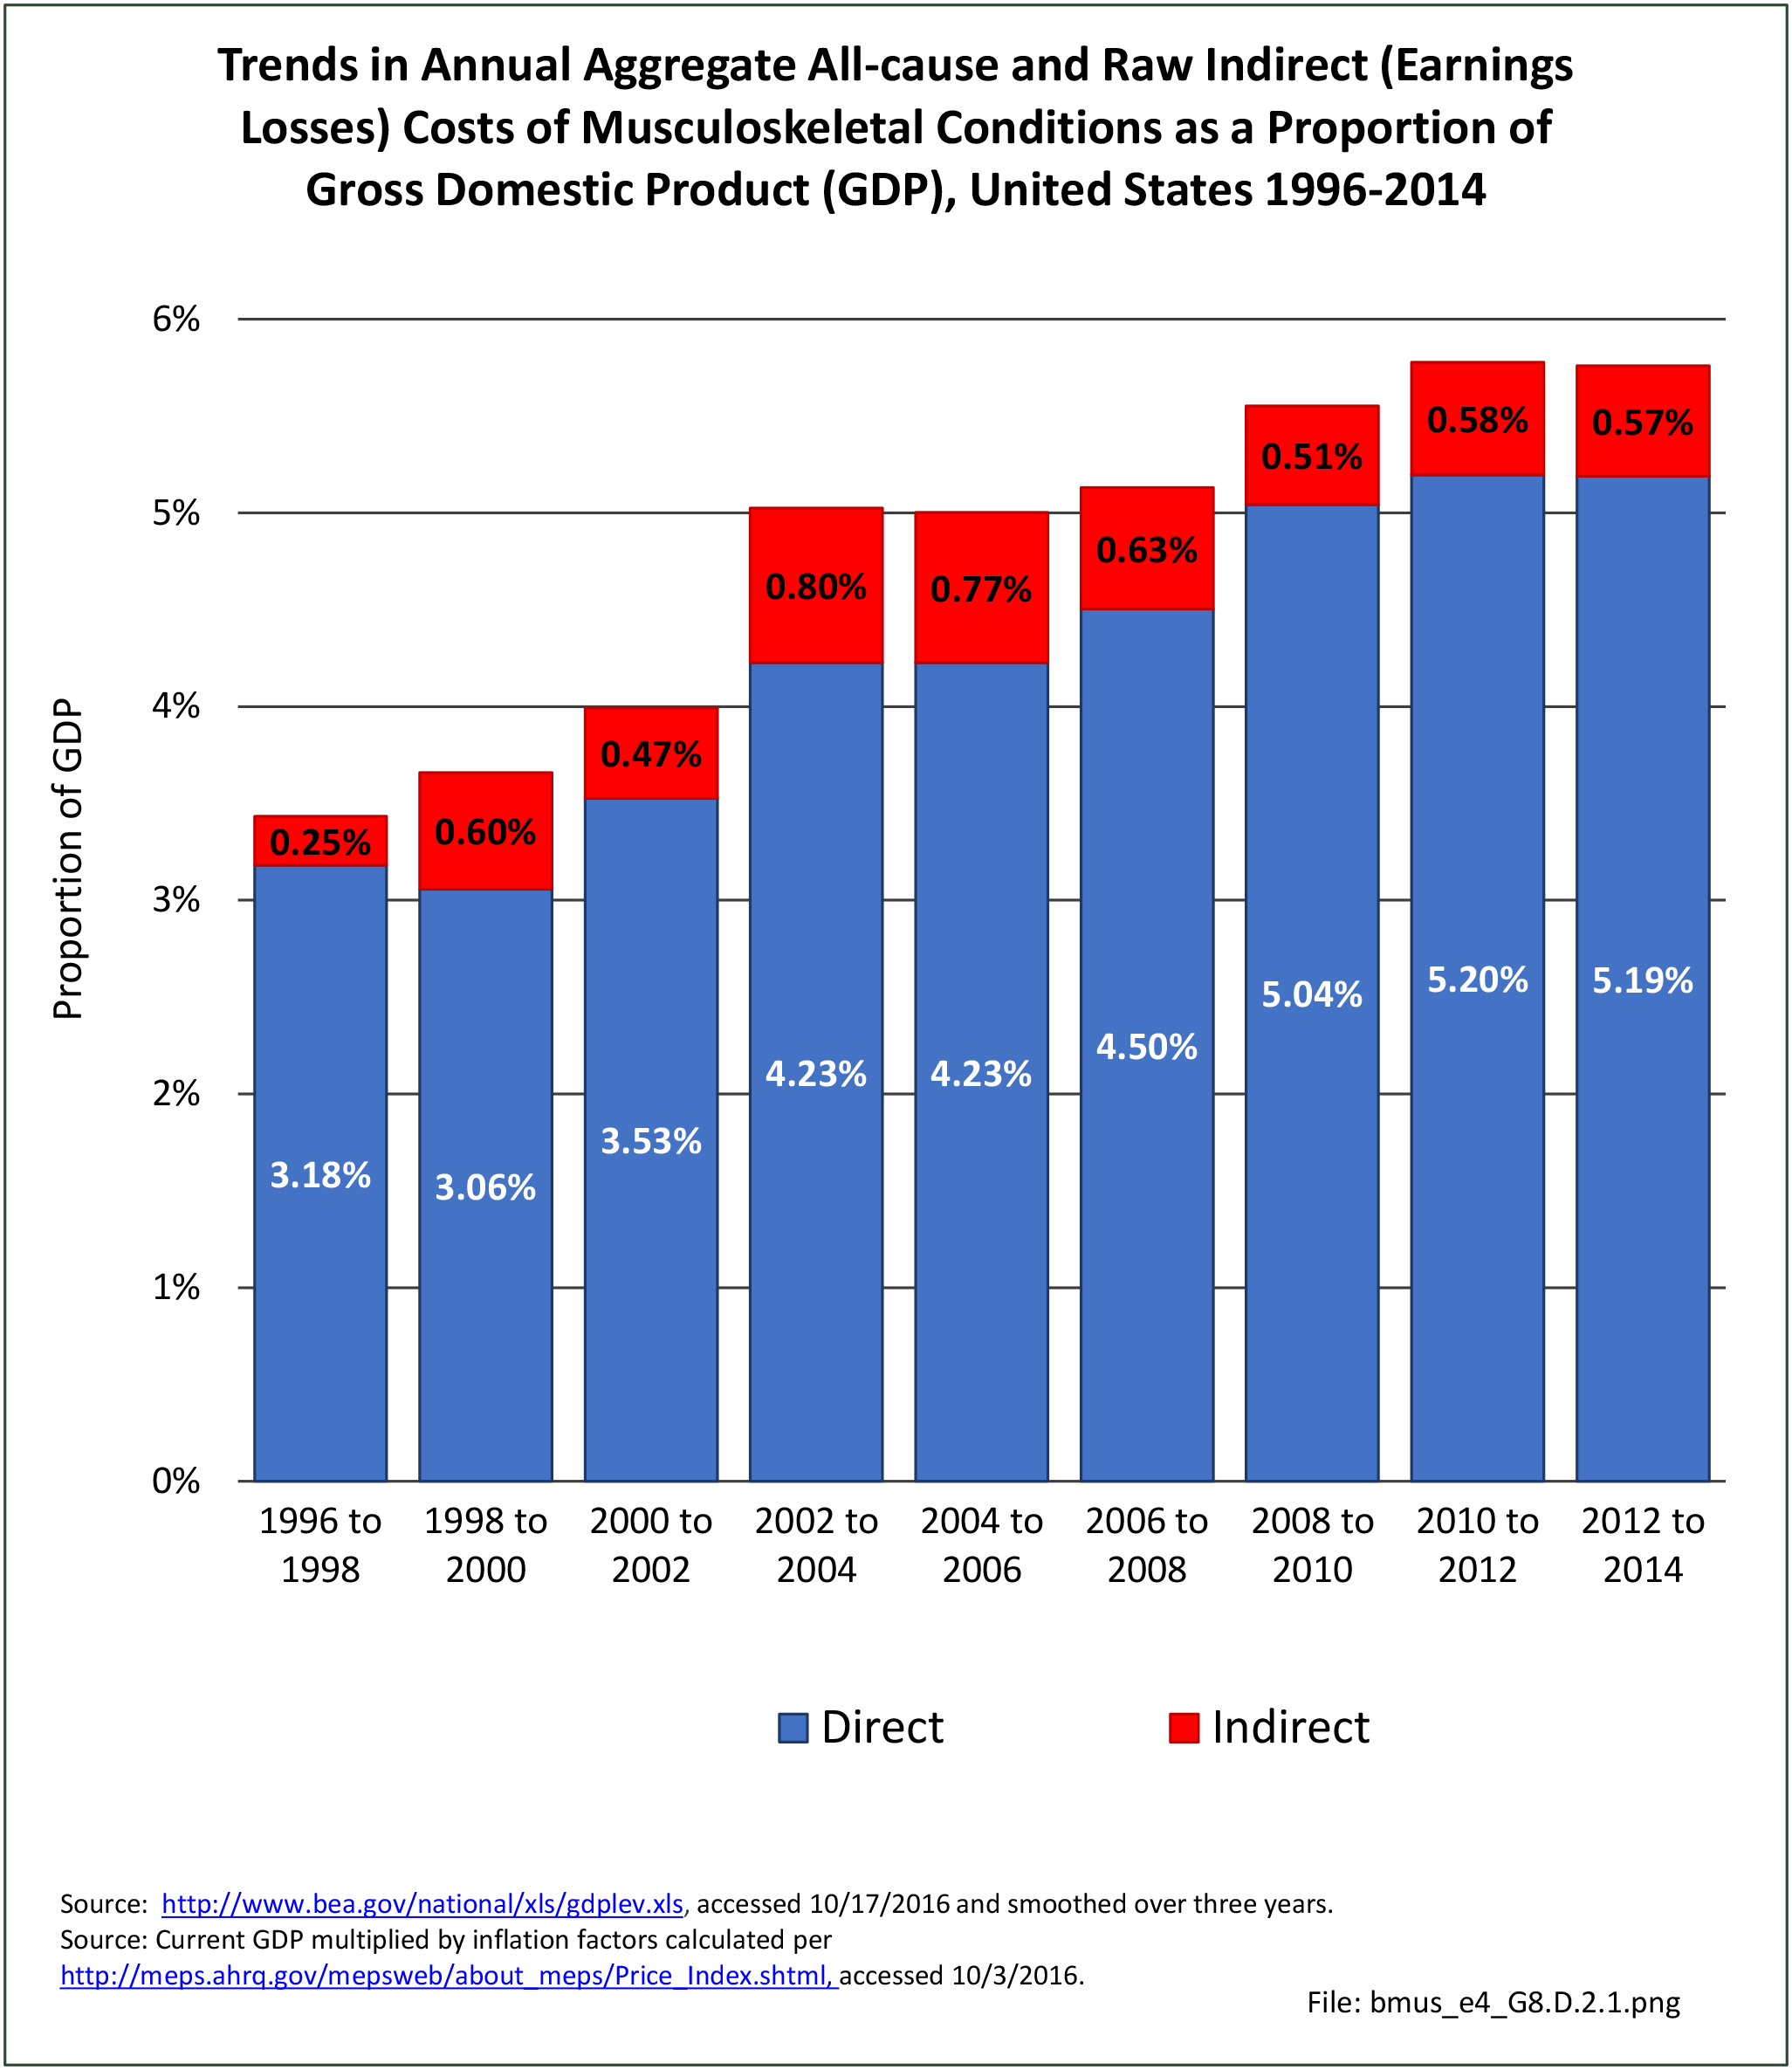
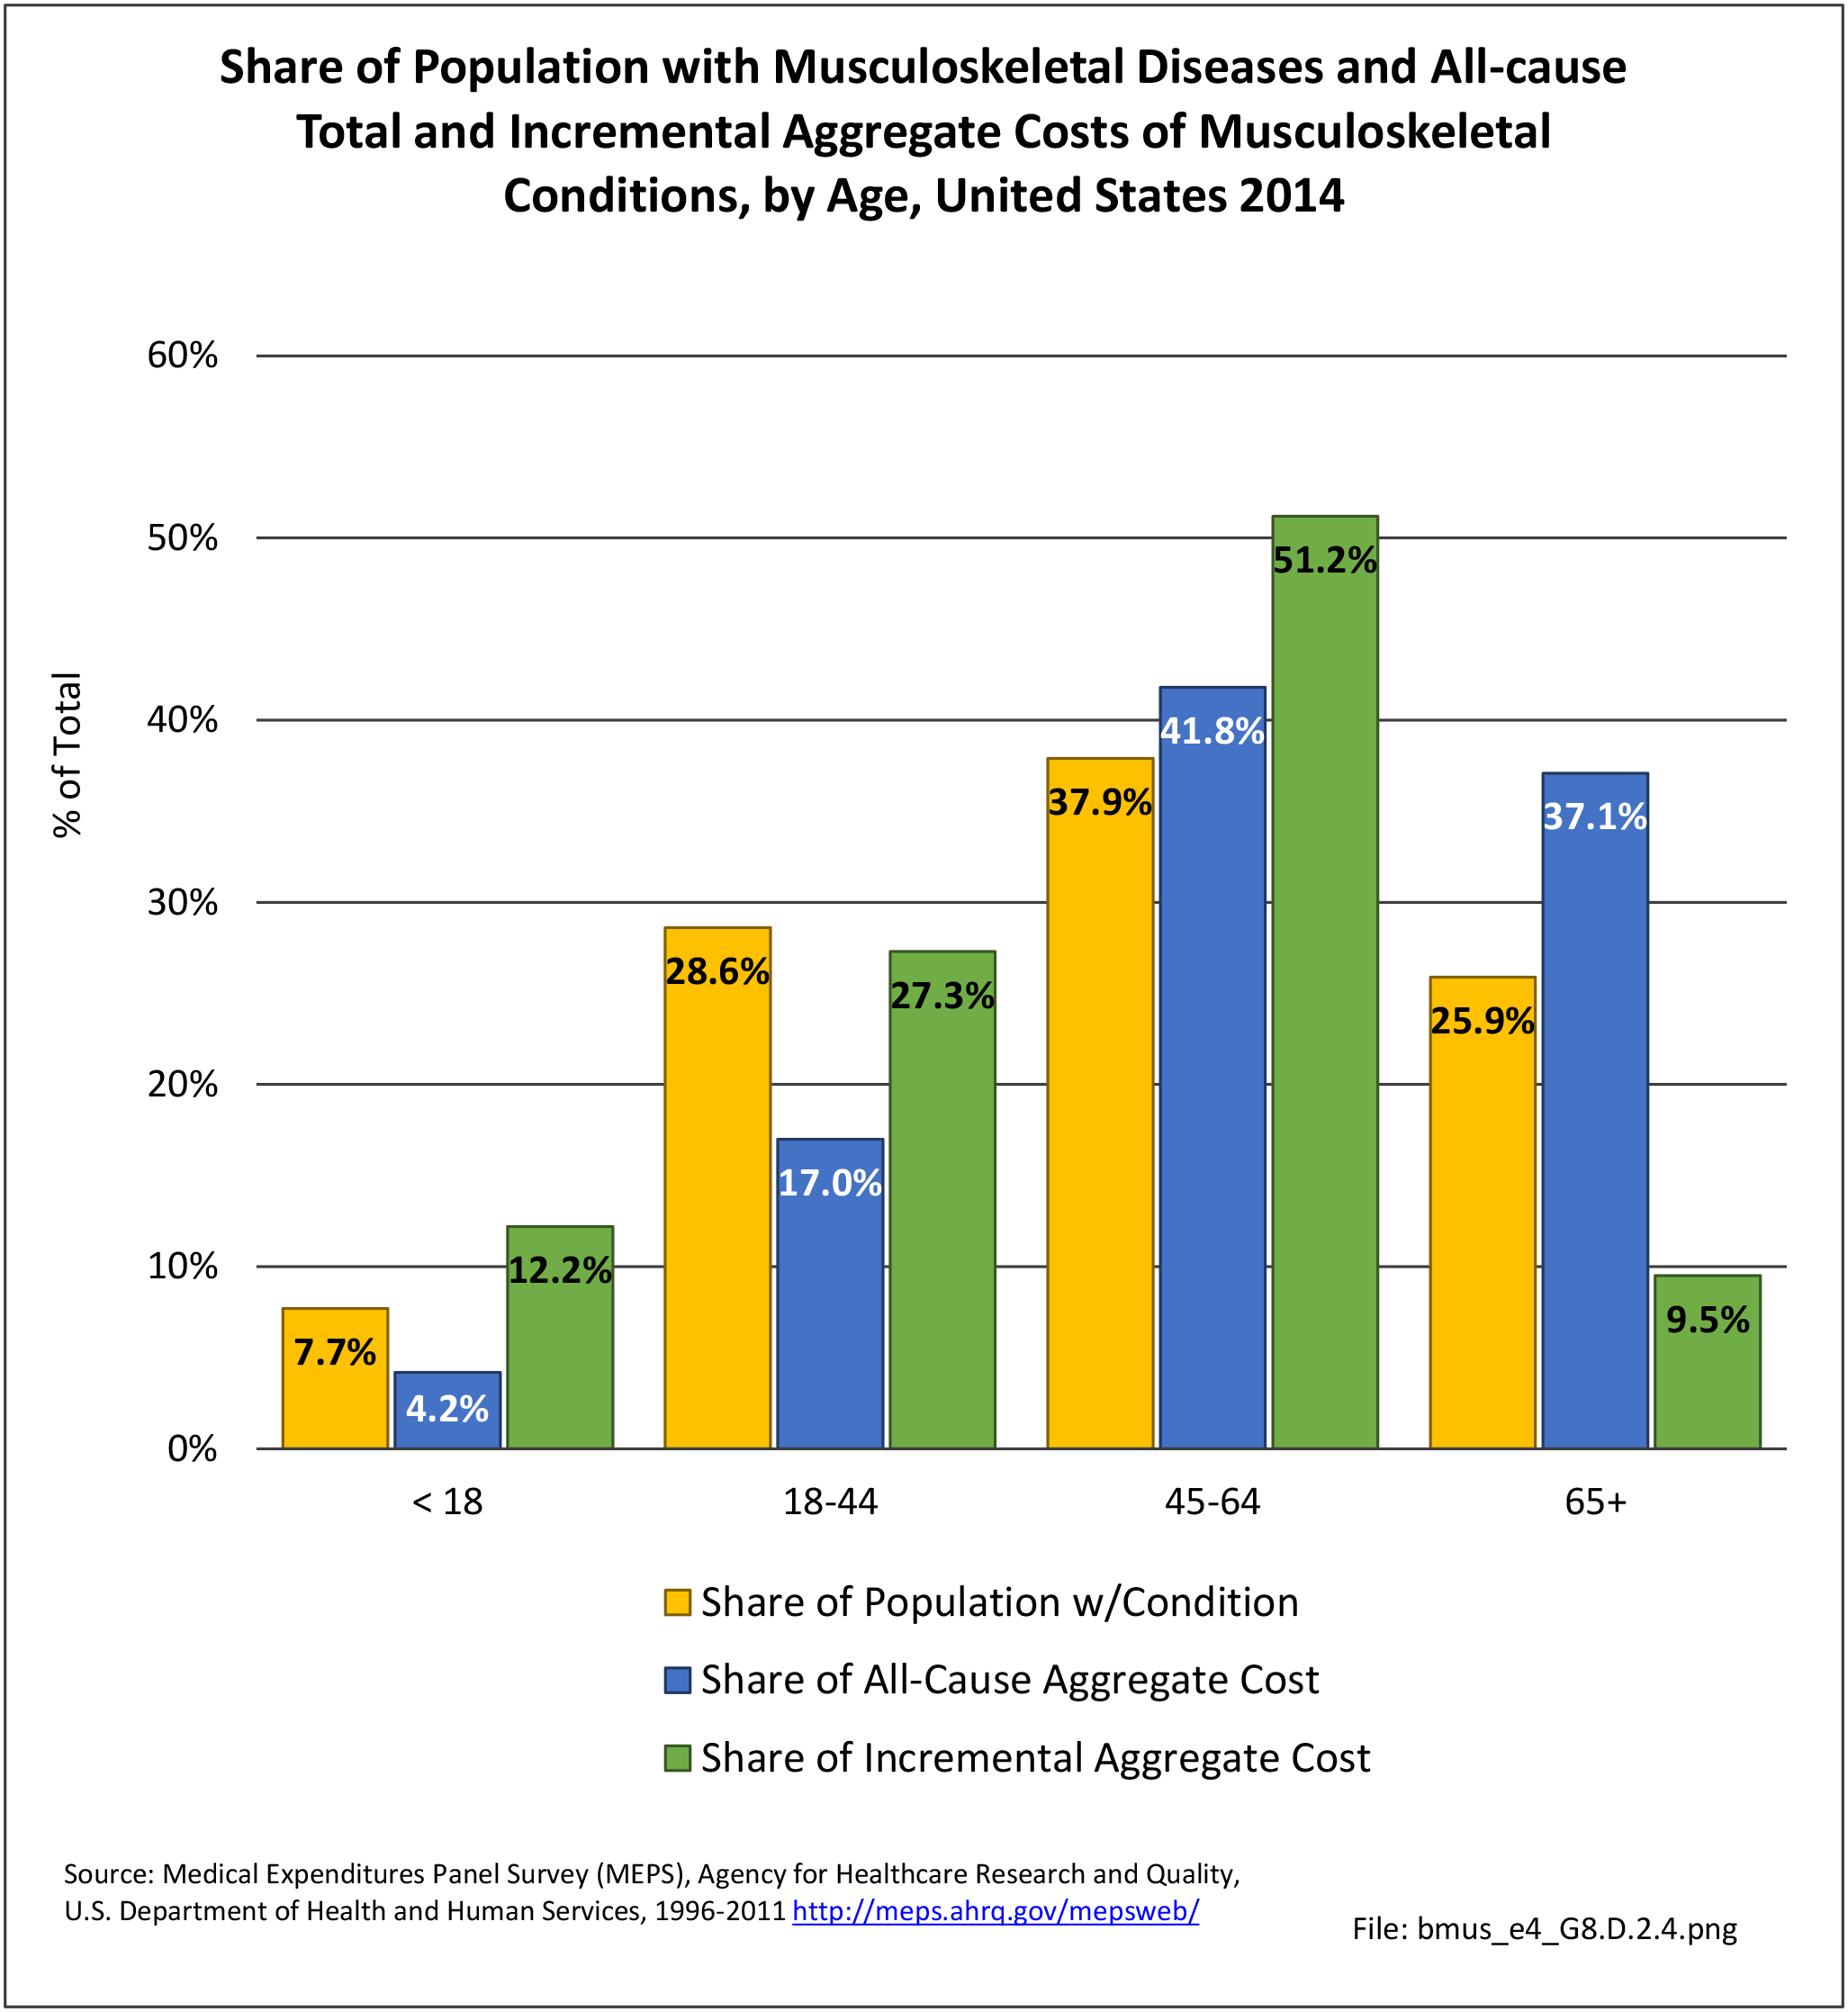
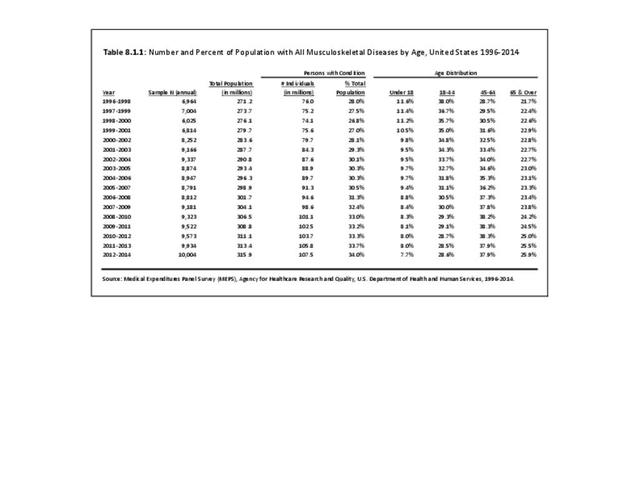
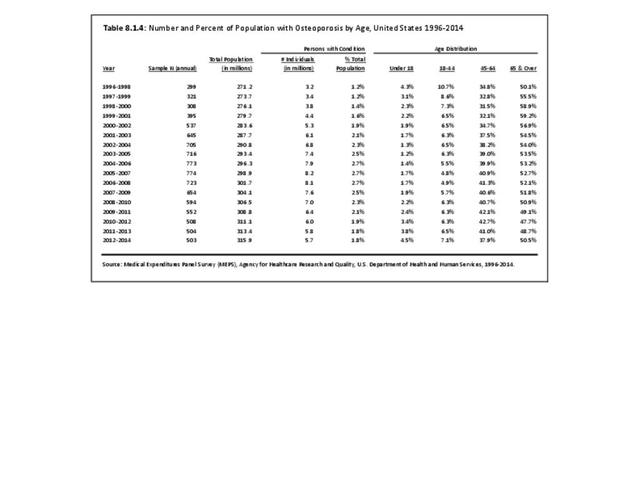
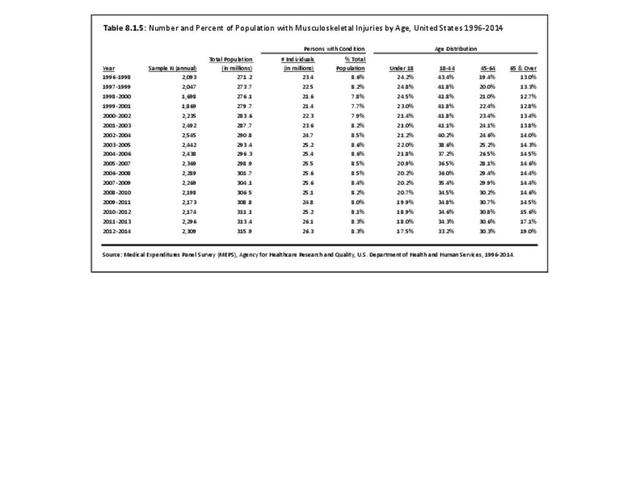
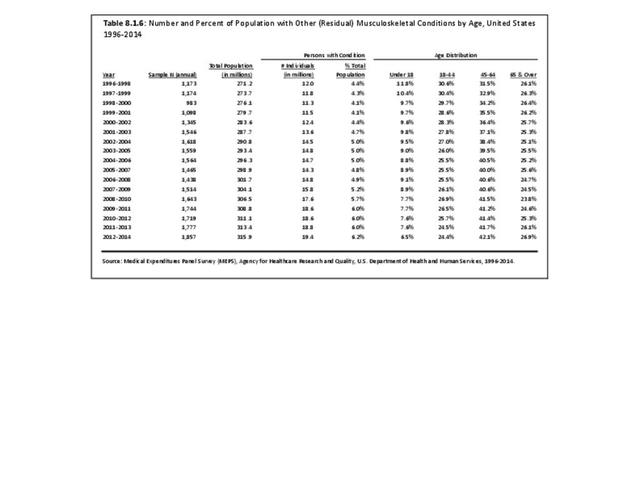
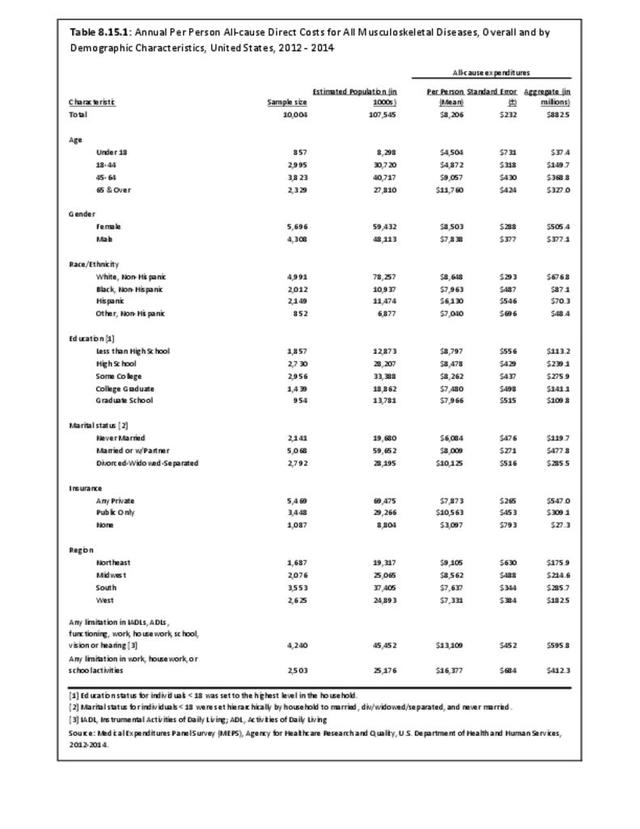
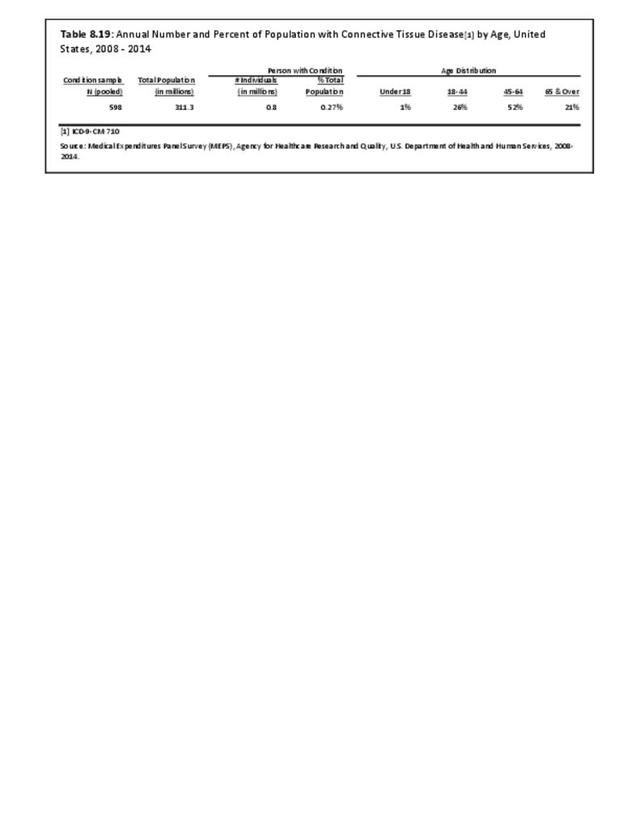
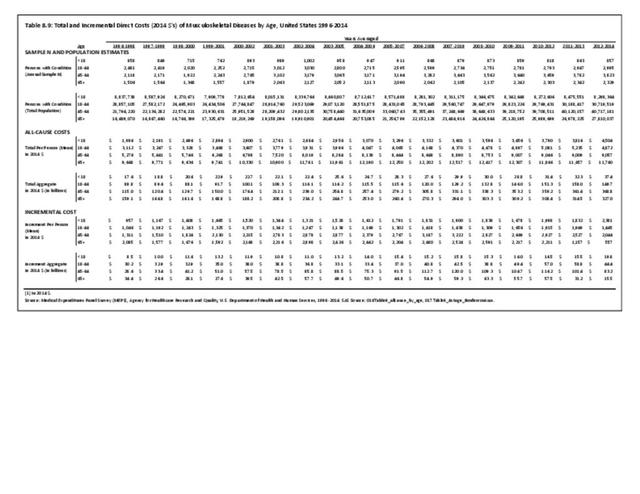
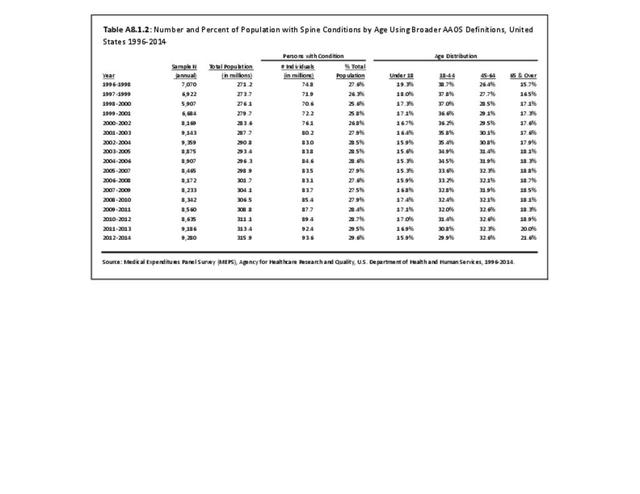
The aging of the population has increased the prevalence and the share of persons with musculoskeletal conditions in older age groups, as well as healthcare expenditures. In 1996-1998, an average of just under 22 million persons aged 45 to 64 years reported a musculoskeletal condition, while about 16.5 million of those aged 65 years and older did so. By 2012-2014, these numbers had increased to just under 41 million and just under 28 million, respectively. The share of persons with musculoskeletal conditions among persons aged 45 to 64 years increased from 29% in 1996-1998 to 38% in 2012-2014, and increased from 22% to 26% among those aged 65 years and older. Most of this shift is due to the impact of aging and population growth, as prevalence rates have remained relatively steady for at least the last five years. (Reference Table 8.9 PDF CSV)

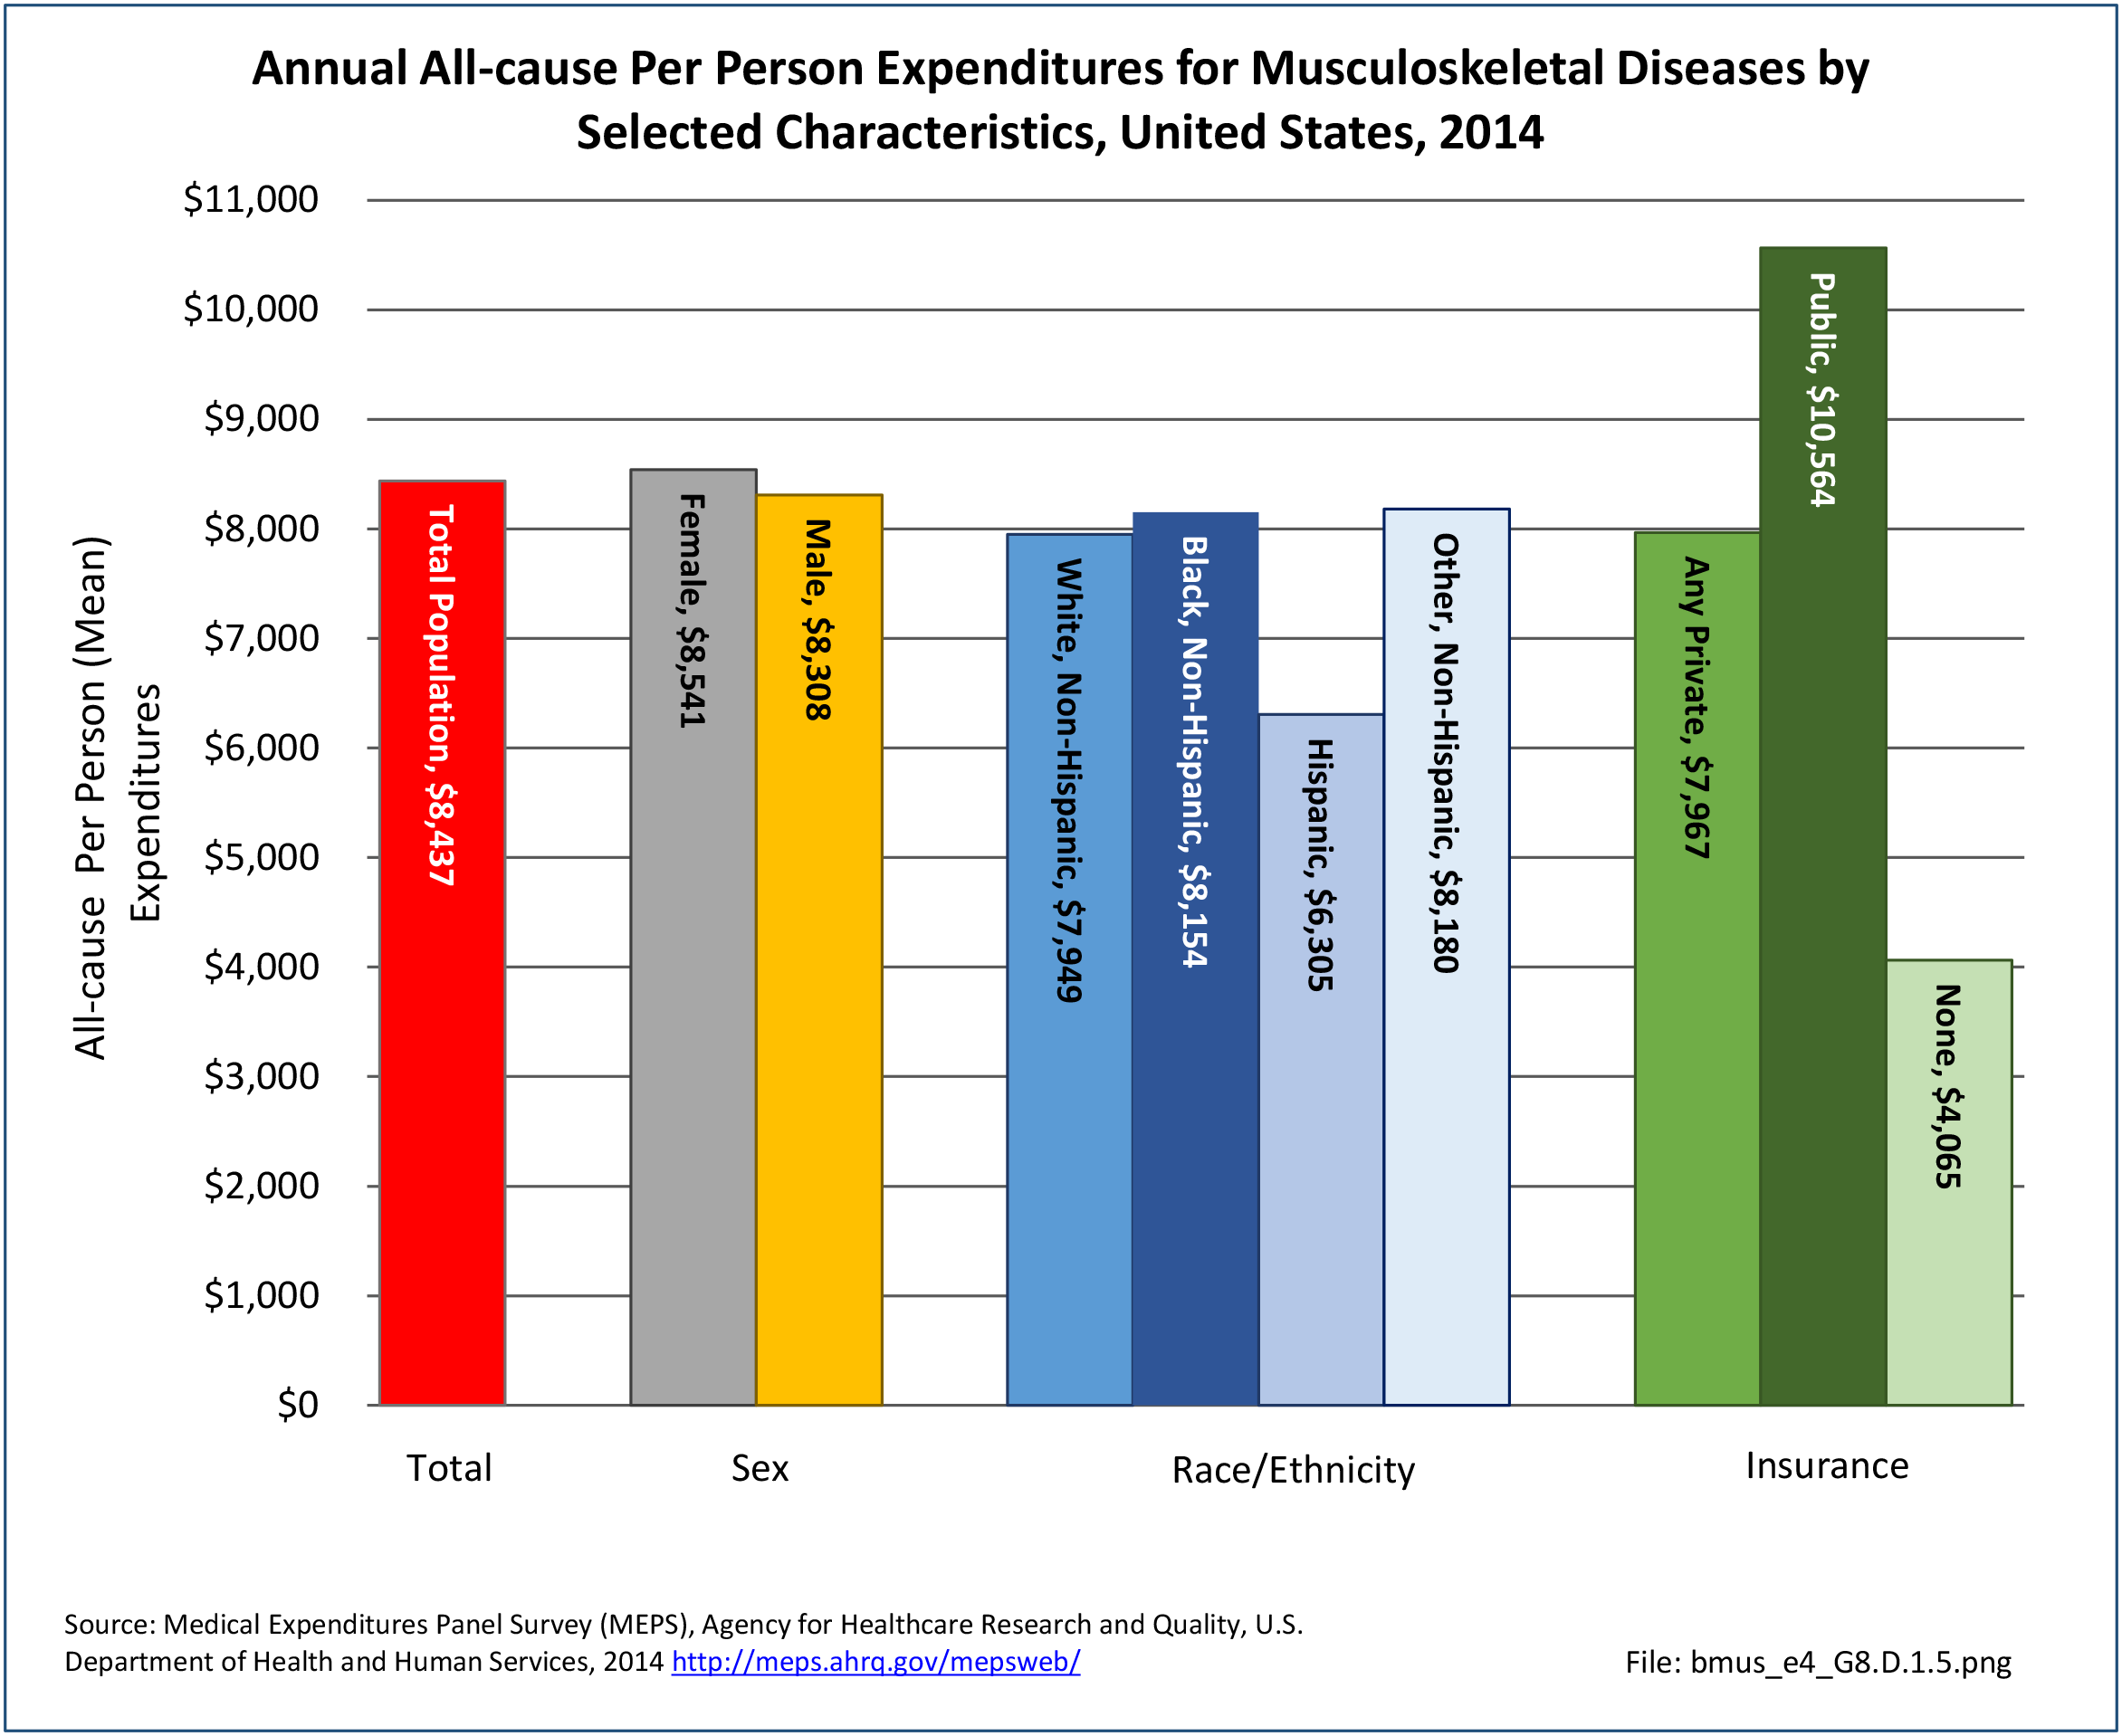
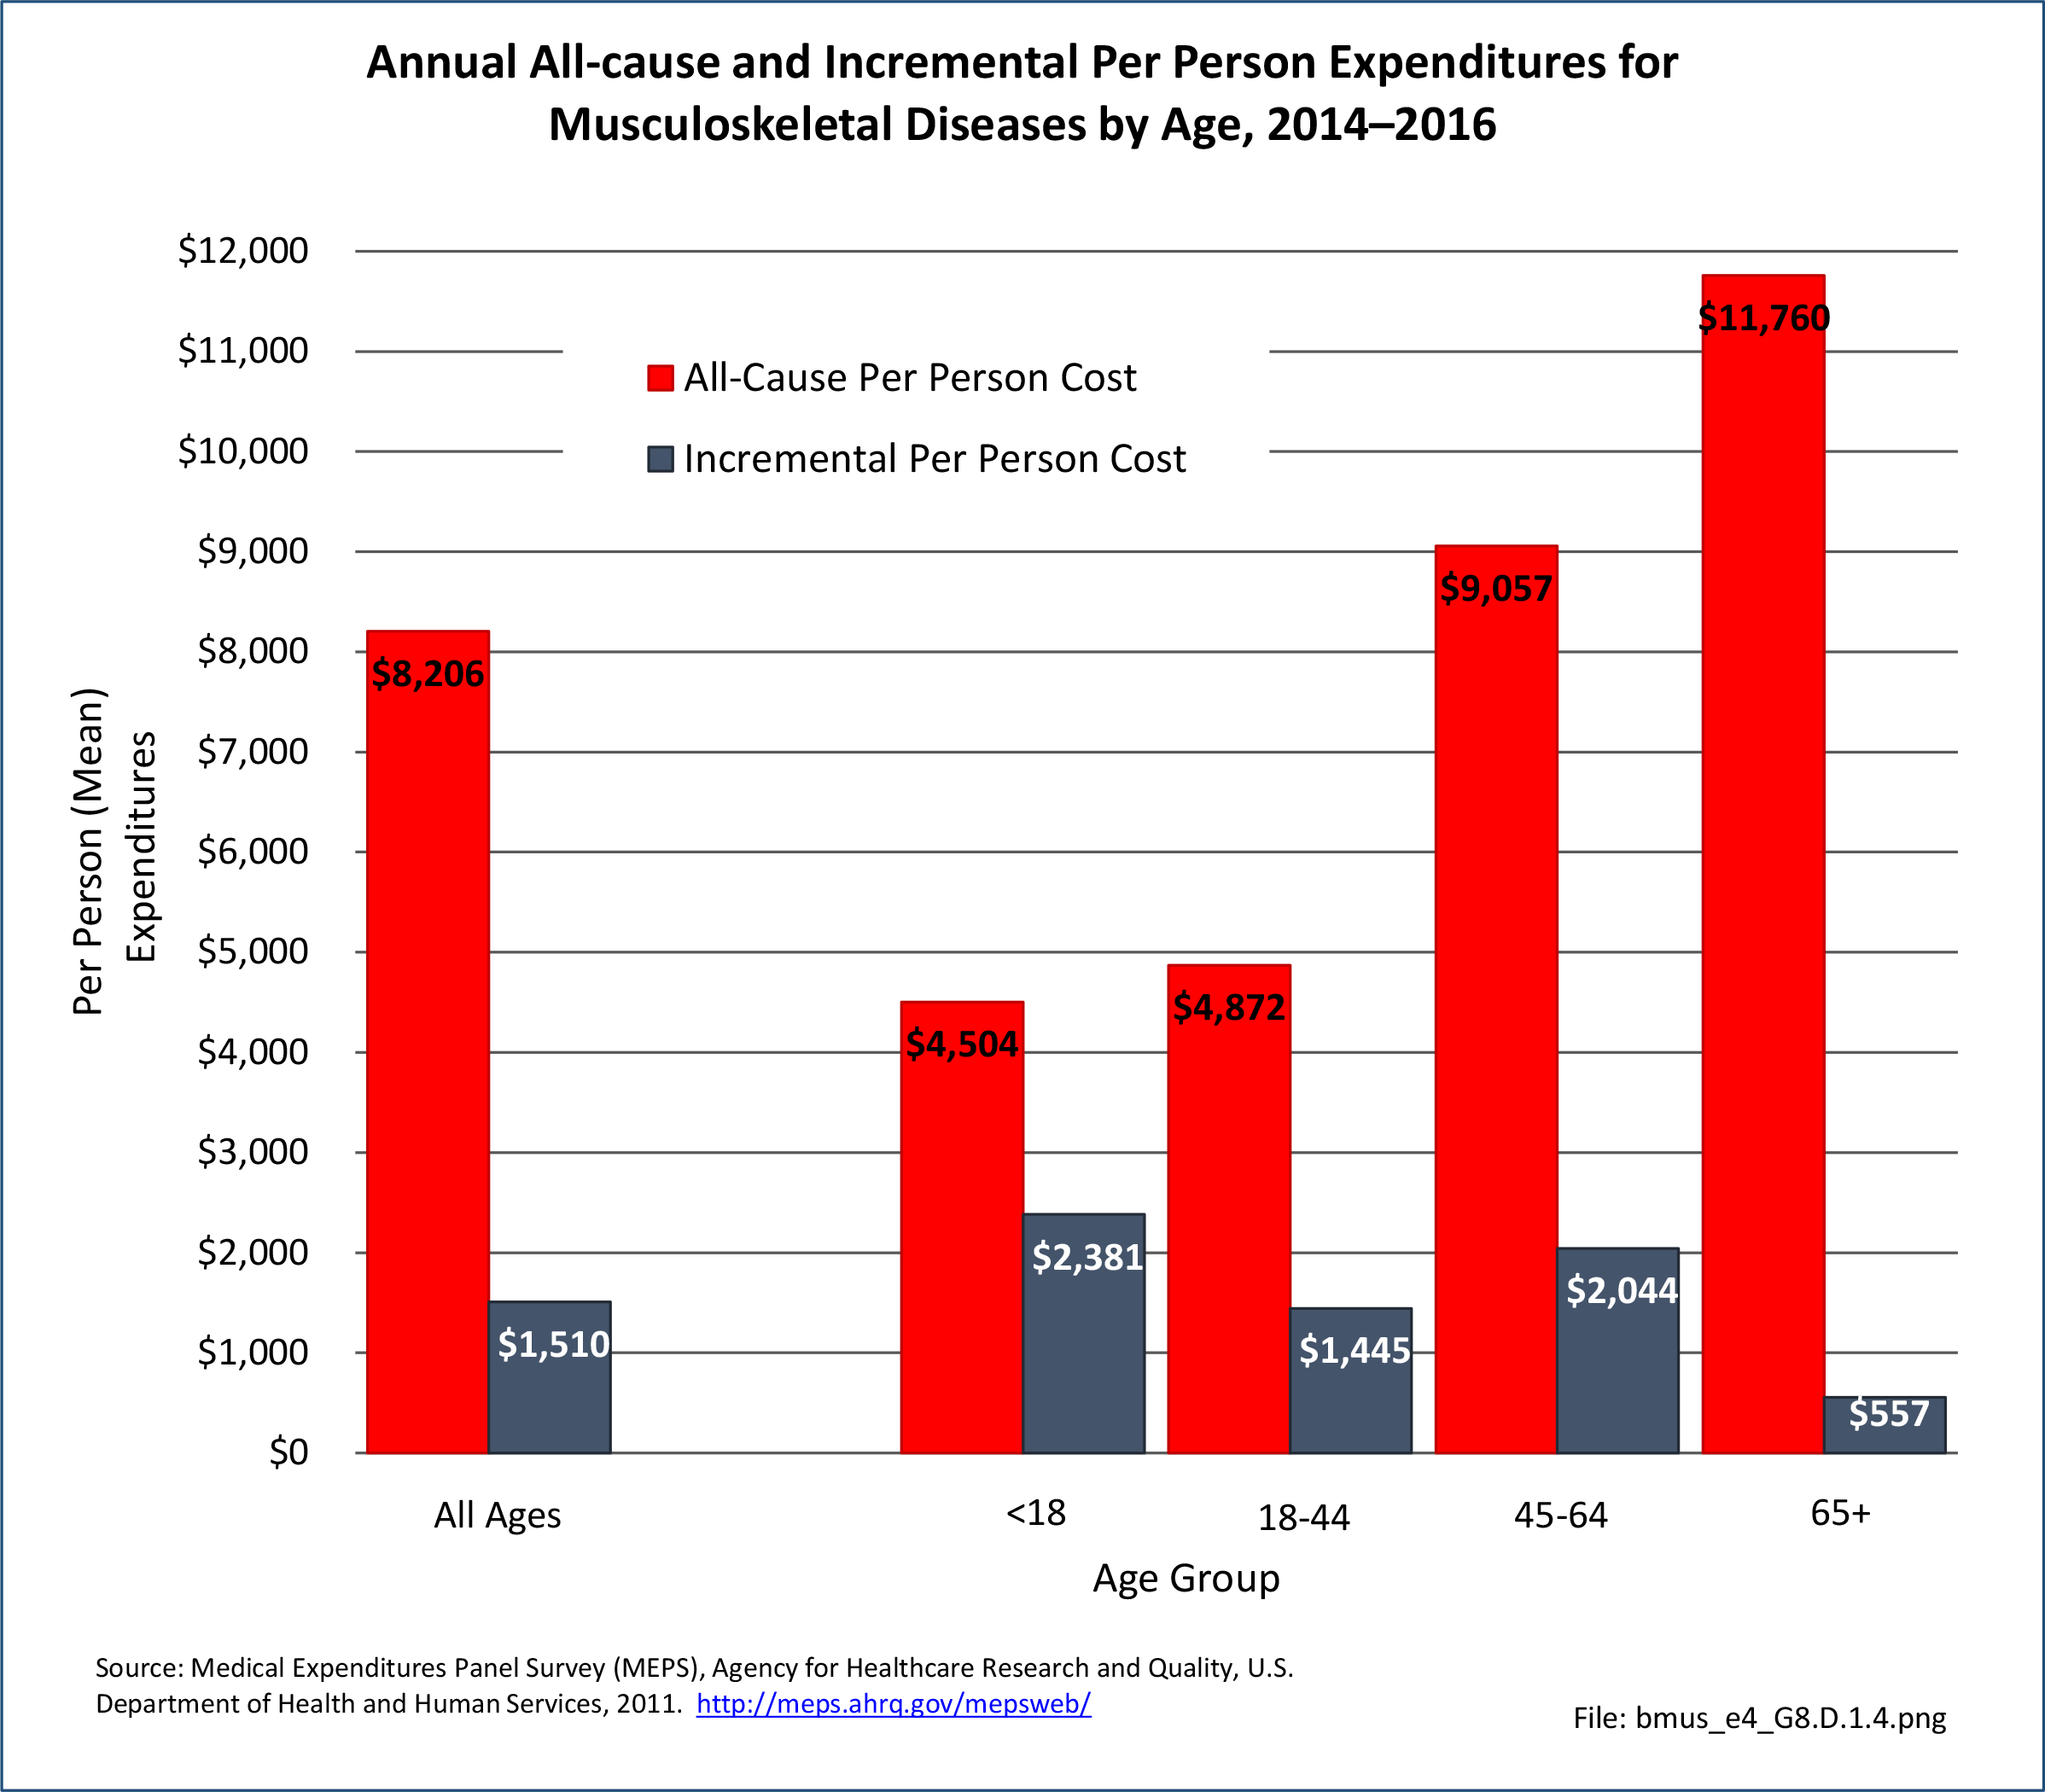
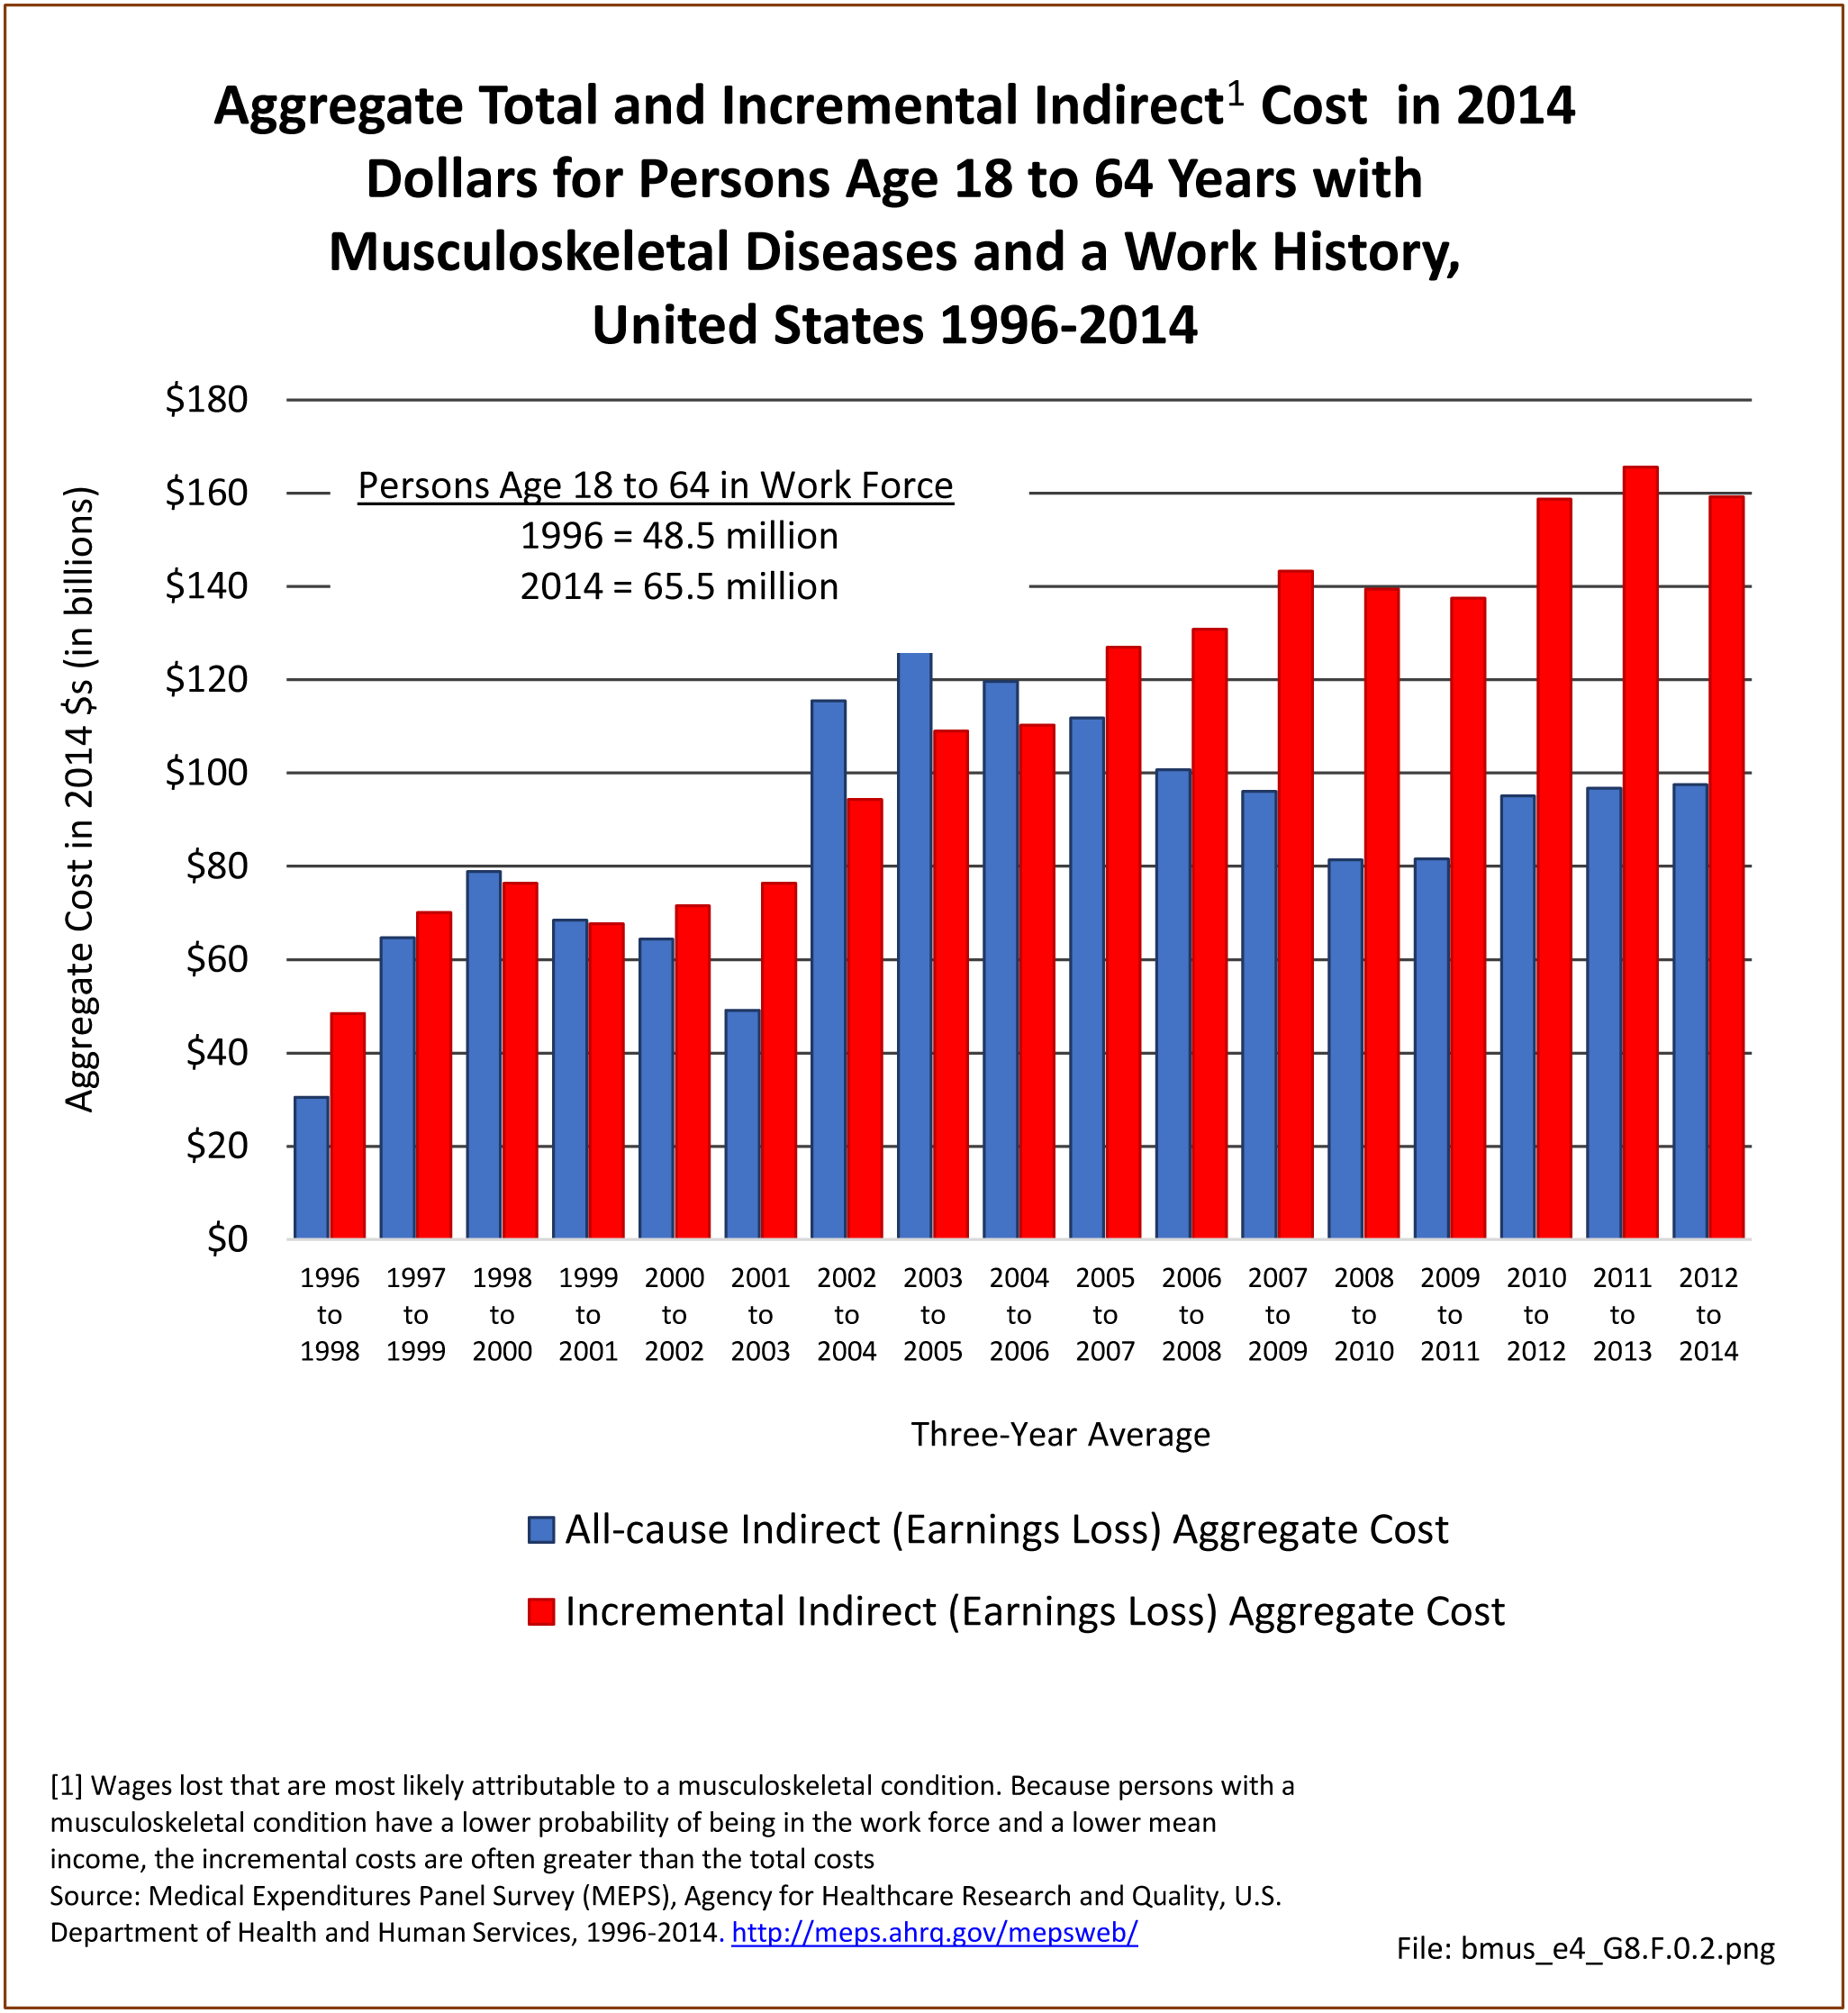
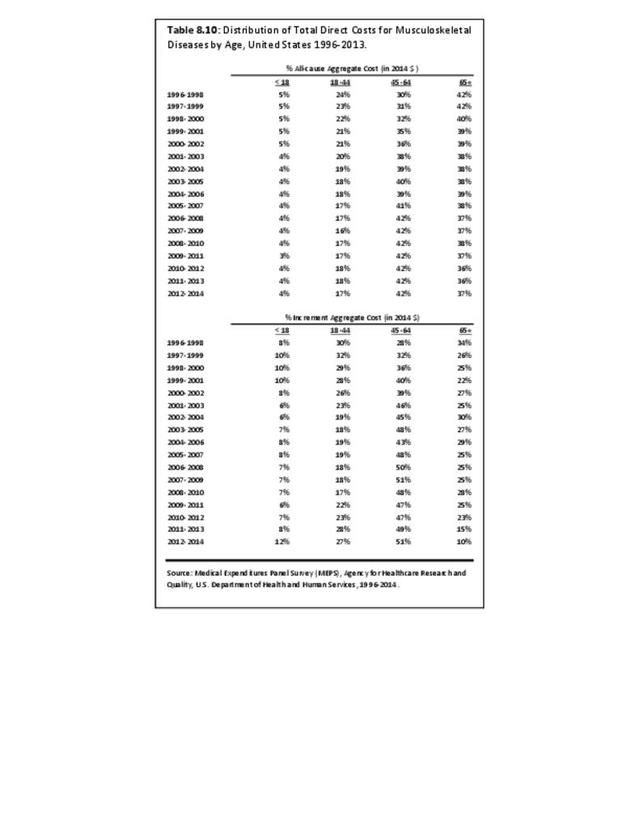
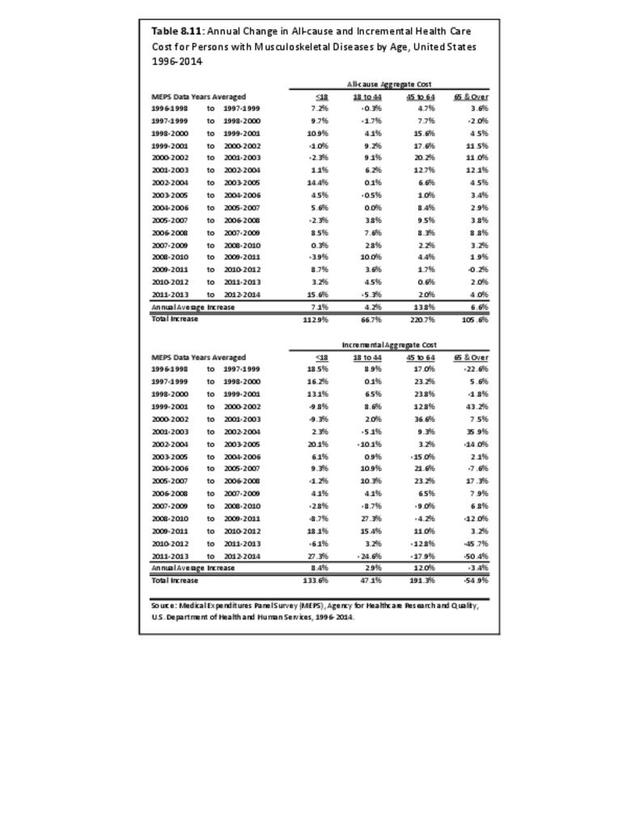
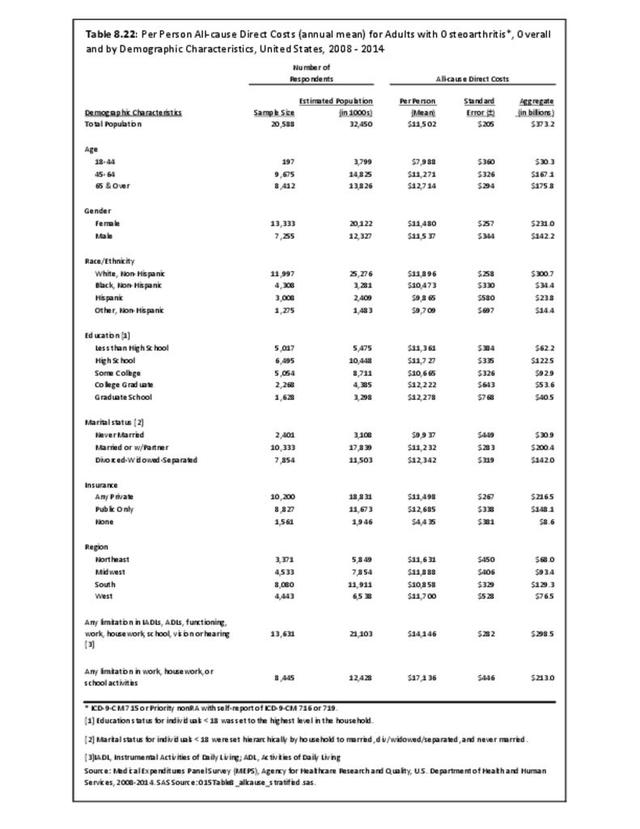
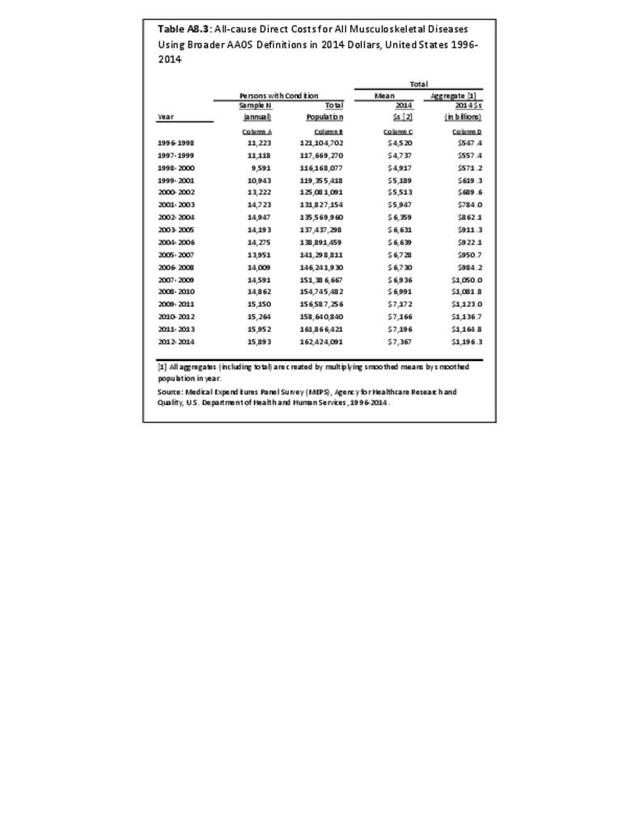
All-cause aggregate medical care expenditures among persons with musculoskeletal conditions have risen substantially due to population aging as well as the general increase in medical care costs. In 2014 dollars, total aggregate expenditures increased between 1996-1998 and 2012-2014 among persons aged 45 to 64 years from $115 billion to just under $369 billion, while they increased among those aged 65 years and older from $159 billion to $327 billion during this time. Although all-cause per person costs increase with age, the magnitude of the increase was greater in relative terms among persons aged 45 to 64 years with musculoskeletal conditions (from $5,276 to $9,057, or by about 72%) than among such persons aged 65 years and older (from $9,648 to $11,760, or by 22%), but was highest for the under 18 age group. Although the data do not address why the costs rose faster among those aged 45-64, the faster increase may be the result of greater cost controls in Medicare, which serves people aged 65 or older, or to subtle discrimination against older persons in the types of treatments offered. (Reference Table 8.9 PDF CSV)

Edition:
- Fourth Edition