Connective tissue disorders (CTDs) are part of the systemic autoimmune rheumatic diseases (SARD) grouping of disorders and include systemic lupus erythematosus (SLE or lupus), systemic sclerosis (SSc or scleroderma), inflammatory myositis (polymyositis and dermatomyositis), and Sjögren syndrome (SjS). They are characterized by a heterogeneous group of immune-mediated inflammatory signs and symptoms affecting multiple organ systems, including the joints.
Prevalence of Connective Tissue Disorders
The prevalence of syndromes in the CTD family are difficult to identify, and vary depending on the study duration, classification criteria, and the country in which the study was undertaken. Current estimates are based on special populations and primarily use several CDC-funded state registries. Connective tissue disorders affect all ages, but incidence is higher among women than men by a factor of at least 4:1, with estimates as high as 12:1 for SLE.1,2 Lupus generally begins during women’s children bearing years and can lead to serious kidney involvement among other complications.
The highest prevalence is for SjS, ranging between 0.5% and 3% of a given demographic population.1 Estimates of overall prevalence range from 400,000 to 3.1 million US adults.3
Recent national estimates of prevalence and incidence of SLE in the US are not available, but it is relatively uncommon. Using older meta-analysis studies, prevalence of SLE is estimated between 15 and 50 per 100,000 individuals.1 The Lupus Foundation of America estimates a total of 1.5 million Americans have some form of lupus, with an incidence of 16,000 new cases per year.4
The prevalence of SSc, also known as scleroderma, is much lower and has been reported with an incidence of 20 per one million new cases per year and a prevalence of 240 per million US adults, based on a limited US population studies published in 2003.5,6 A more recent update did not find this estimate to be changed.7
Overall prevalence and incidence of CTD is not reported in the literature, as classification criteria are not defined.1 However, the economic analysis for this report places prevalence at 0.27% for the years 2008 thru 2014. (Reference Table 8.20 PDF CSV)
Healthcare Utilization
Hospitalization
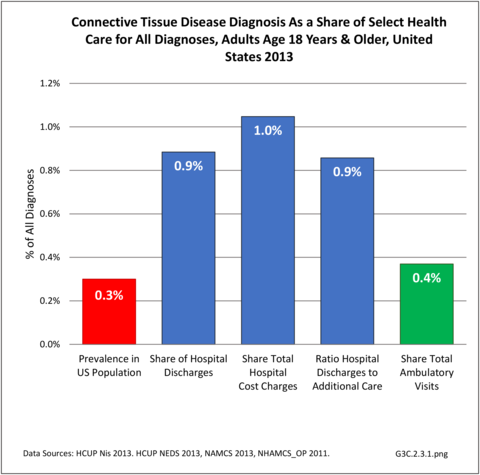
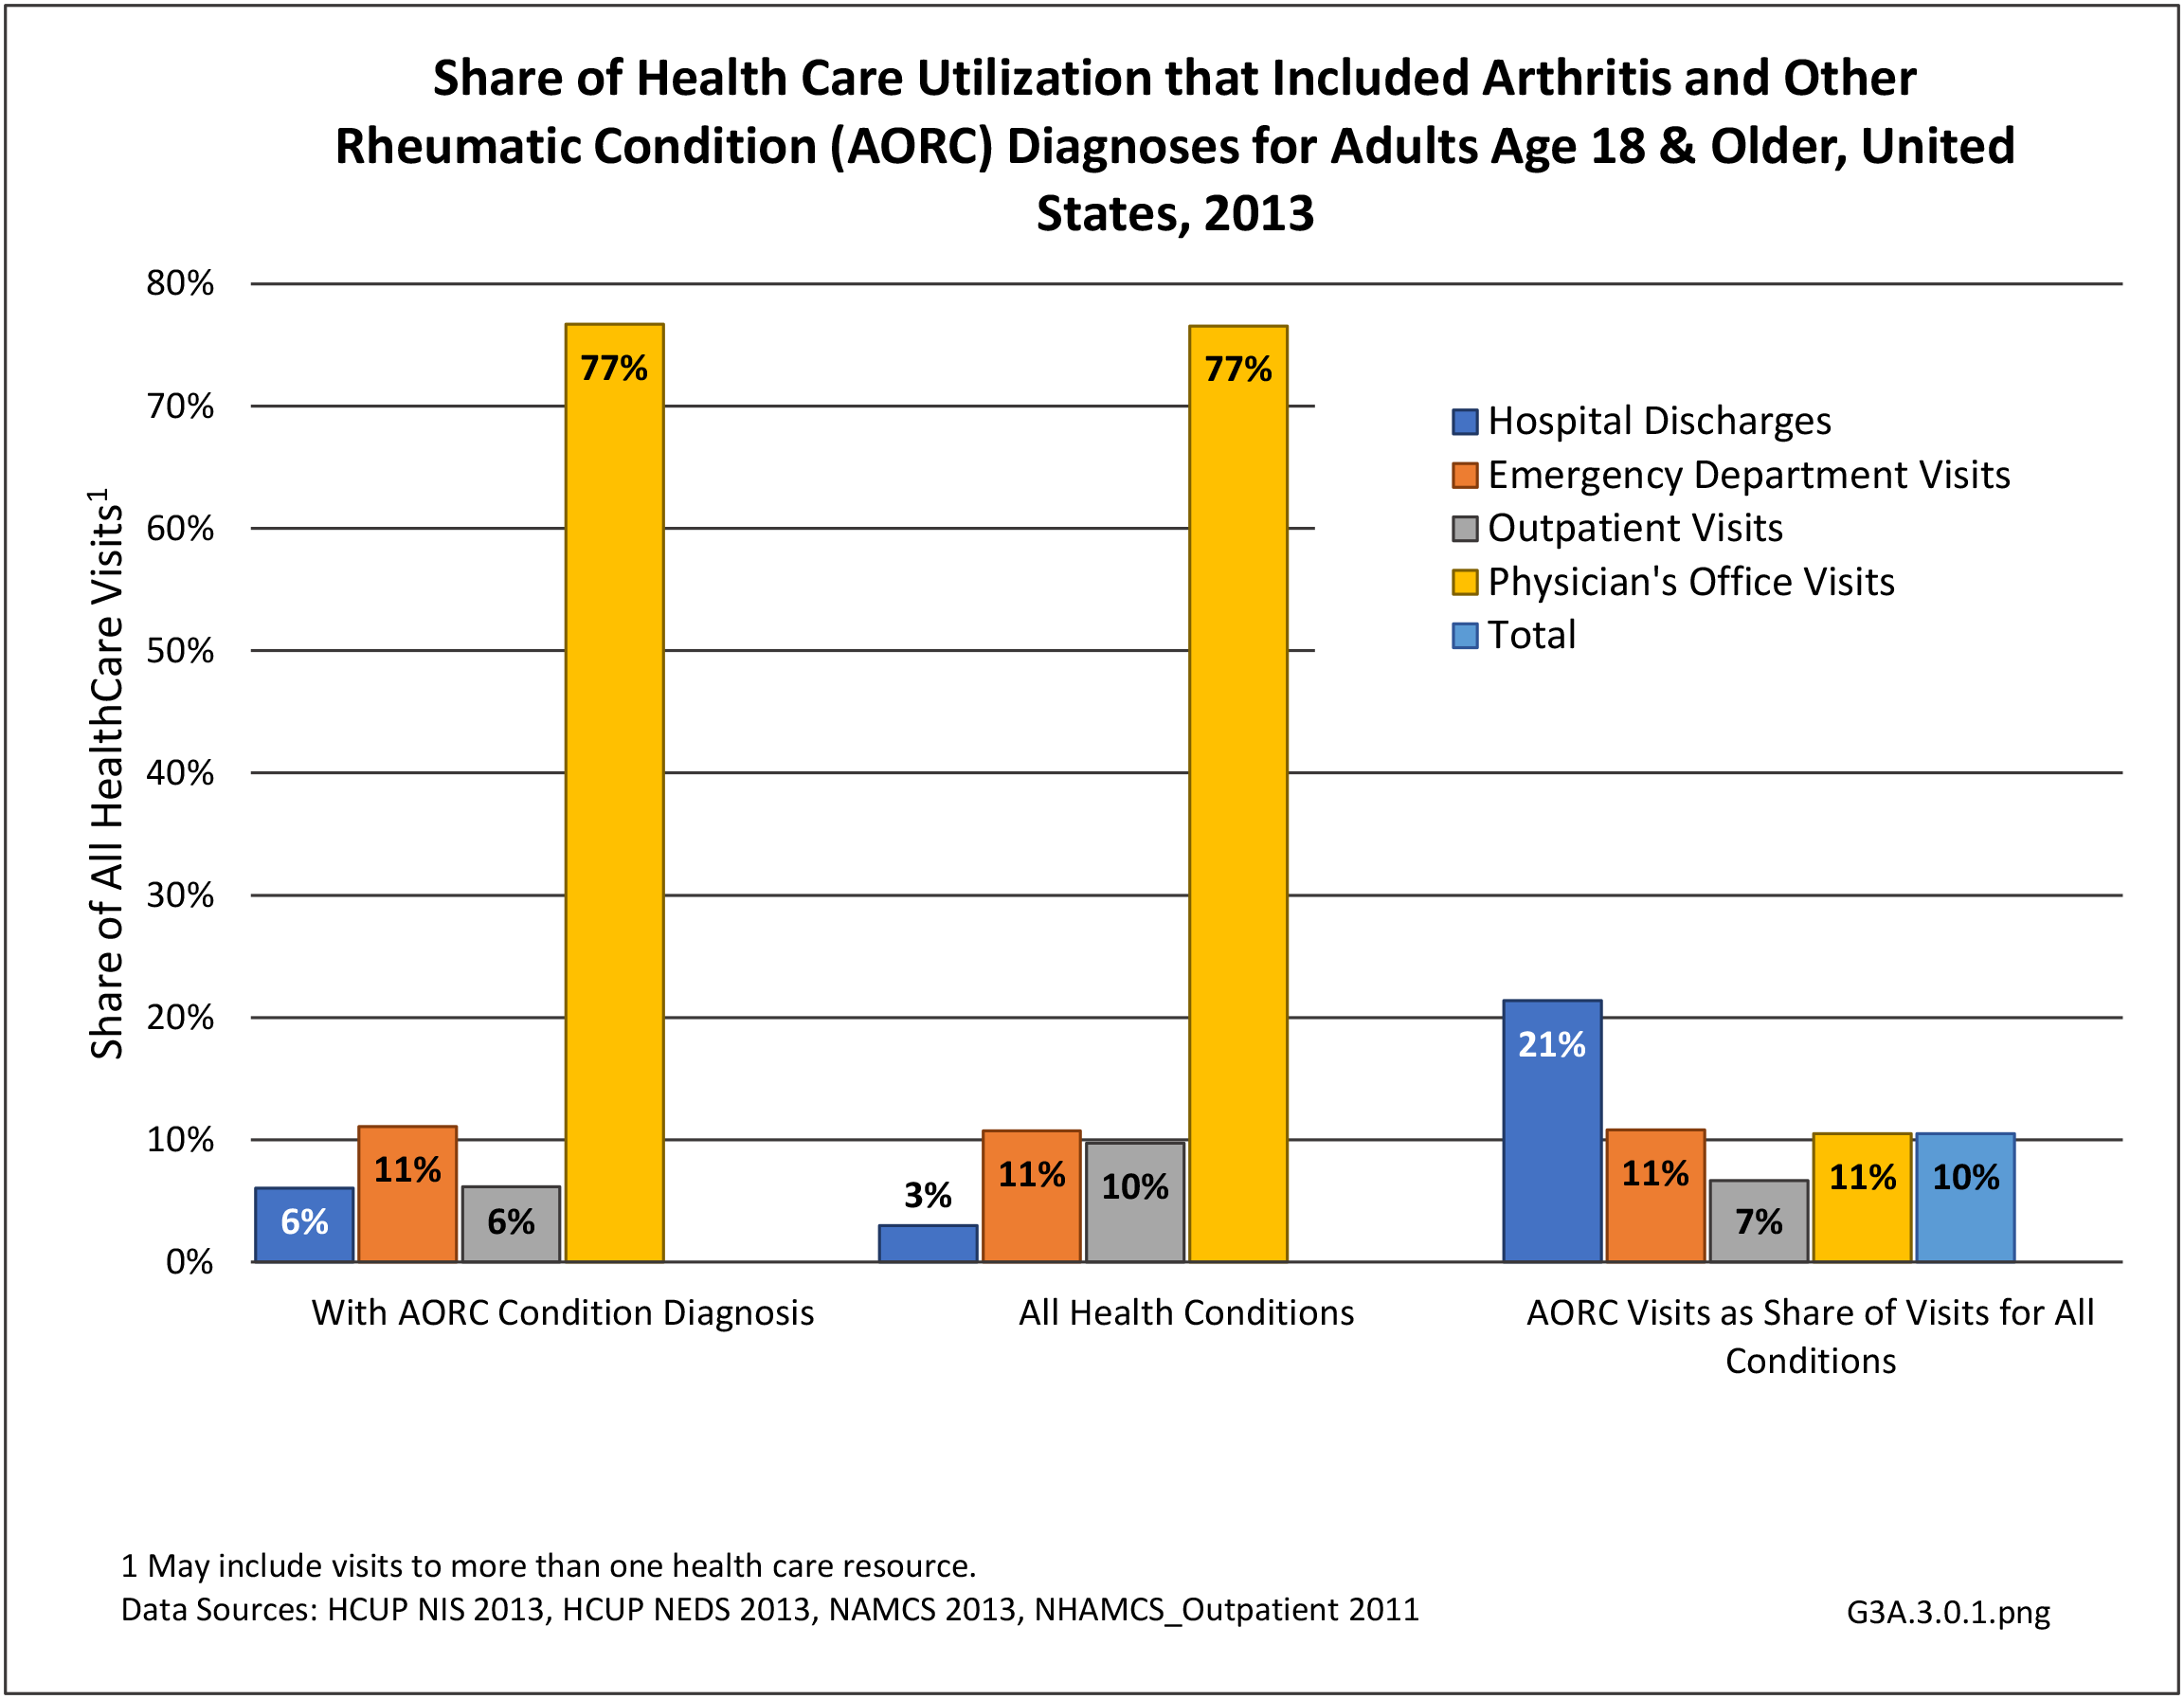
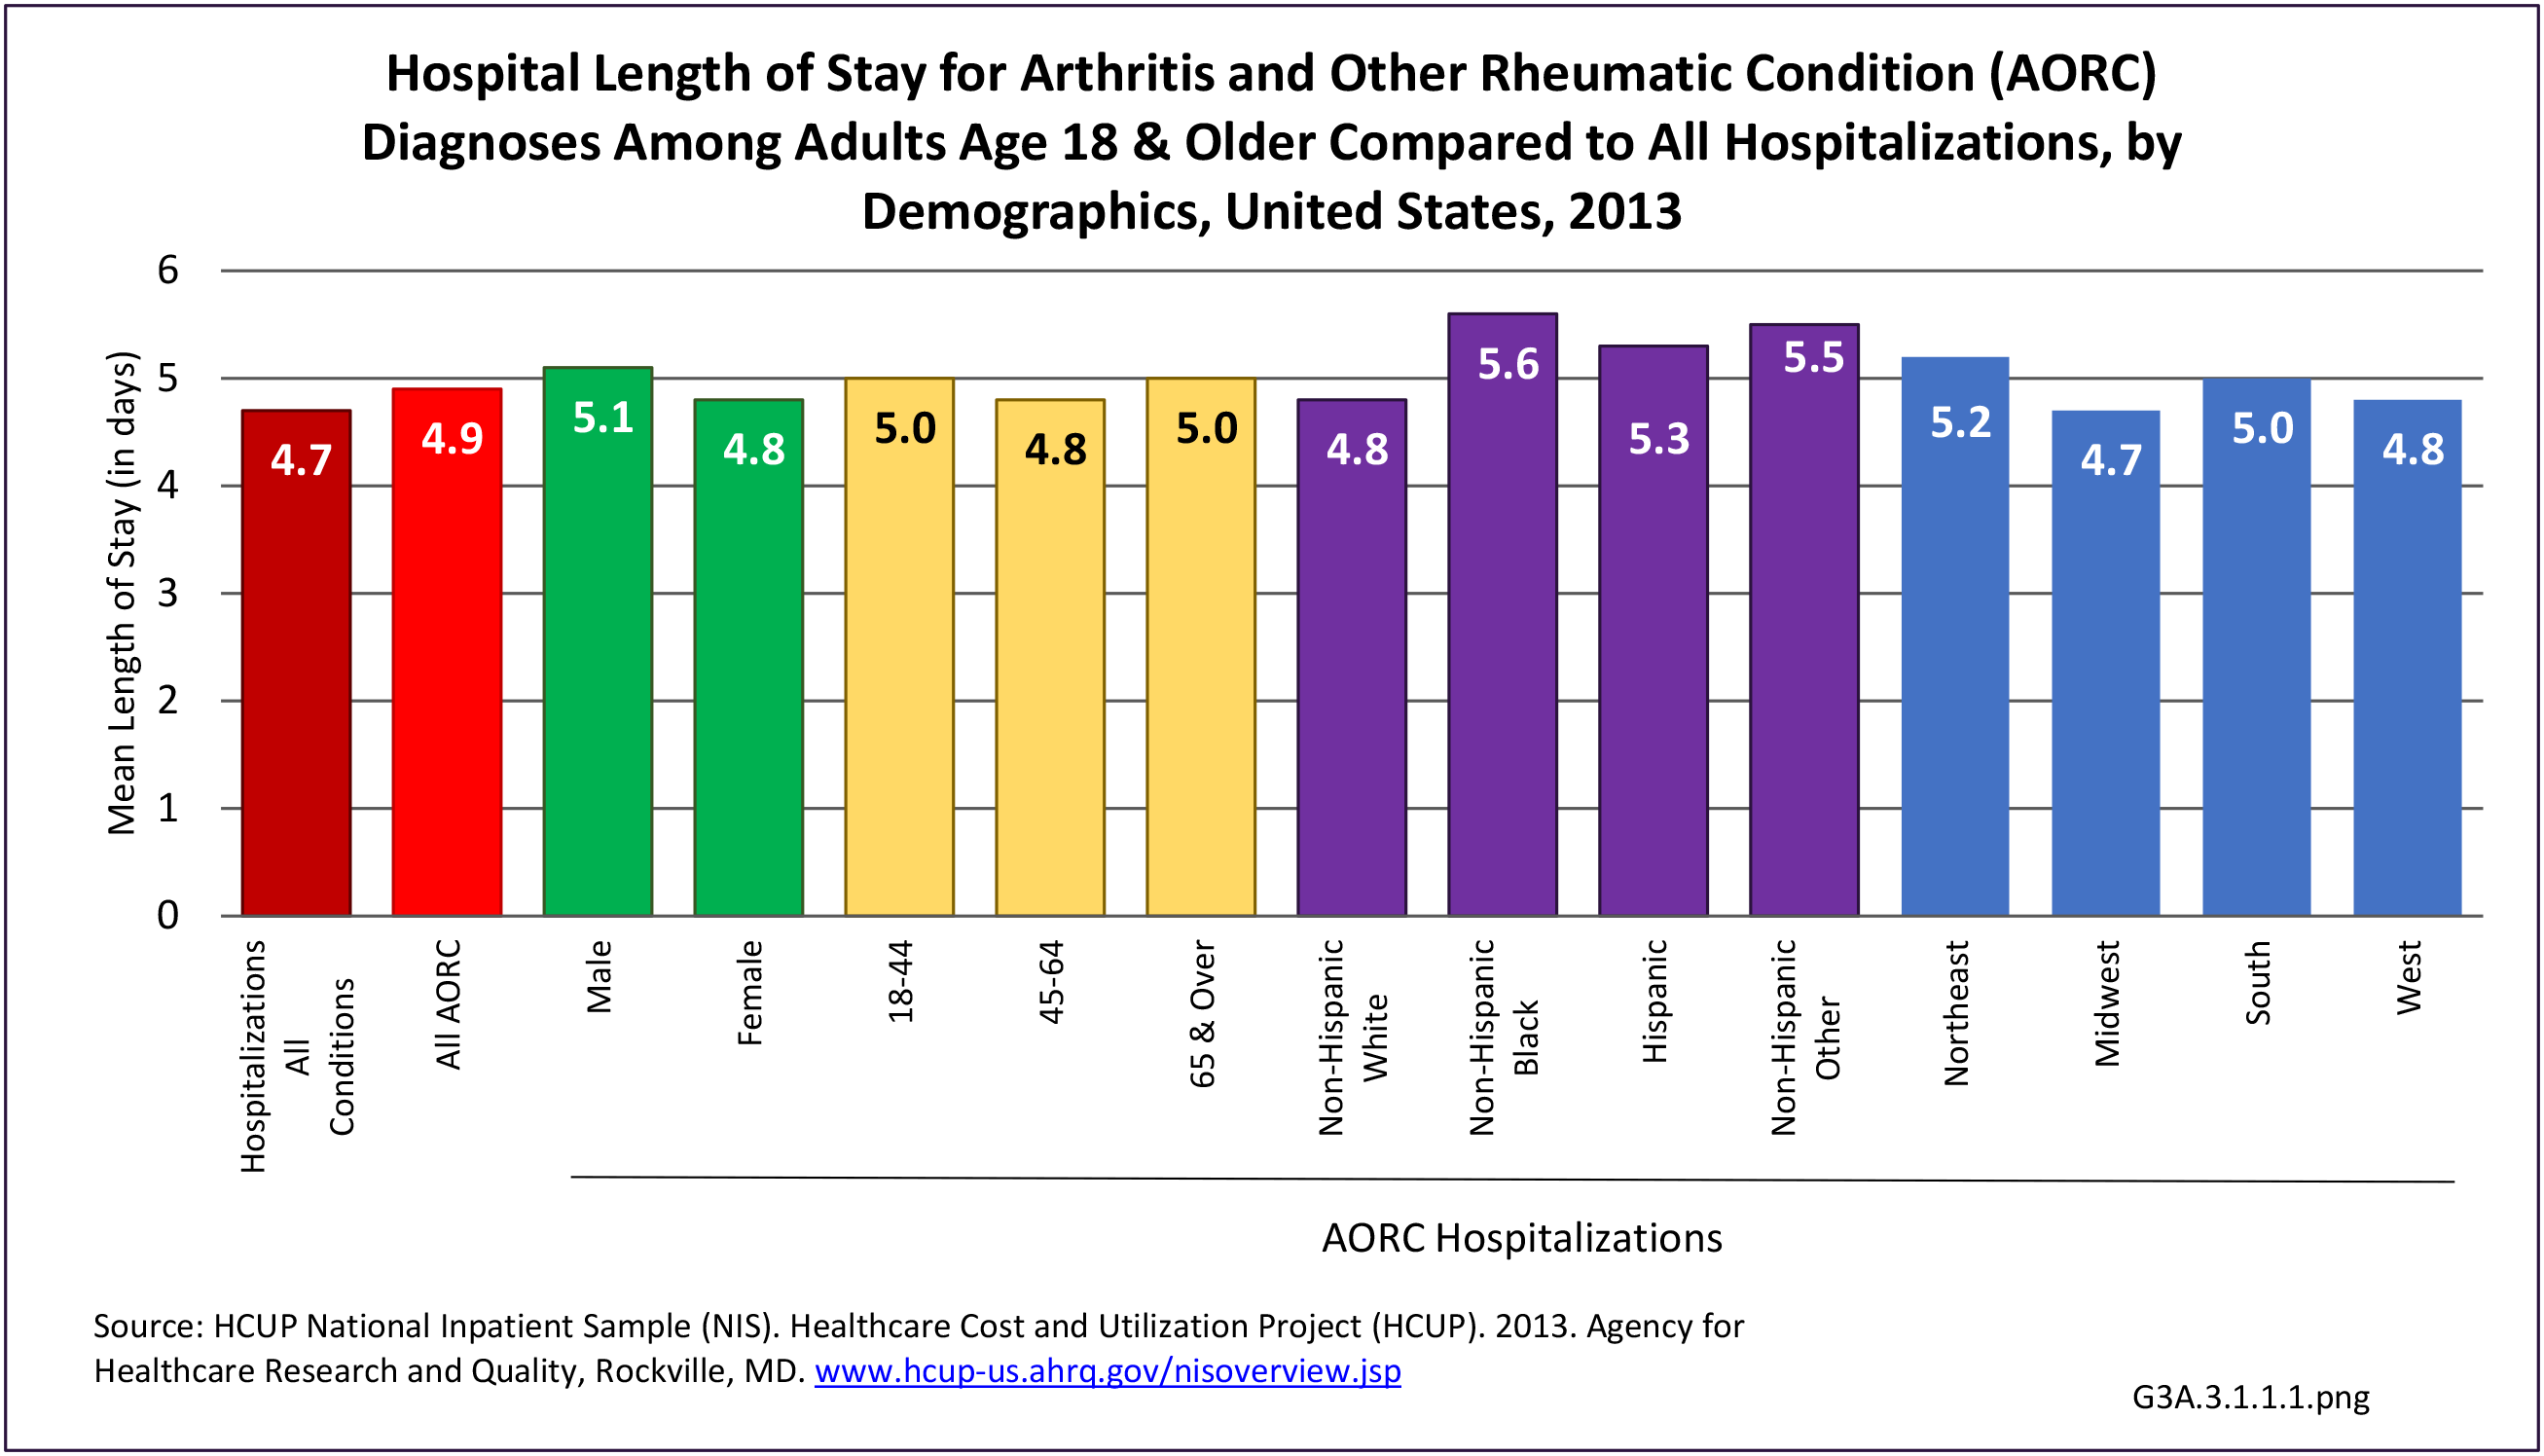
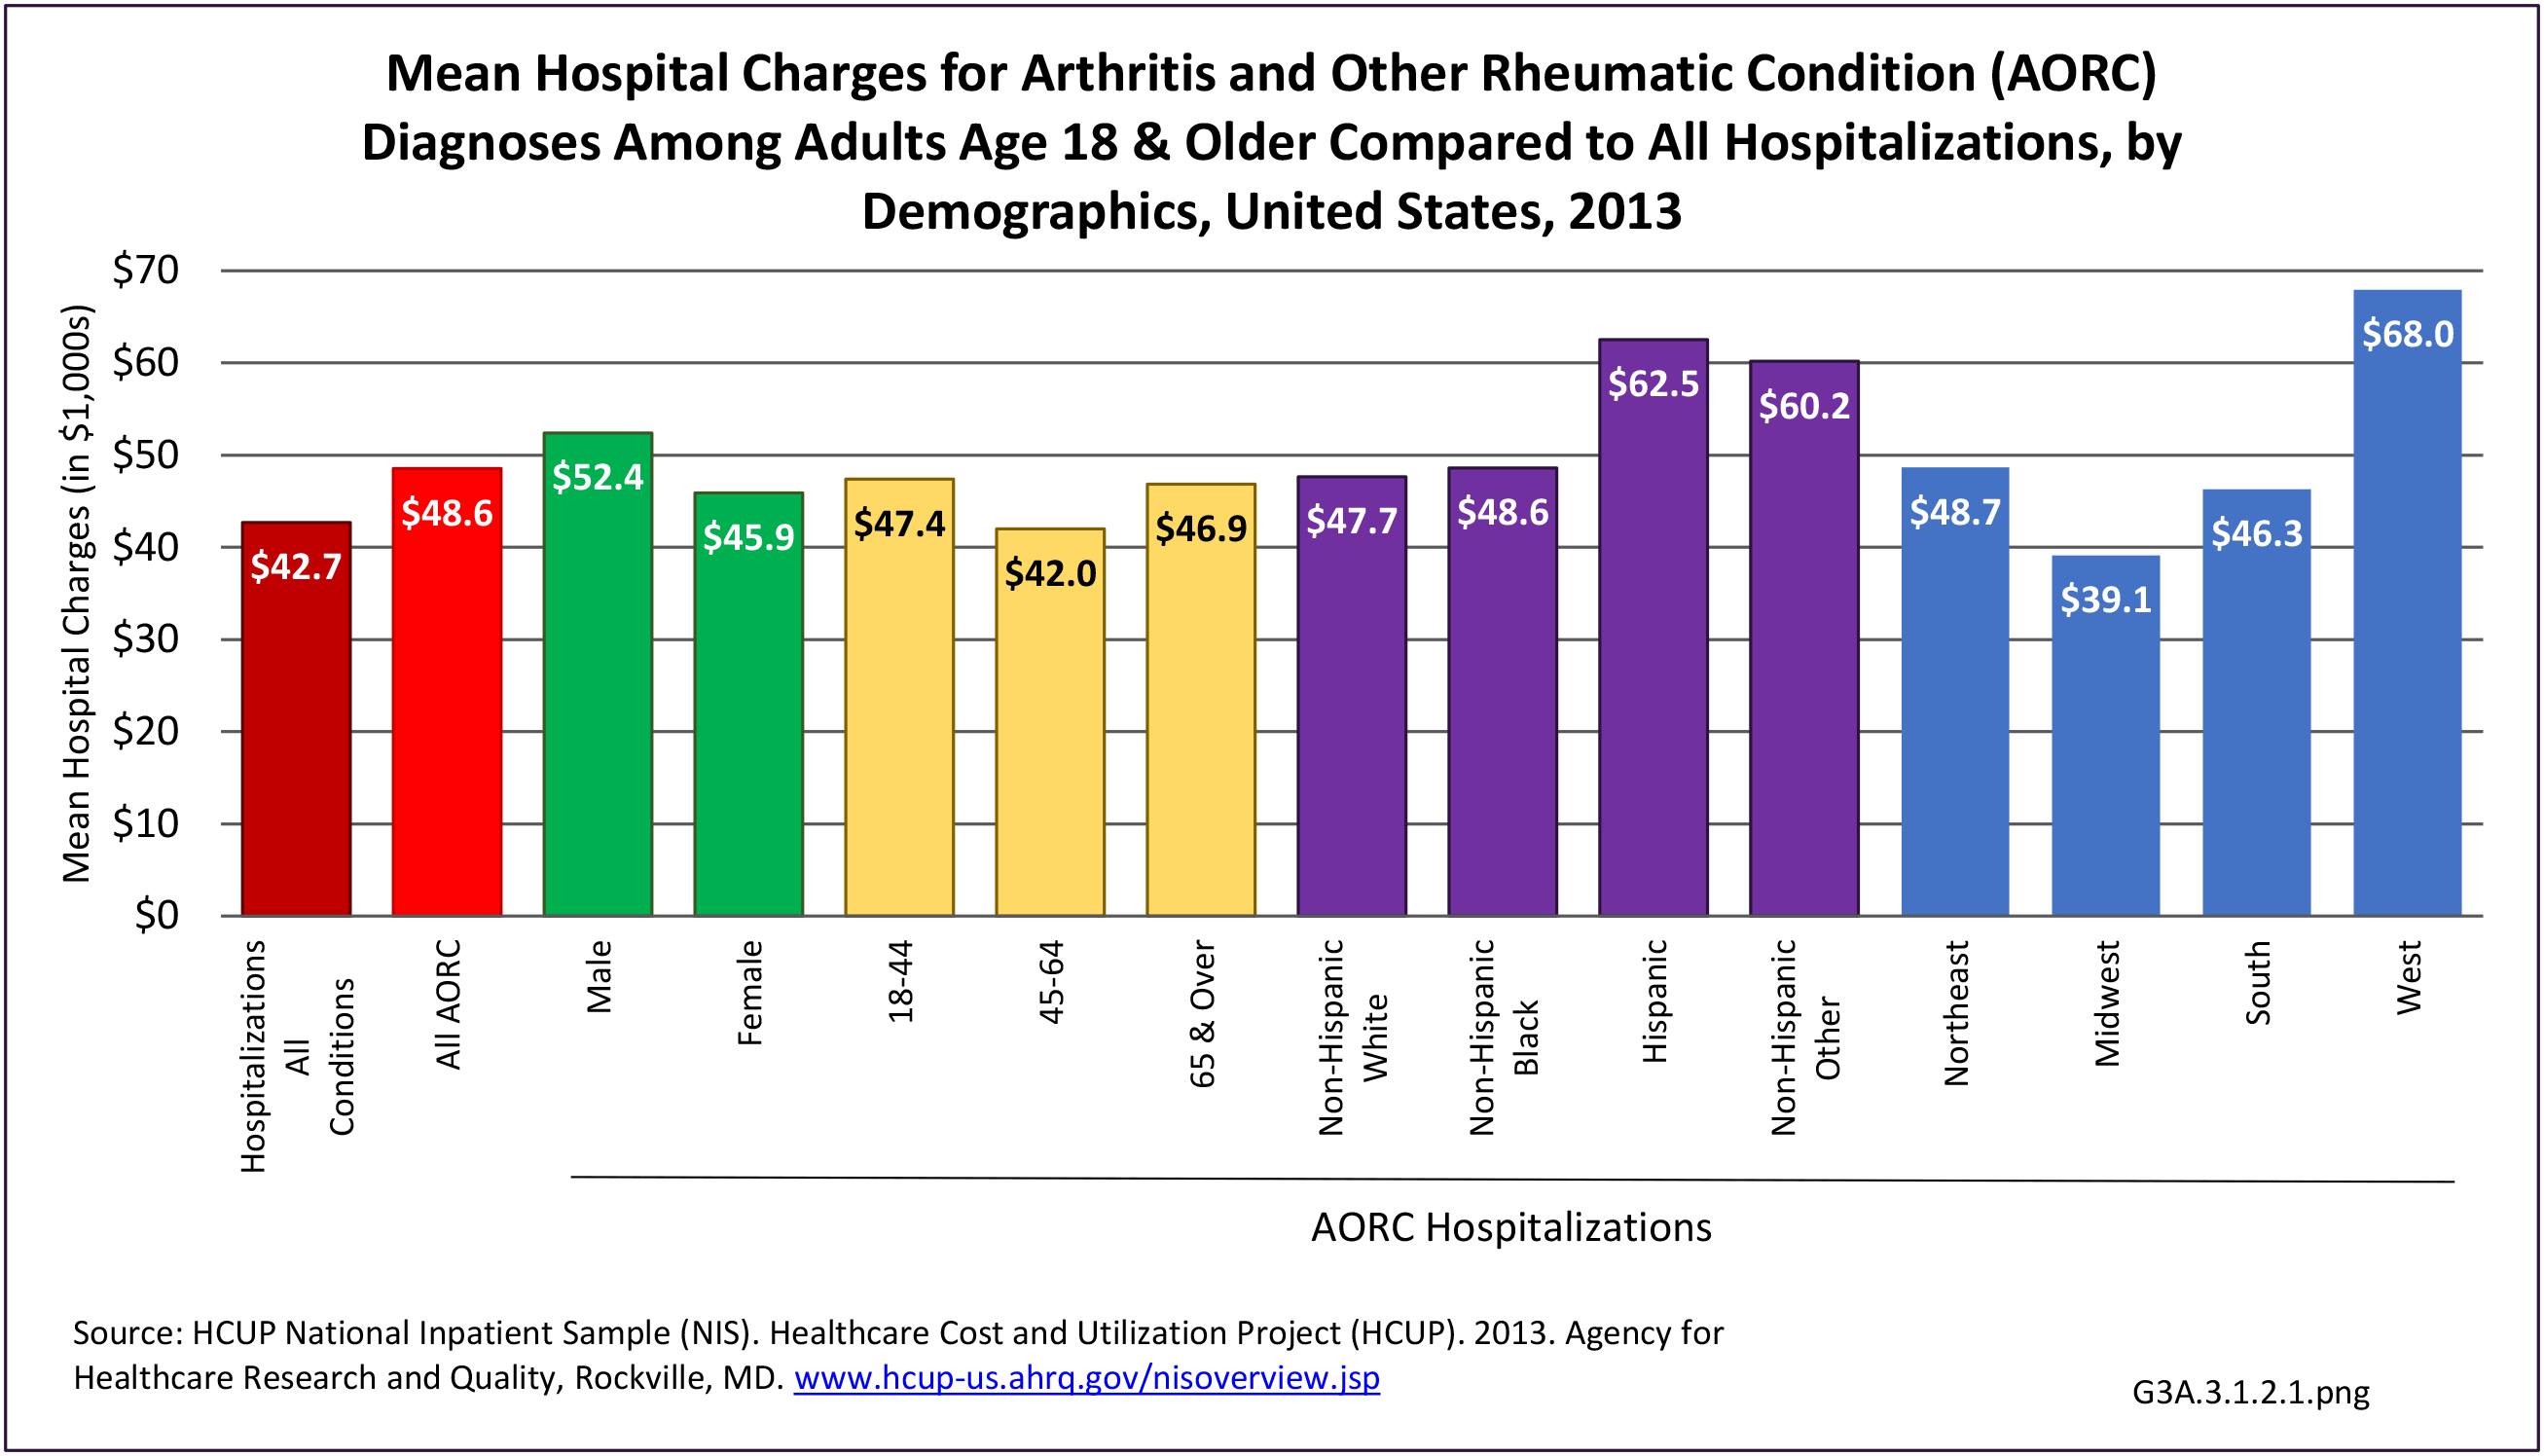
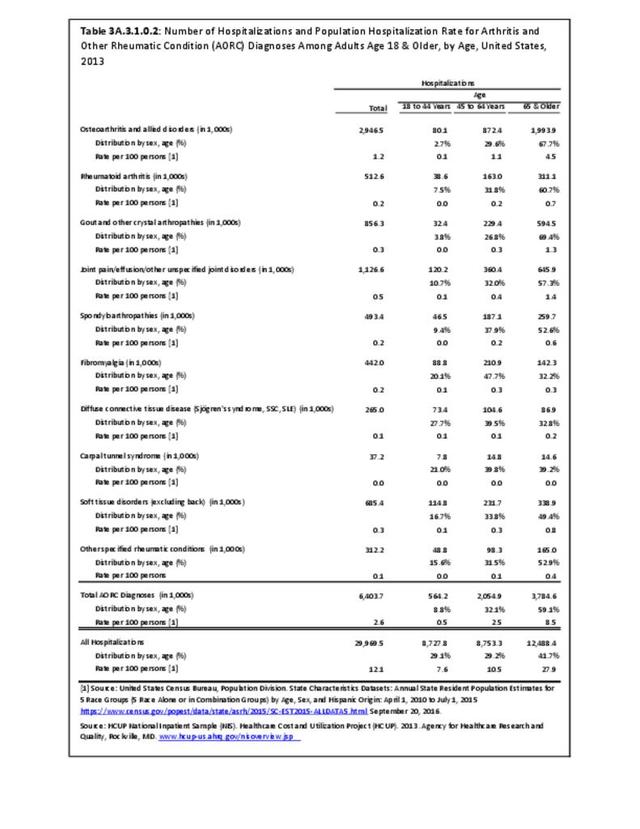
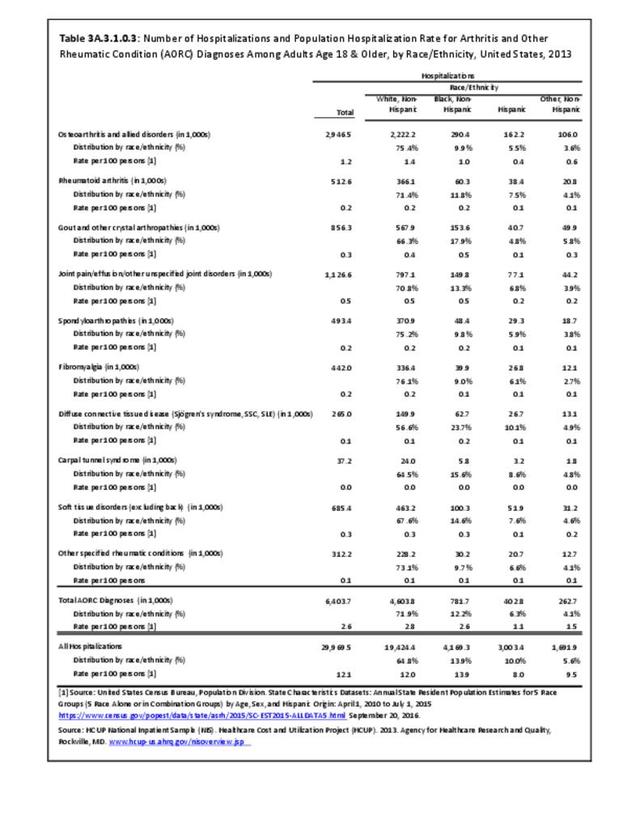
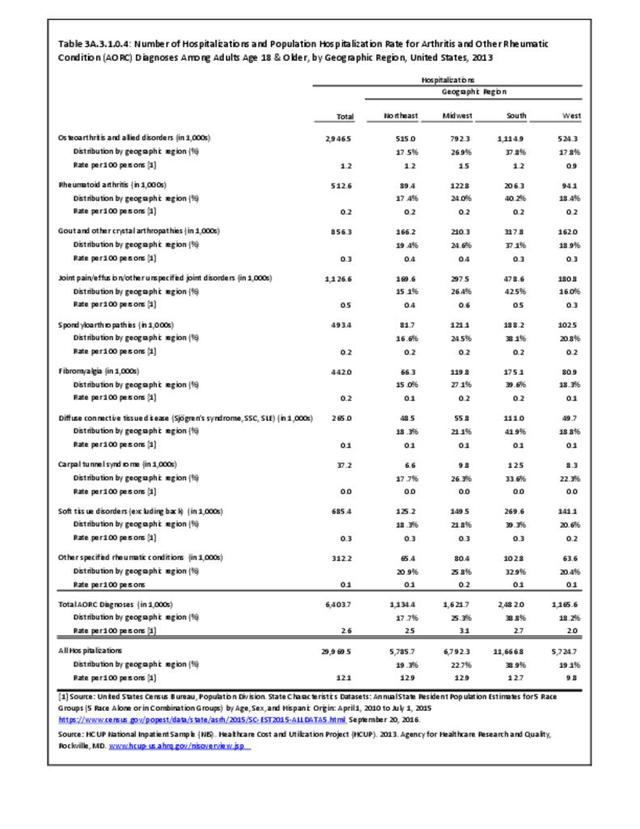
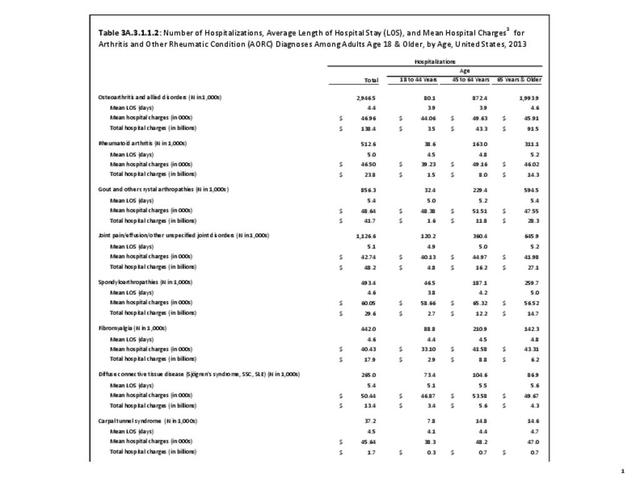
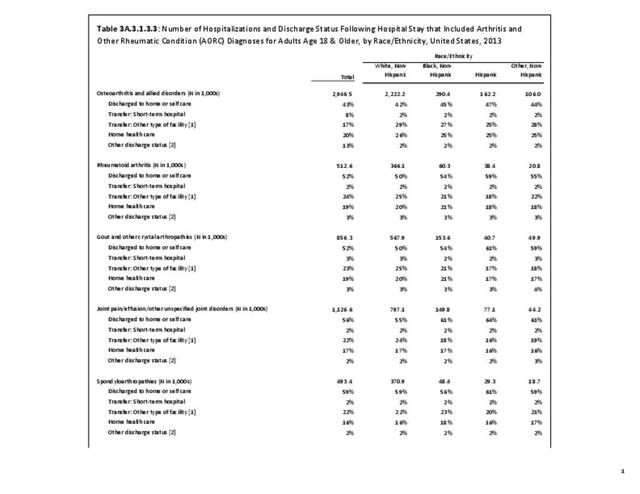
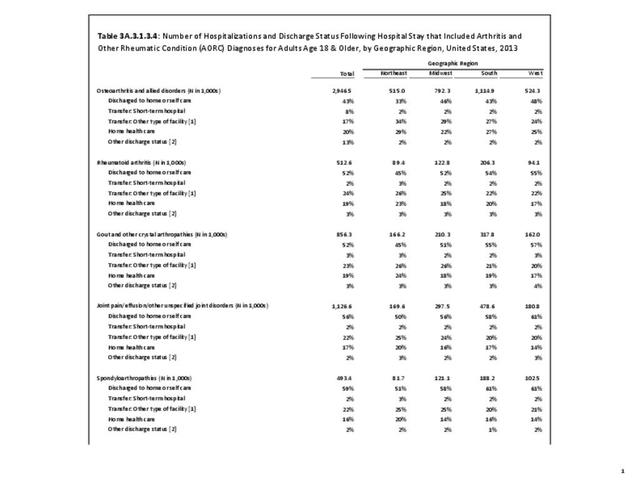
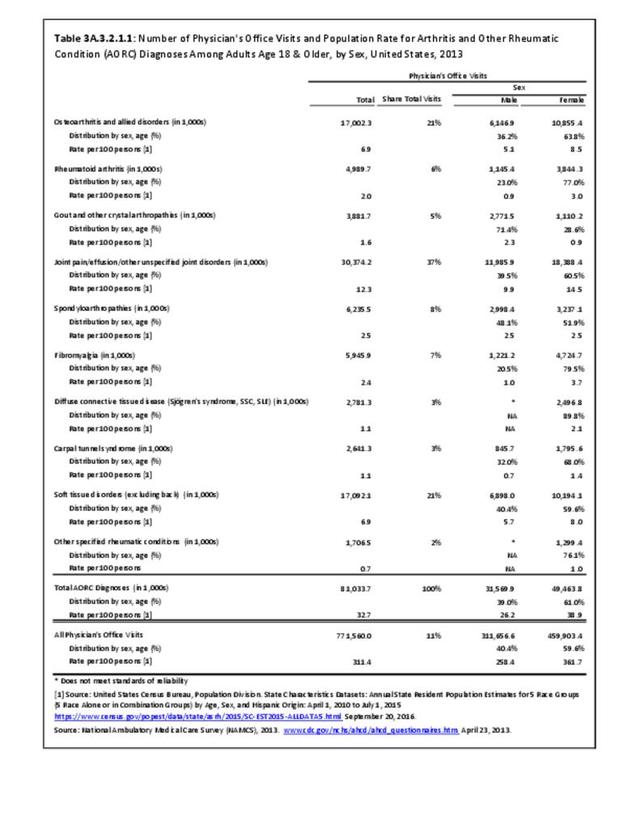
Connective tissue disorders represented 1% of hospital discharges and total charges for all diagnoses hospital stays in 2013. Because of the very low incidence of CTD syndromes, the prevalence is estimated at 0.3 percent or less, with use of healthcare resources much higher than the incidence ratio. Although the share of hospital discharges is higher than the share of all ambulatory visits, the rate of hospital discharges per 100 adults is much lower than the rate of ambulatory visits. Mean length of hospital stay and mean hospital charges are slightly higher than the means for all diagnoses, but patients are generally discharged to home self-care. (Reference Table 3A.3.1.0.1 PDF CSV; Table 3A.3.2.0.1 PDF CSV; Table 3A.3.1.1.1 PDF CSV; Table 3A.3.1.3.1 PDF CSV)
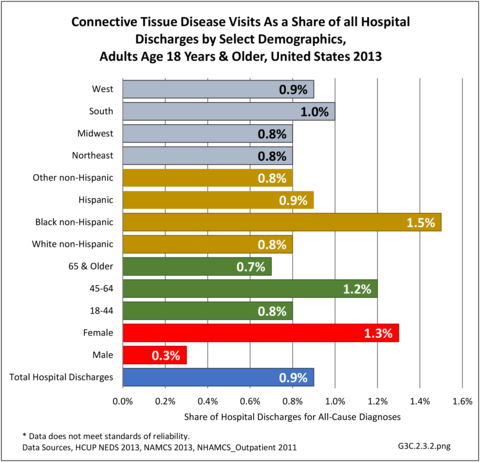
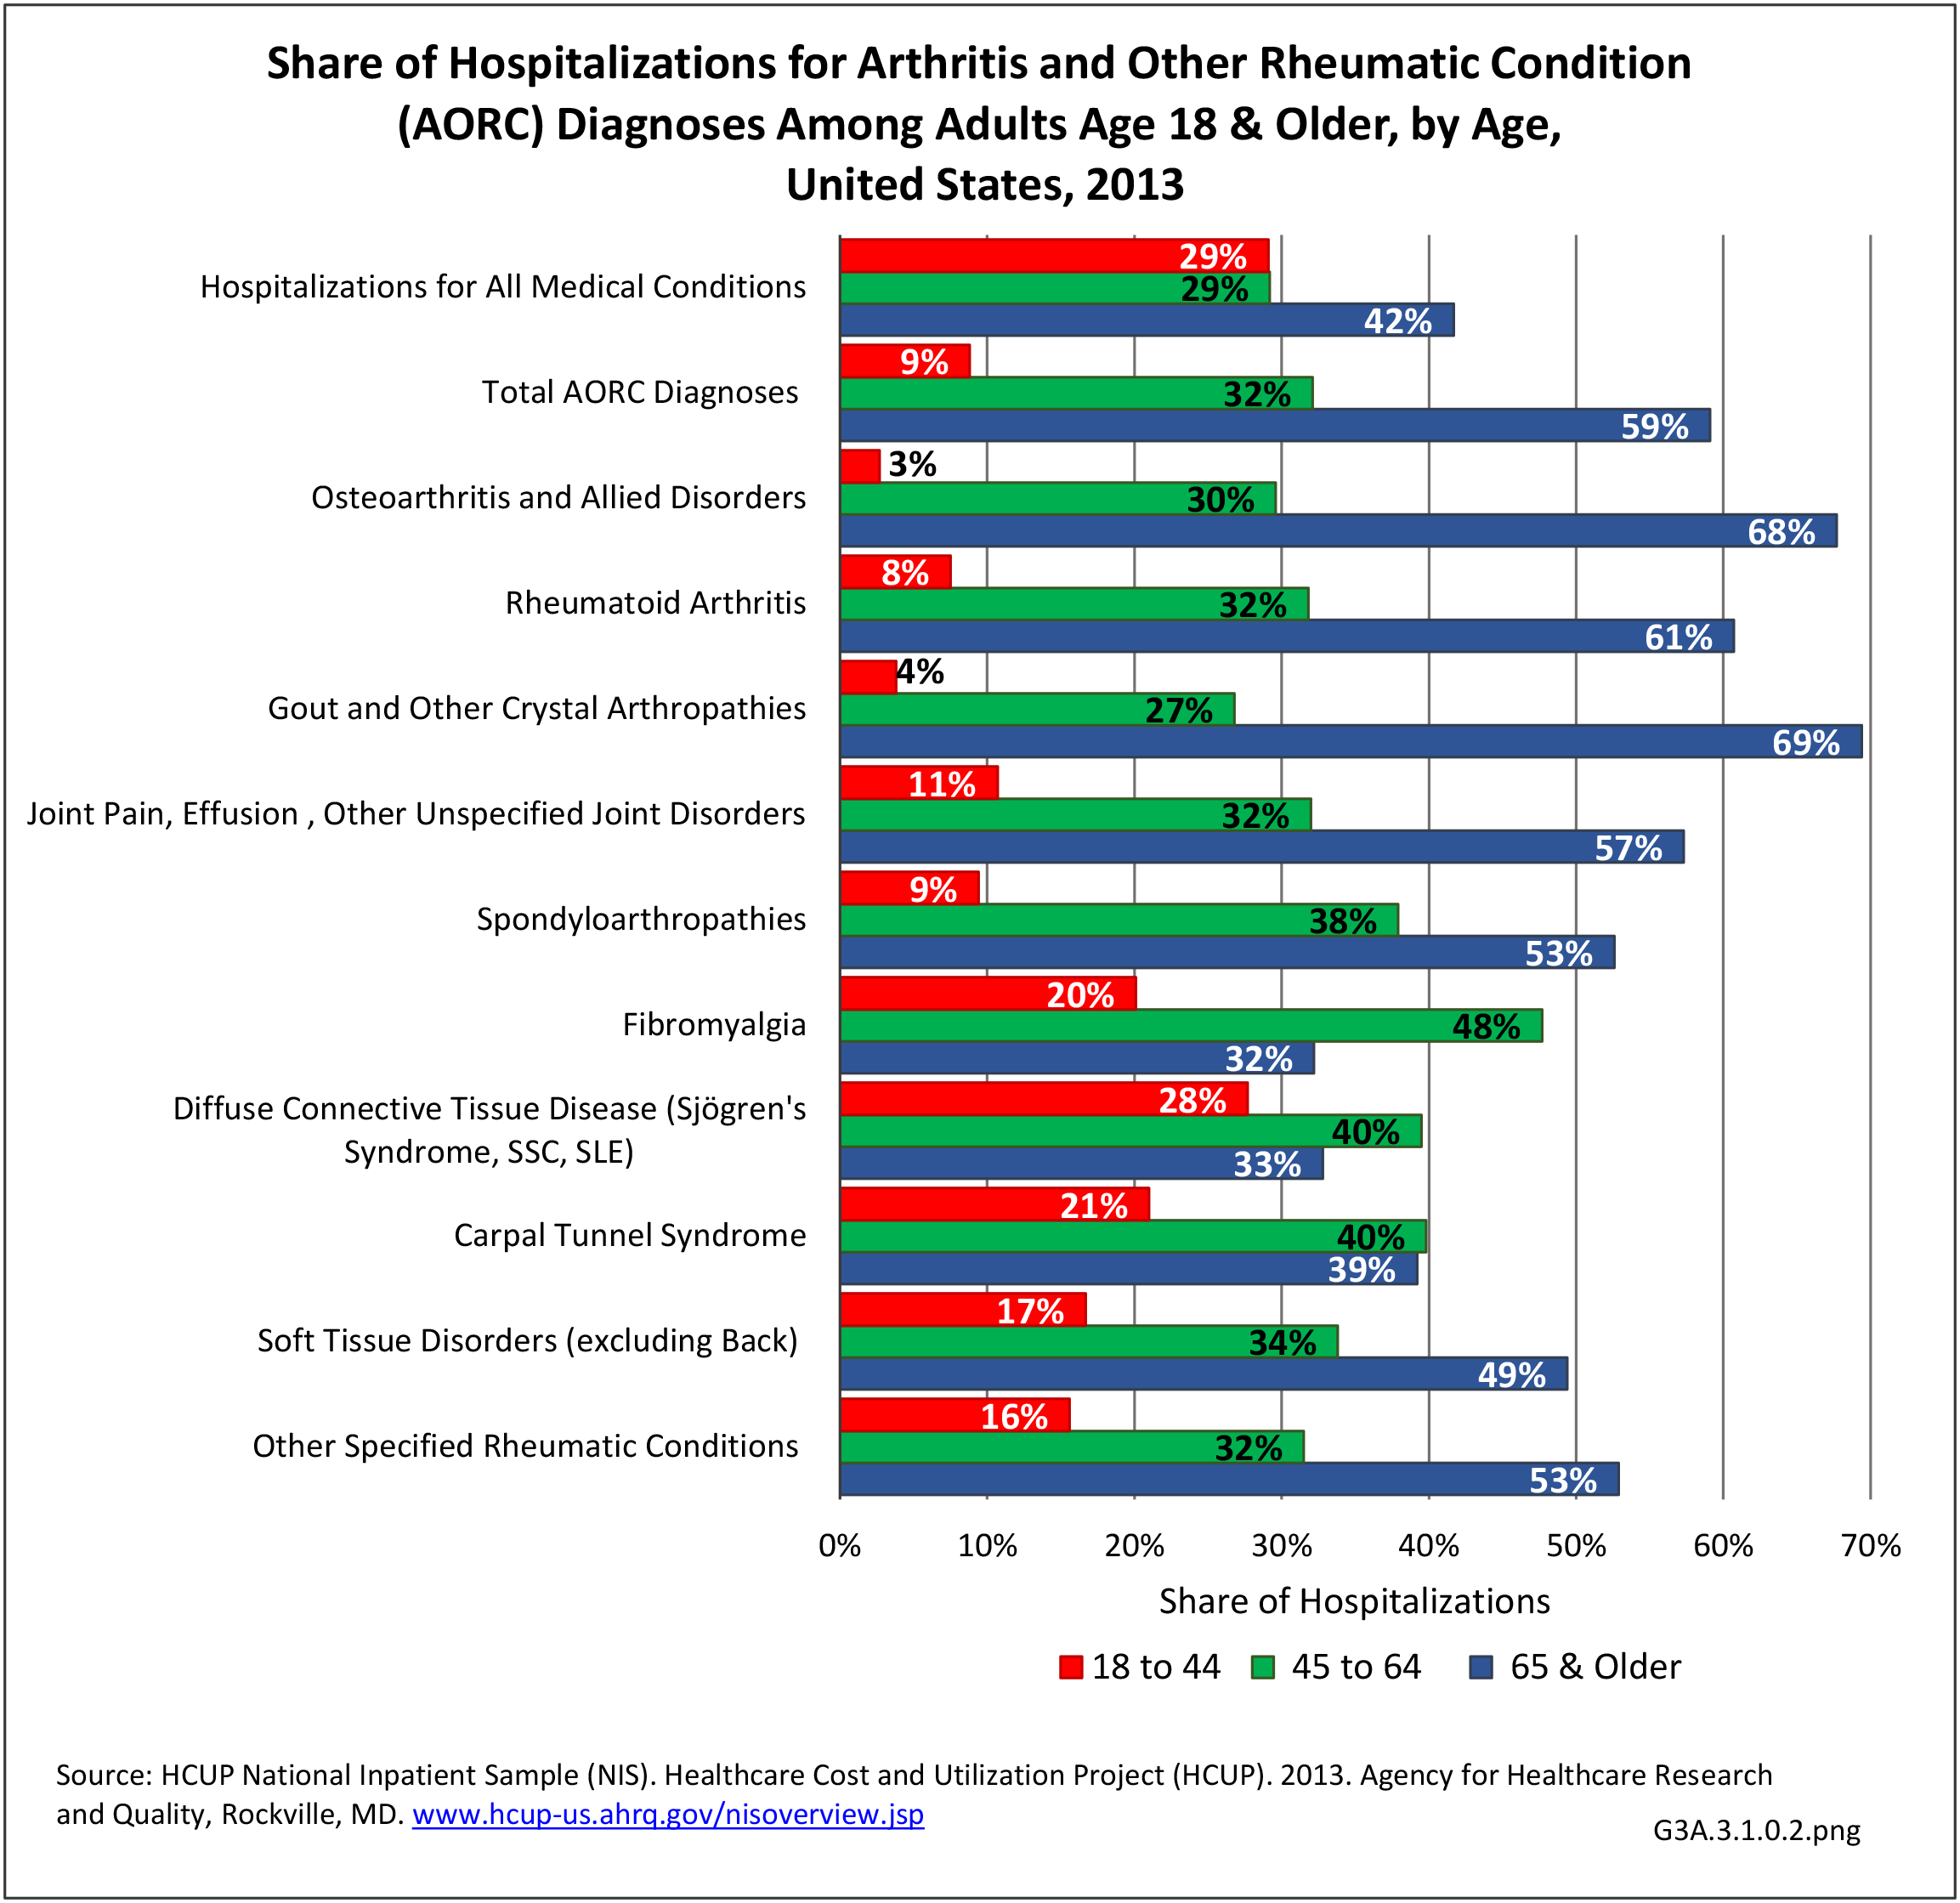
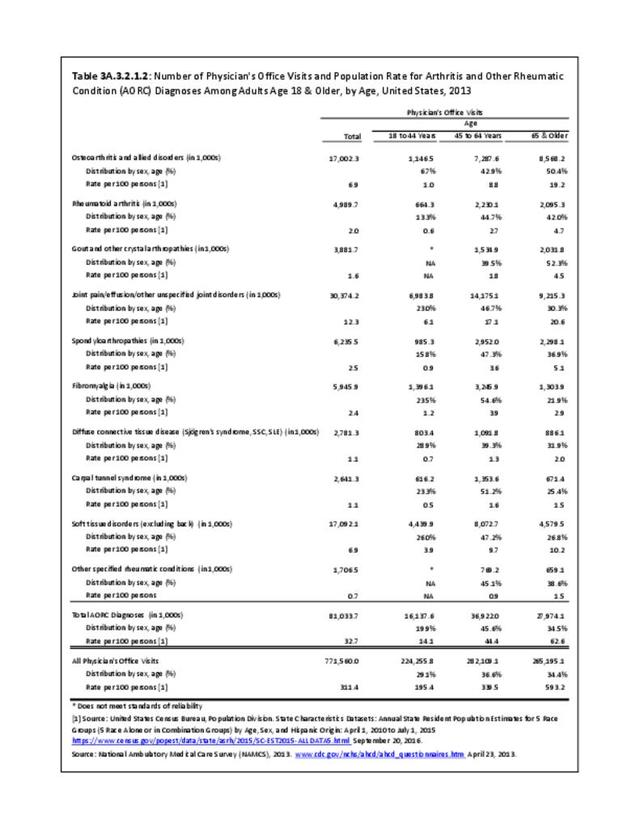
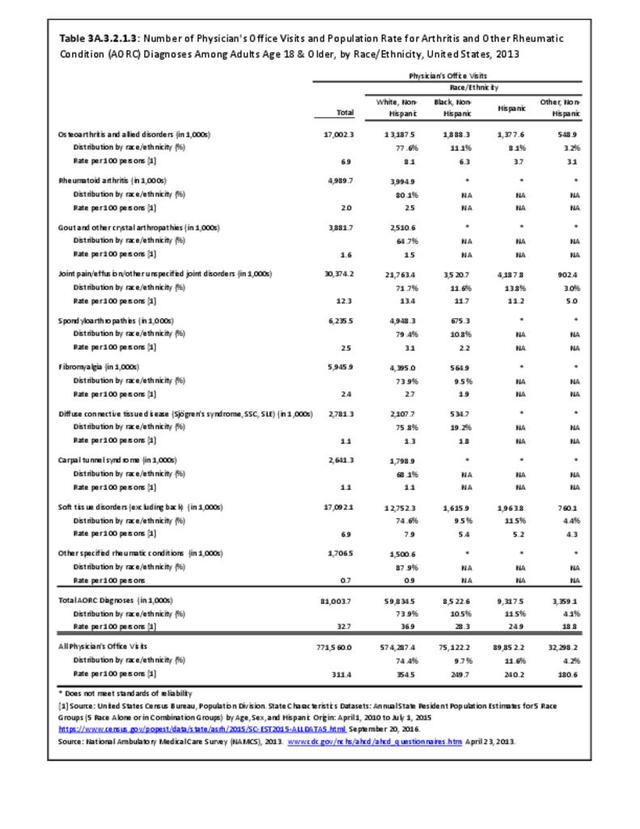
Hospitalizations for CTDs occurred primarily in females, those age 45-64 years, and non-Hispanic blacks compared to all diagnoses discharges. (Table 3A.3.1.0.1 PDF CSV; Table 3A.3.1.0.2 PDF CSV; Table 3A.3.1.0.3 PDF CSV; Table 3A.3.1.0.4 PDF CSV)
Ambulatory Care Visits
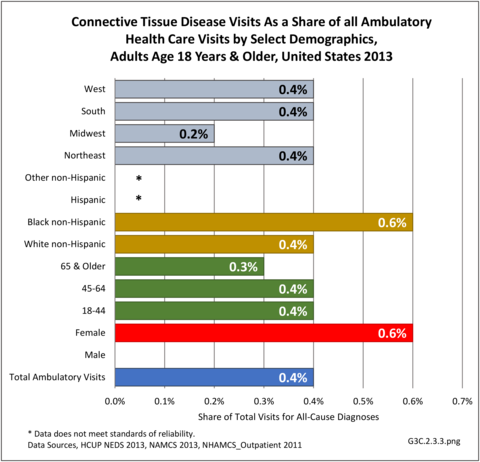
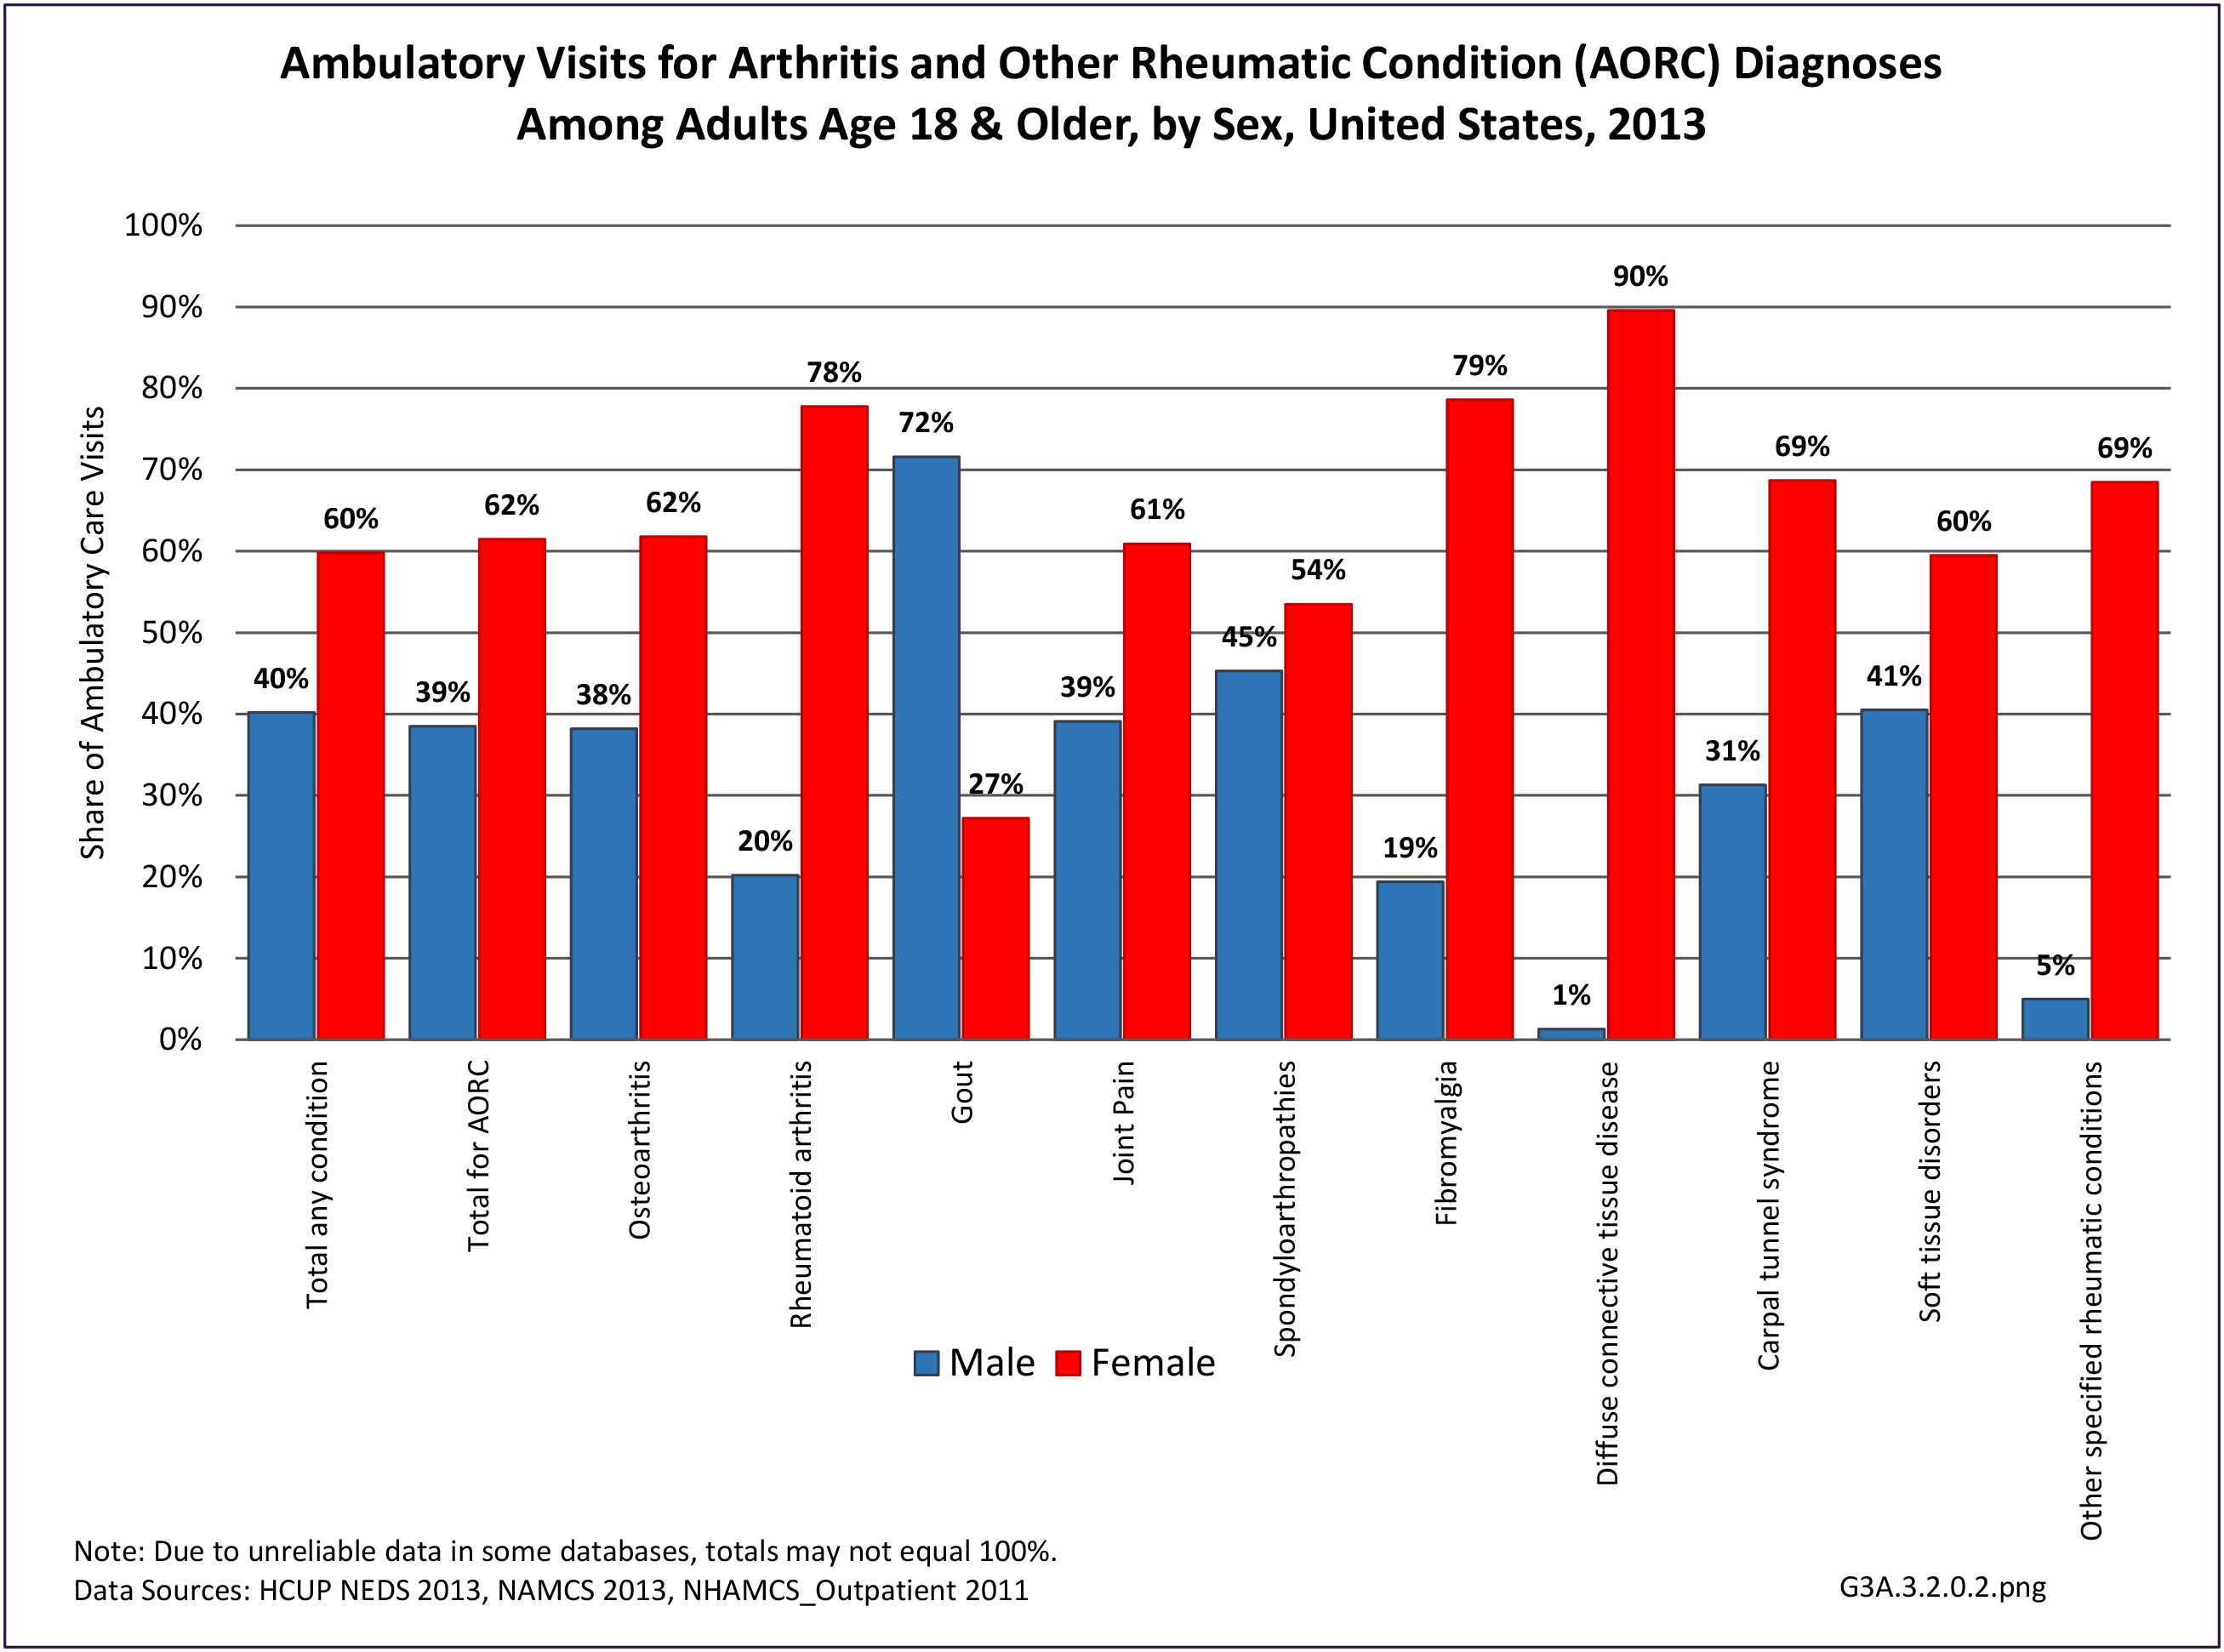
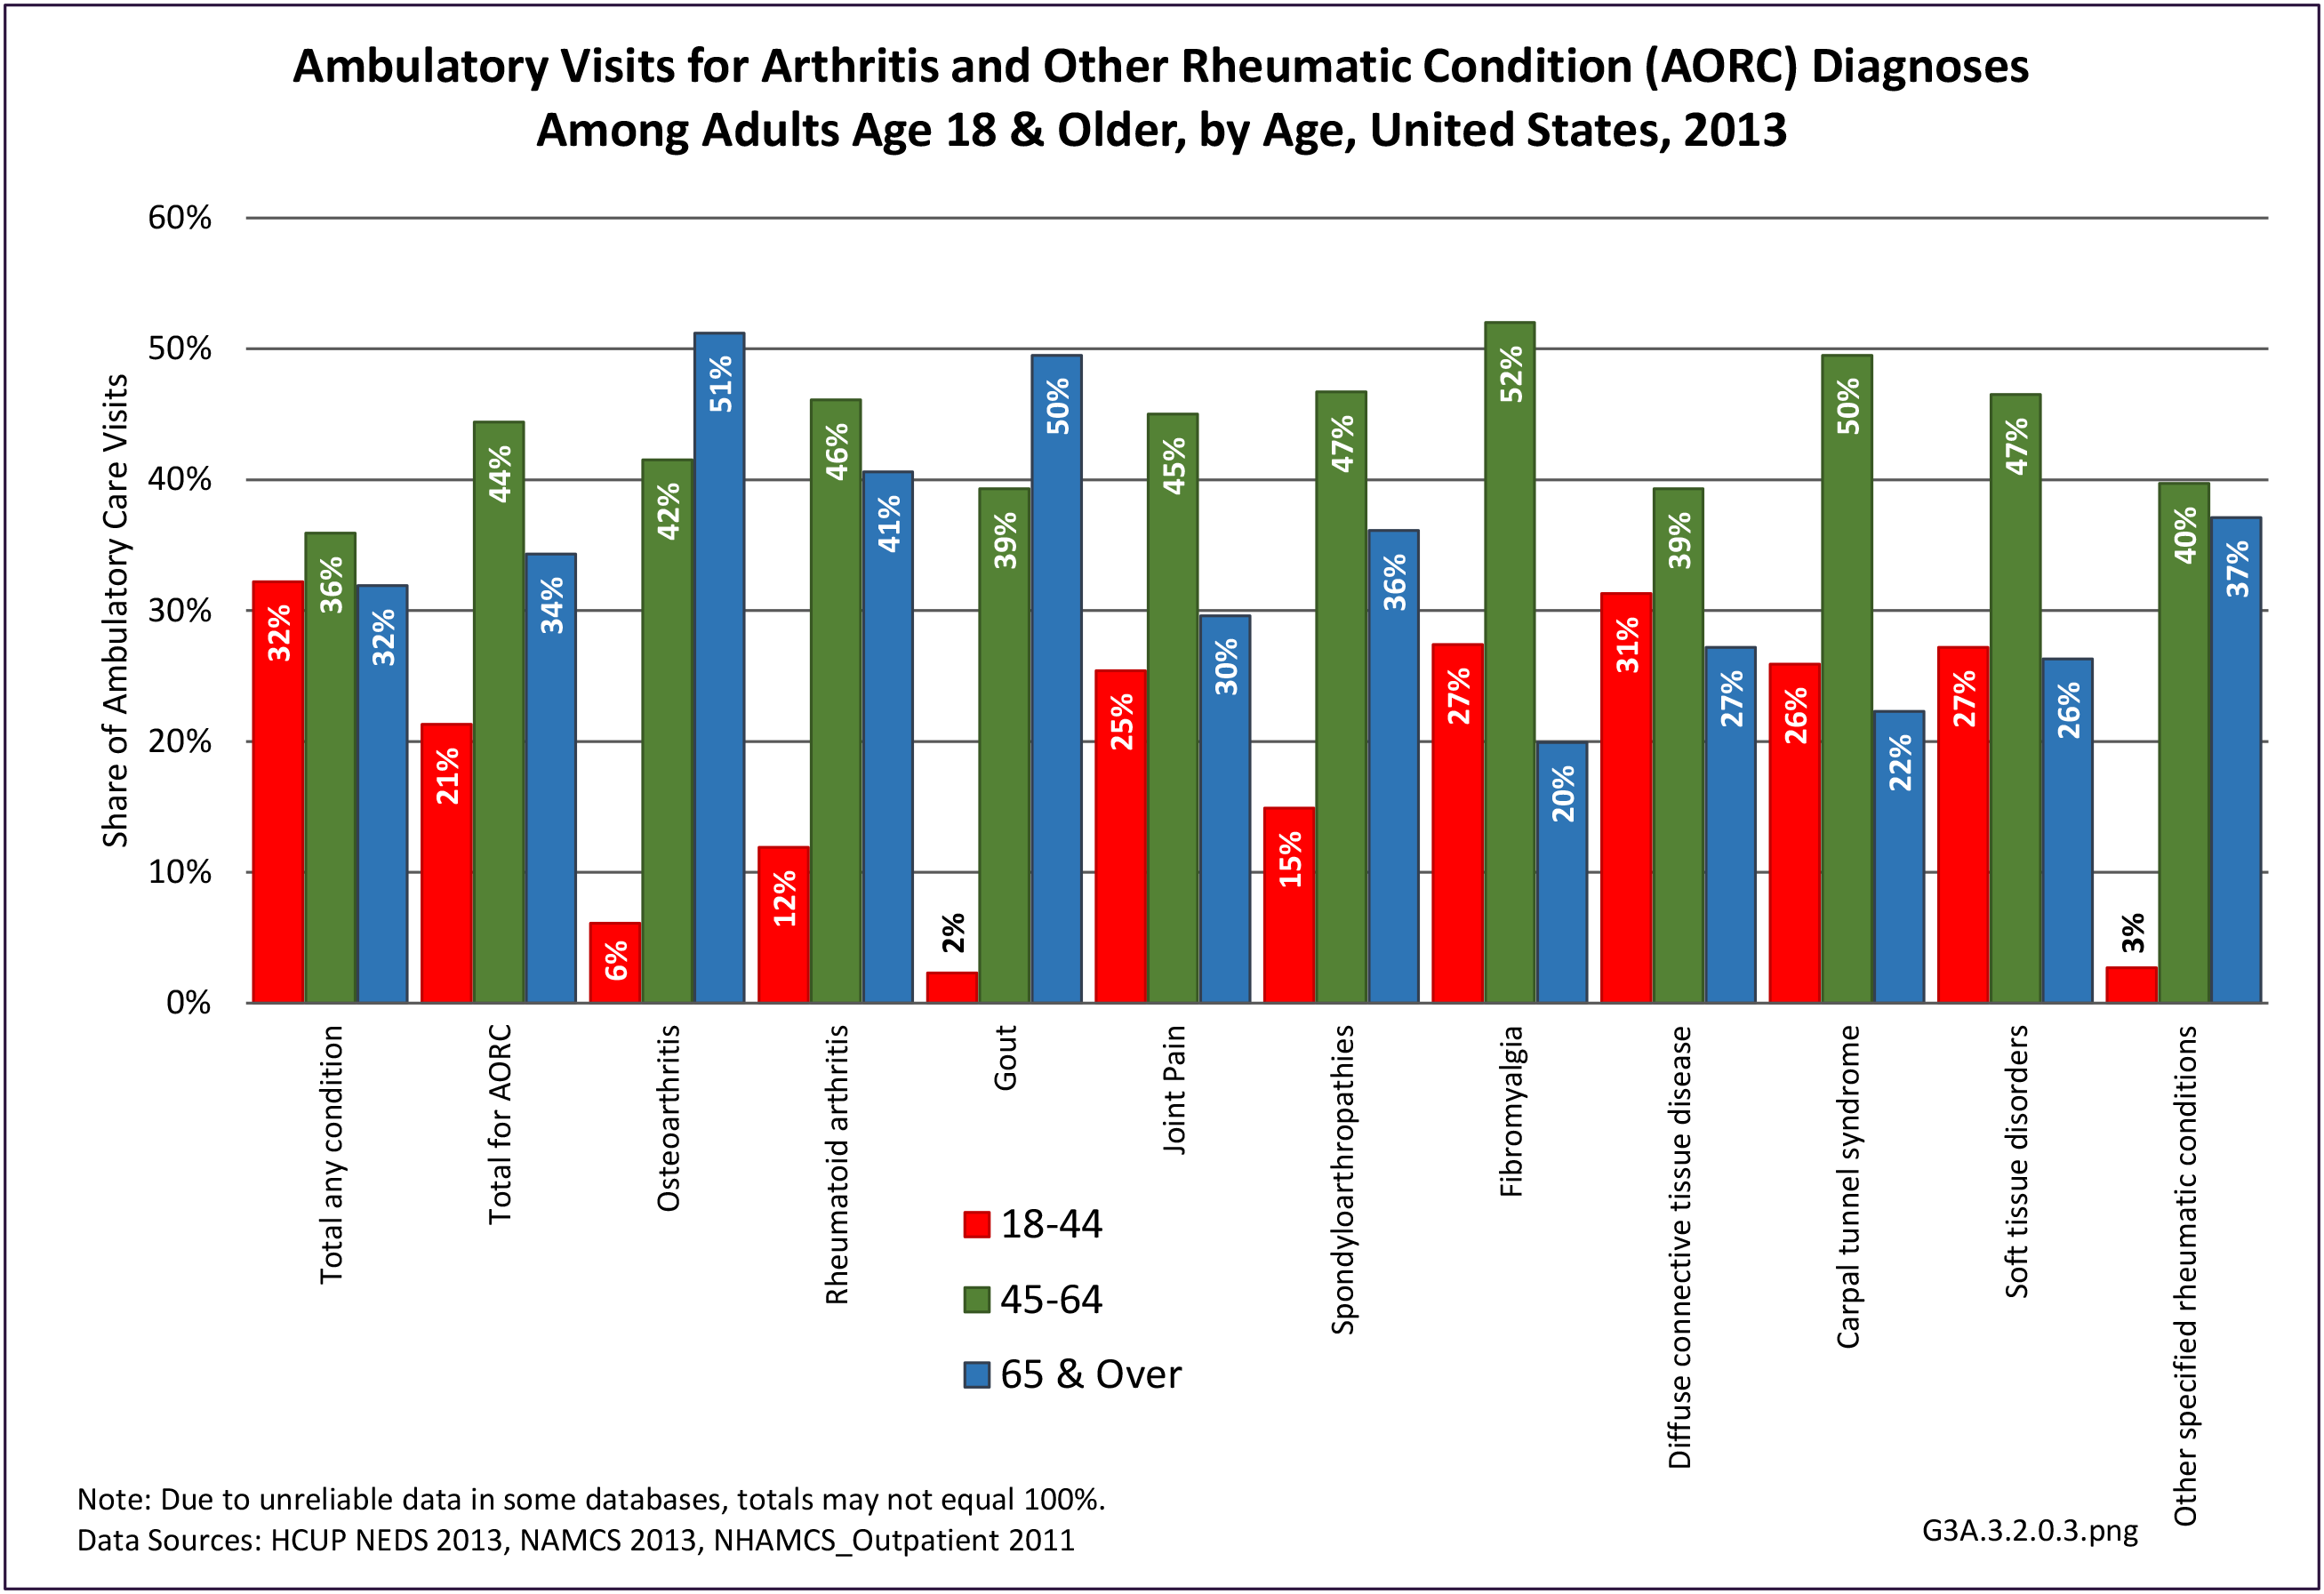
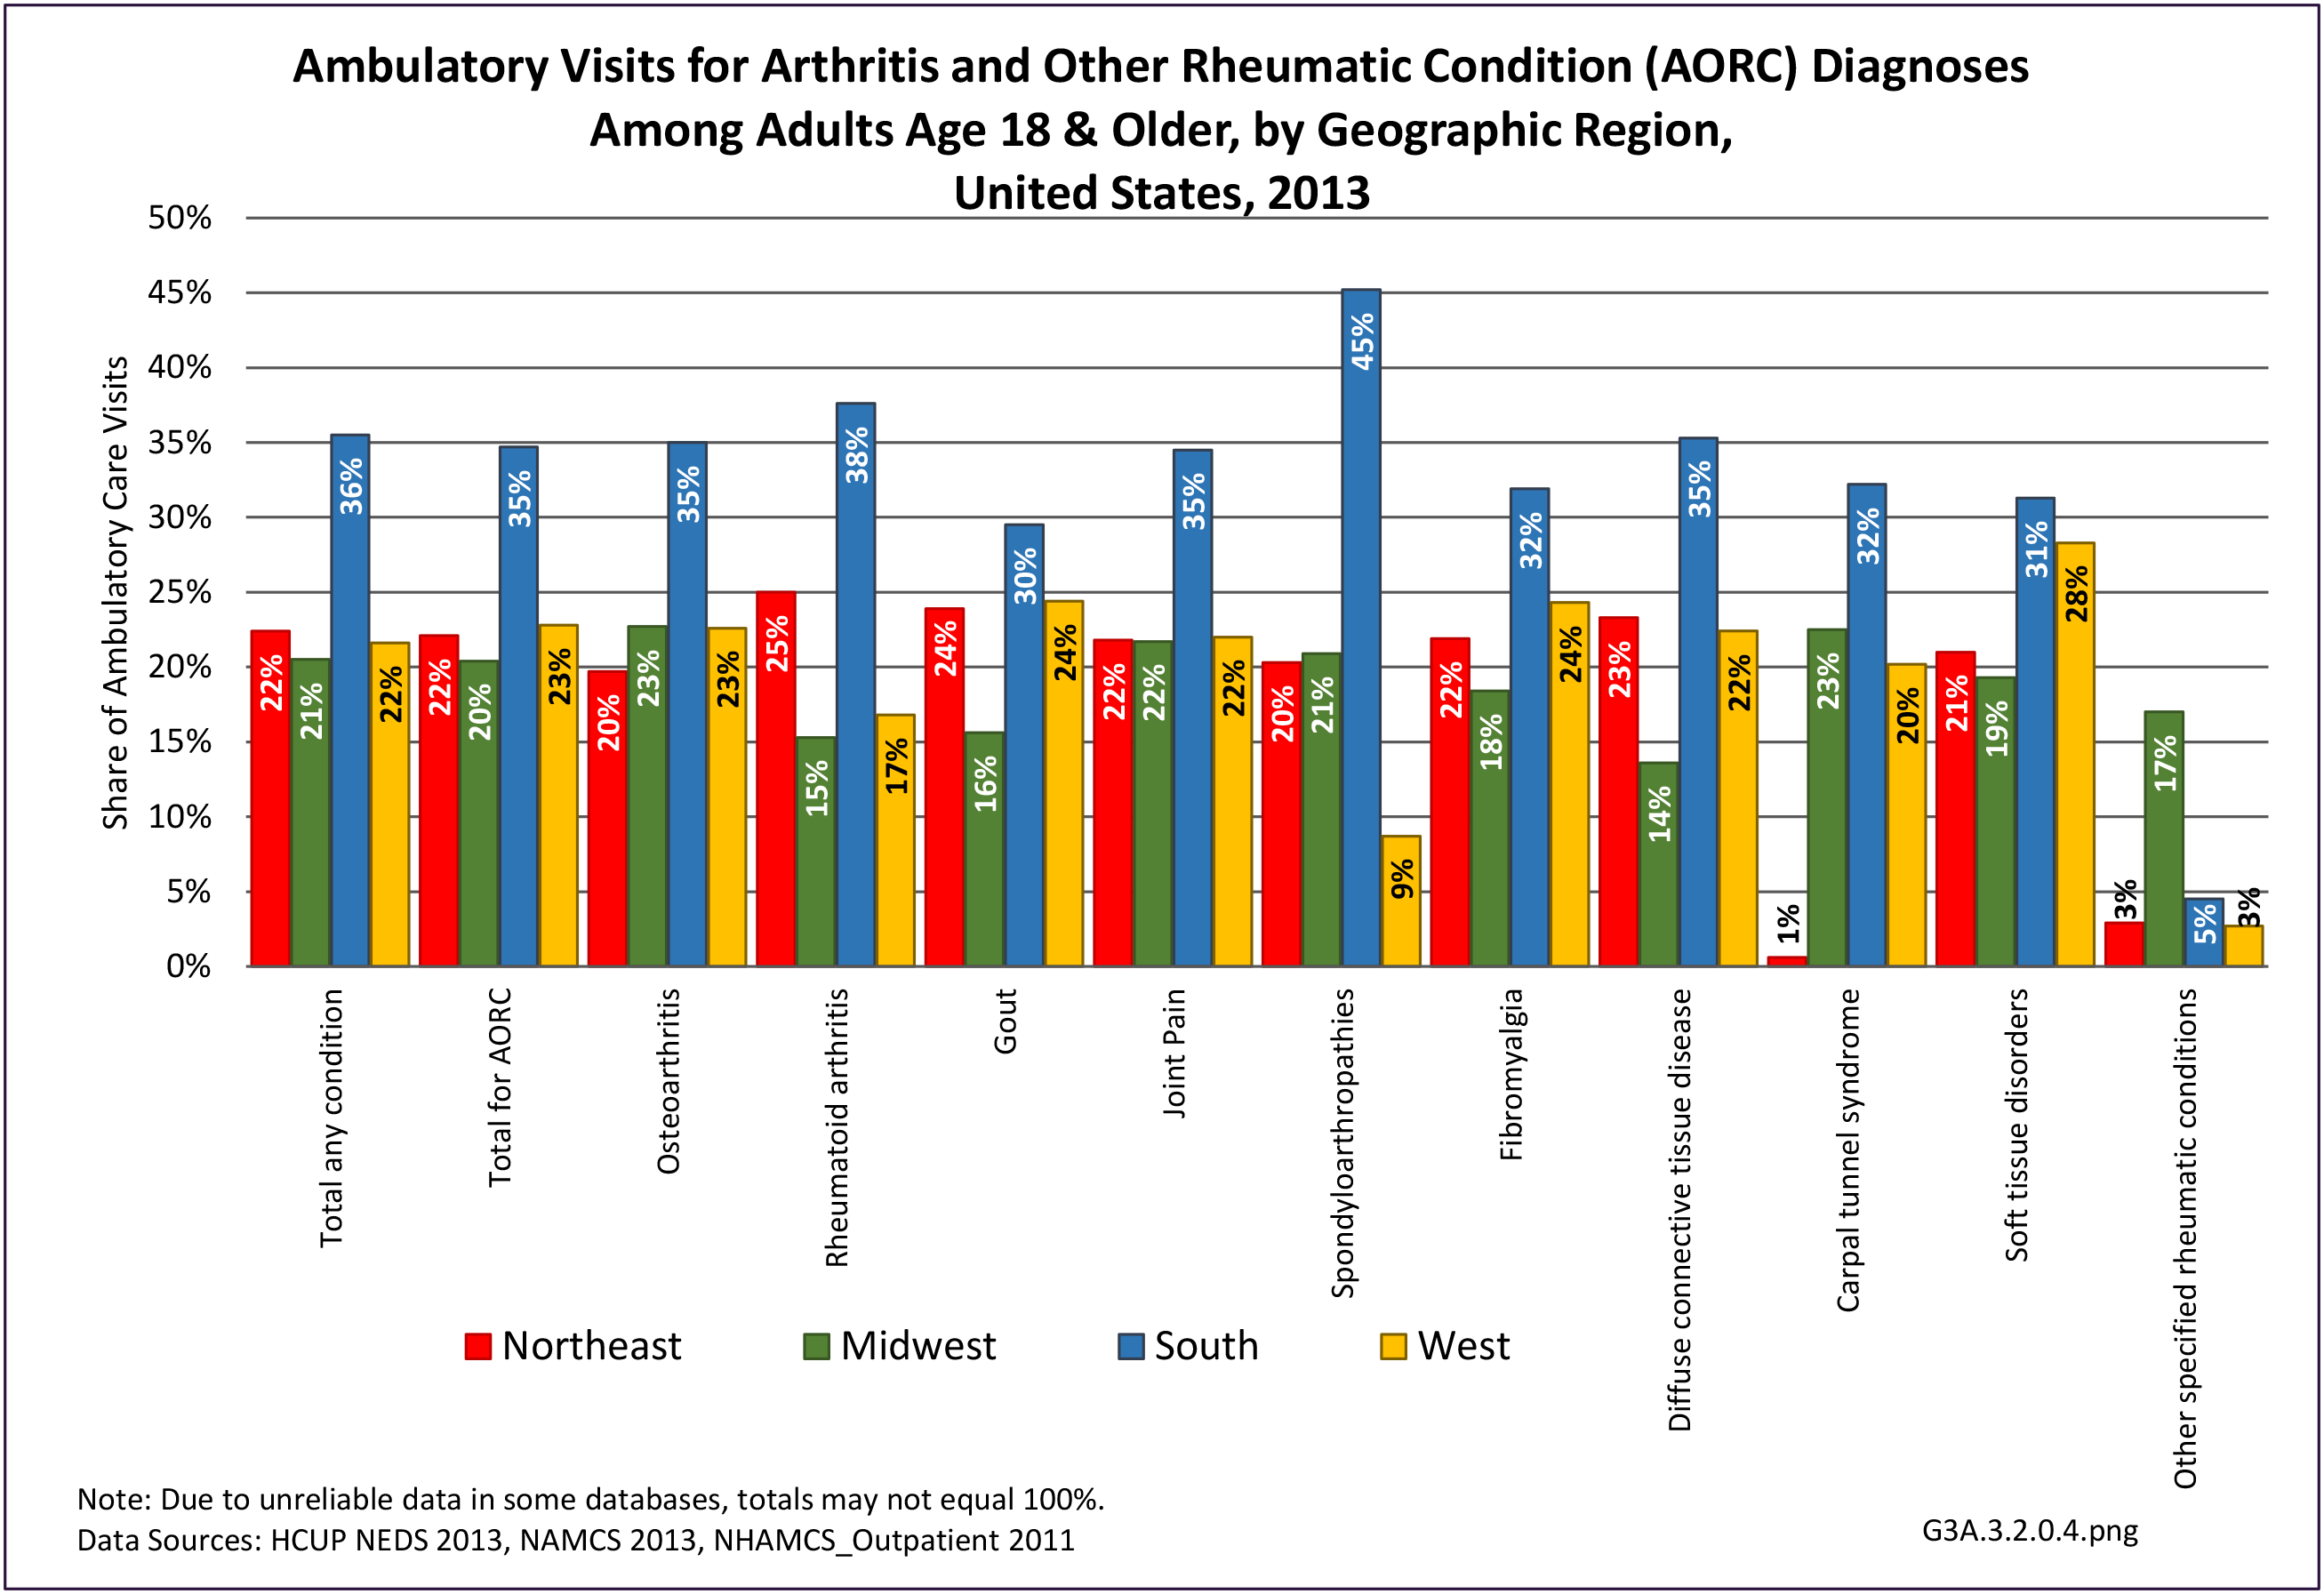
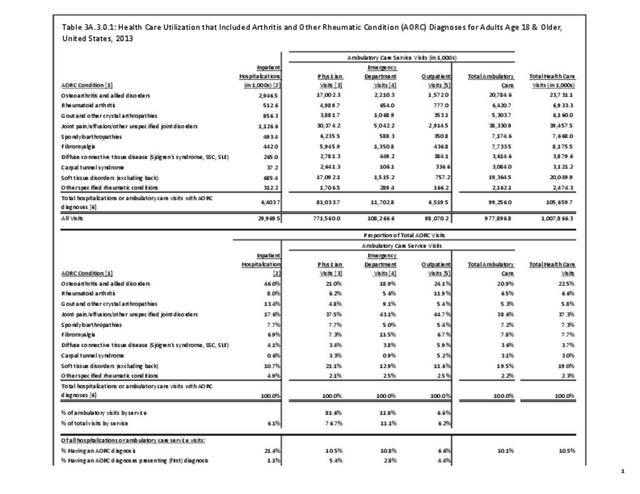
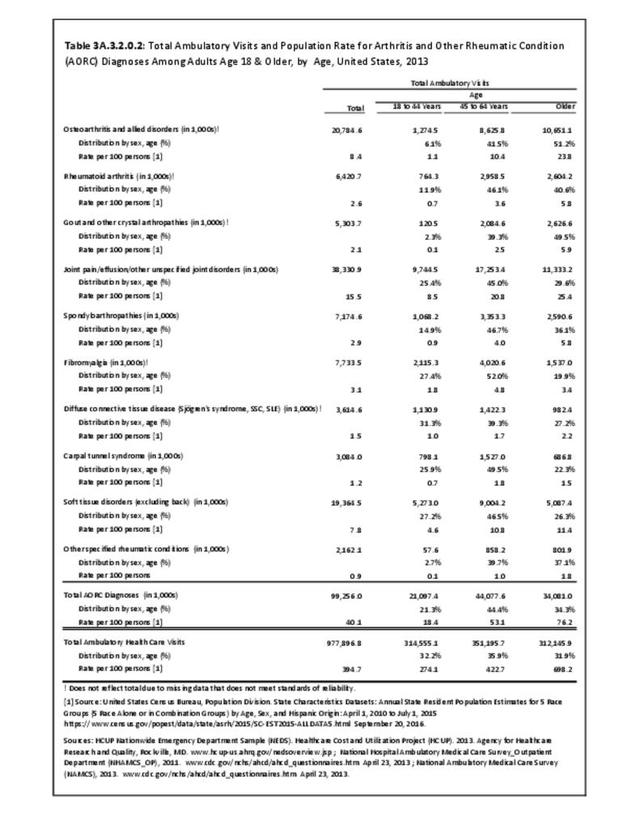
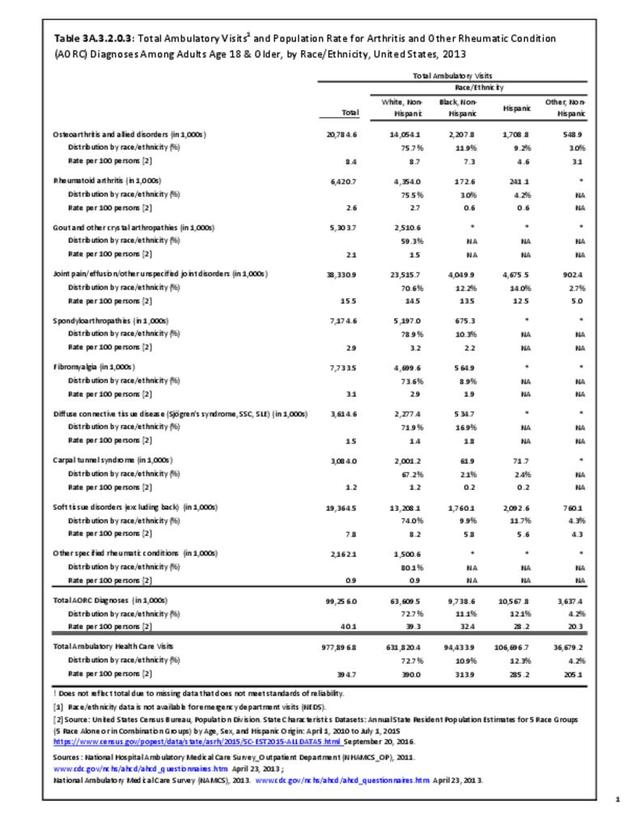
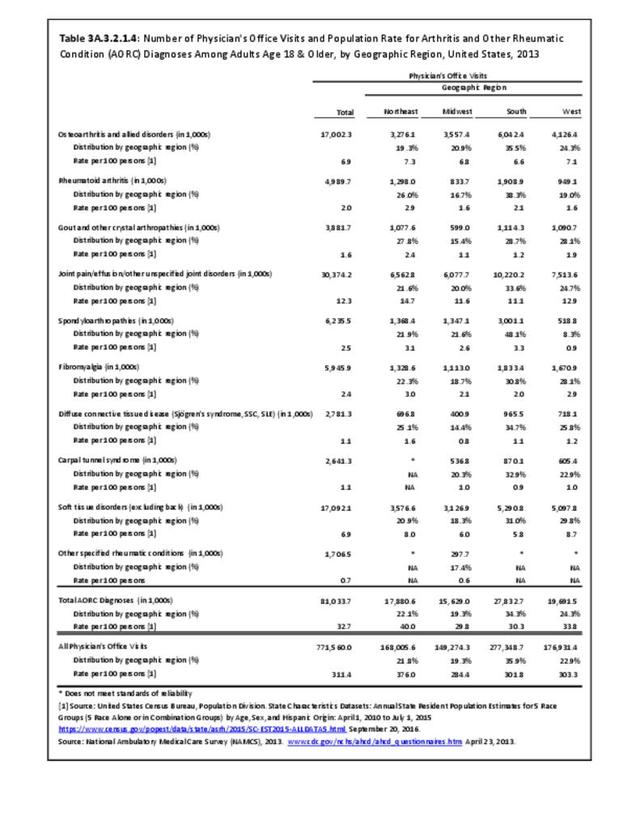
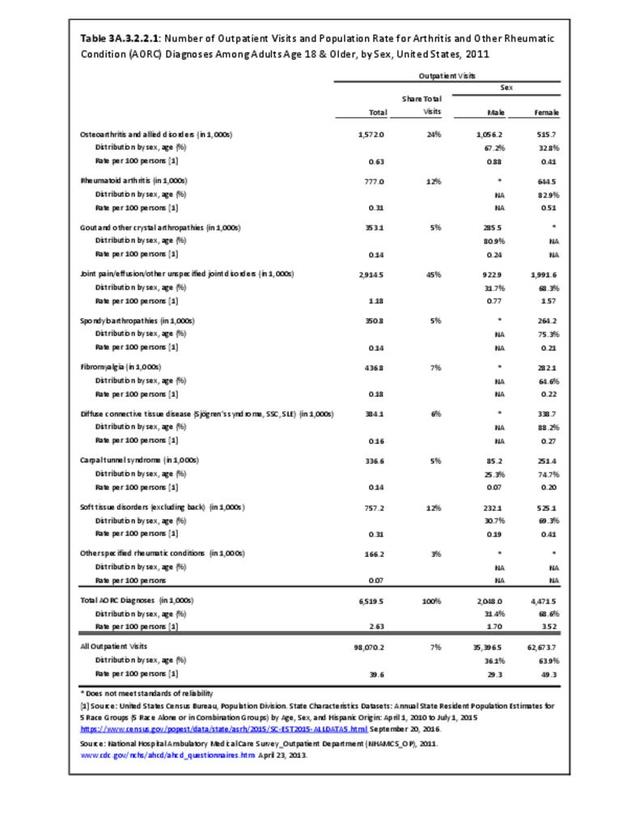
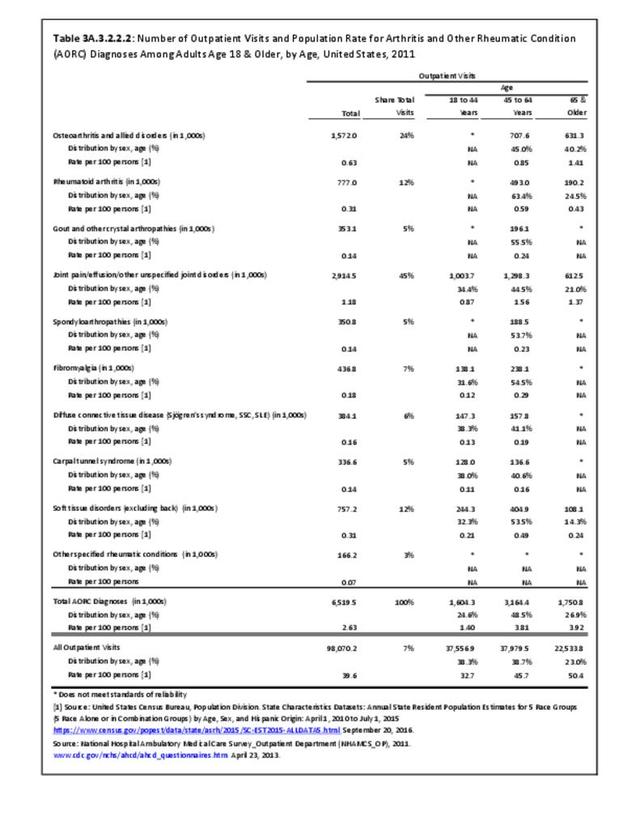
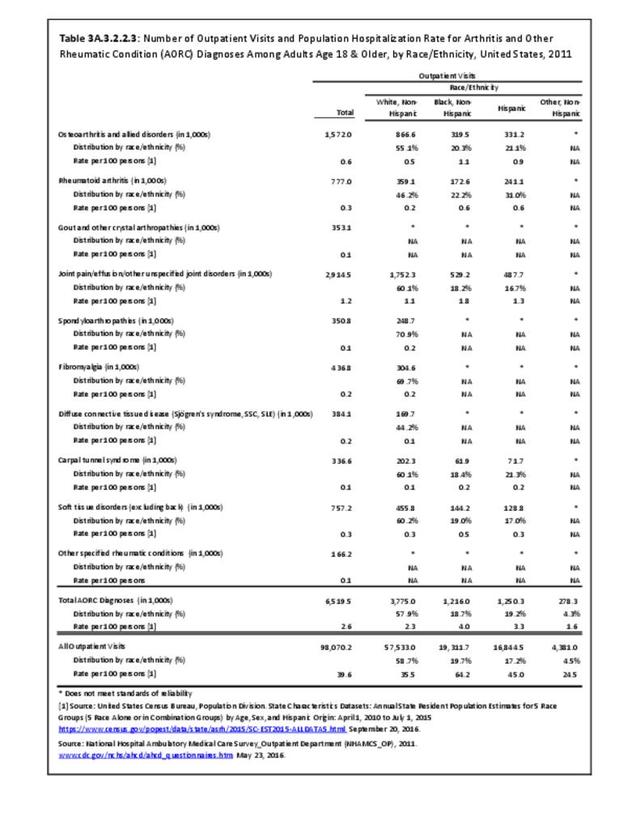
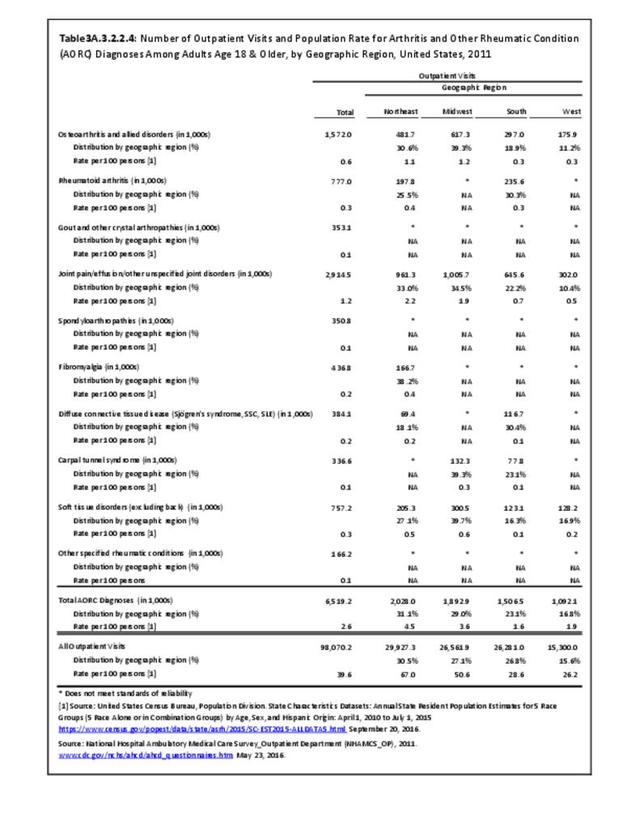
Connective tissue disorders accounted for 0.4% of all diagnoses for ambulatory care visits. The distribution of ambulatory care visits by select demographic characteristics, when compared to all ambulatory visits for CTDs, was highest among females and non-Hispanic blacks, and lowest among those aged 65 years and older and those living in the Midwest. Females accounted for nearly all ambulatory CTD visits. (Reference Table 3A.3.2.0.1 PDF CSV; Table 3A.3.2.0.2 PDF CSV; Table 3A.3.2.0.3 PDF CSV; Table 3A.3.2.0.4 PDF CSV)
Healthcare Utilization from the MEPS
Data from the MEPS, used exclusively in the economic analysis of this report, show higher levels of healthcare visits than the NIS and NAMCS. In particular, the number of ambulatory physician visits is much higher in the MEPS than in the NAMCS. Differences in how conditions are classified and data coded account for some of this, as does the inclusion of ambulatory visits in settings outside a physician’s office (eg, ER or outpatient clinic).
Based on the MEPS, most individuals with a CTD (93%) incurred one or more ambulatory physician visits; among all of those with CTD, the total number of ambulatory physician visits was 9.3 million visits (average visits per person=11.2) annually. Approximately two-thirds (67.9%) of those with CTDs had at least one non-physician care visit, which include physical therapists and alternative care. The average number of non-physician visits per person was 8.5, for a total of 7.0 million non-physician visits nationally. One in five (20.7%) individuals with a CTD were hospitalized and there were 300,000 hospitalizations among all people with CTDs, with an average of 0.4 hospitalizations per person. The percentage with home health care visits was lower (14.4%) than for the other types of visits. However, those with a CTD had an average of 17.1 home health care visits per year for a total of 14.2 million visits nationally. Furthermore, those who did have a home health visit had very high home health visit utilization, with an average of 119 visits annually (data not shown). Finally, almost all individuals with a a CTD filled a prescription medication (95.8%); the total number of prescription fills each year was 39.5 million, based on average prescription fills among all of those with CTD of 47.7 fills. (Reference Table 8.20 PDF CSV)
Economic Burden
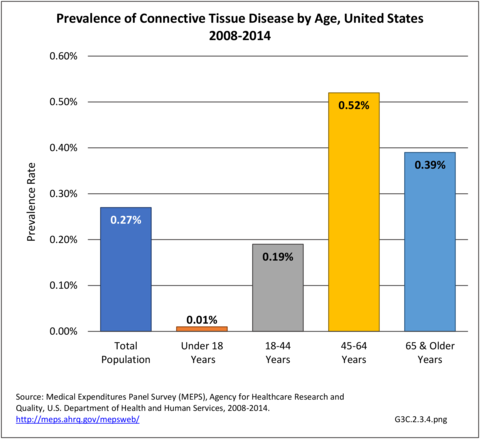
From 2008-2014, an estimated 800,000 individuals (0.27%) in the US population had a CTD annually. Across all age groups, middle age adults (45-64 years) represented the largest percentage of those with a CTD (52% or 430,000), followed by younger adults (18-44 years) (26% or 219,000 individuals), older adults (≥ 65 years) (21% or 173,000) and children (18 years) (1% or 8,000 individuals). These numbers translate into prevalence rates shown in the graph below. (Reference Table 8.19 PDF CSV; Table 8.21 PDF CSV)
Females comprised the majority of those with a CTD (767,000); at least 400,000 individuals in the following groups had a CTD: those with any limitation in IADLS, ADLs, functioning, work, housework, school, vision, or hearing (597,000); non-Hispanic Whites (542,000); those with any private insurance (503,000); and those with any limitation in work, housework, or school activities (453,000). (Reference Table 8.21 PDF CSV)
Direct Medical Costs
Among all individuals with a CTD, ambulatory care represented 32% of all direct costs, followed by inpatient care (28%), prescriptions (25%), and residual costs (15%). The distribution across service category varied substantially across socio-demographic and health status characteristics suggesting very different treatment and utilization patterns across these groups. For example, there were regional differences: among those in the Northeast, ambulatory care, inpatient care, prescriptions, and other costs represented 40%, 11%, 21%, and 28%, respectively whereas in the Midwest, these categories represented 25%, 24%, 44%, and 7% of all costs, respectively.
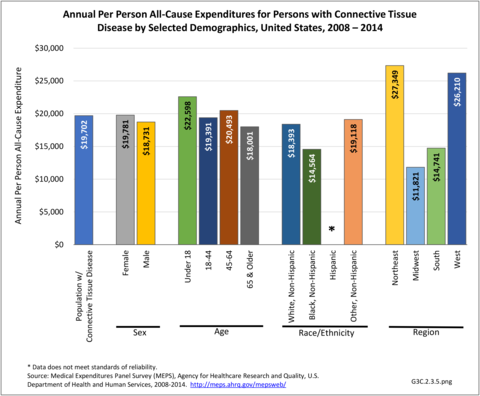
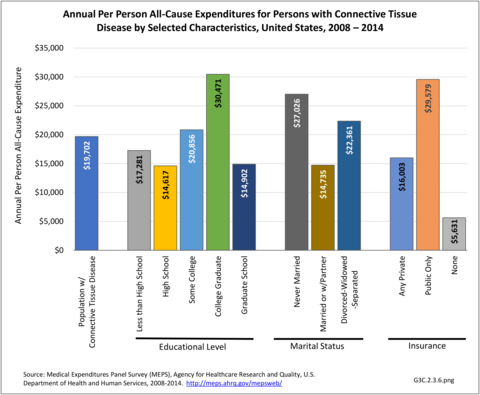
Among all individuals with a CTD, all-cause annual per person costs were $19,702. The five groups with the highest all-cause per person costs were those who were college graduates ($30,471), had public health insurance only ($29,579), lived in the Northeast ($27,349), had never married ($27,026), or reported any limitation in work, housework, or school activities ($27,024).
The five groups with the lowest all-cause per person costs were those with no health insurance ($5,631), lived in the Midwest ($11,821), were Non-Hispanic black ($14,564), had a high school education but no college education ($14,617), or were married/had a partner ($14,735). (Reference Table 8.21 PDF CSV)
Indirect Costs
Indirect costs (earnings losses) were not calculated for CTDs due to small numbers of cases.
- 1. a. b. c. d. Gaubitz M. Epidemiology of connective tissue disorders. Rheumatology October 2006:45(supp 1);iii3-iii4. https://doi.org/10.1093/rheumatology/kel282.
- 2. Dall’Era M. Systemic lupus erythematosus. In: Imboden JB, Hellman DB, Stone JH. (Eds). Current Rheumatology Diagnosis and Treatment. 3rd ed. New York, NY:McGraw-Hill; 2013.
- 3. American College of Rheumatology. Sjögren’s syndrome. https://www.rheumatology.org/I-Am-A/Patient-Caregiver/Diseases. Accessed October 24, 2017.
- 4. Lupus Foundation of America, National Resource Center on Lupus. https://resources.lupus.org/entry/facts-and-statistics. Accessed October 24, 2017.
- 5. Mayes MD, Lacey JV Jr, Beebe-Dimmer J, et al. Prevalence, incidence, survival, and disease characteristics of systemic sclerosis in a large US population. Arthritis Rheum 2003;48(8):2246-2255.
- 6. Mayes MD. Scleroderma epidemiology. Rheum Dis Clin North Am. 2003, 29: 239-254.
- 7. Barnes J, Mayes MD. Epidemiology of systemic sclerosis: incidence, prevalence, survival, risk factors, malignancy and environmental triggers. Curr Opin Rheumatol 2012;24(2):165-170.
Edition:
- Fourth Edition

