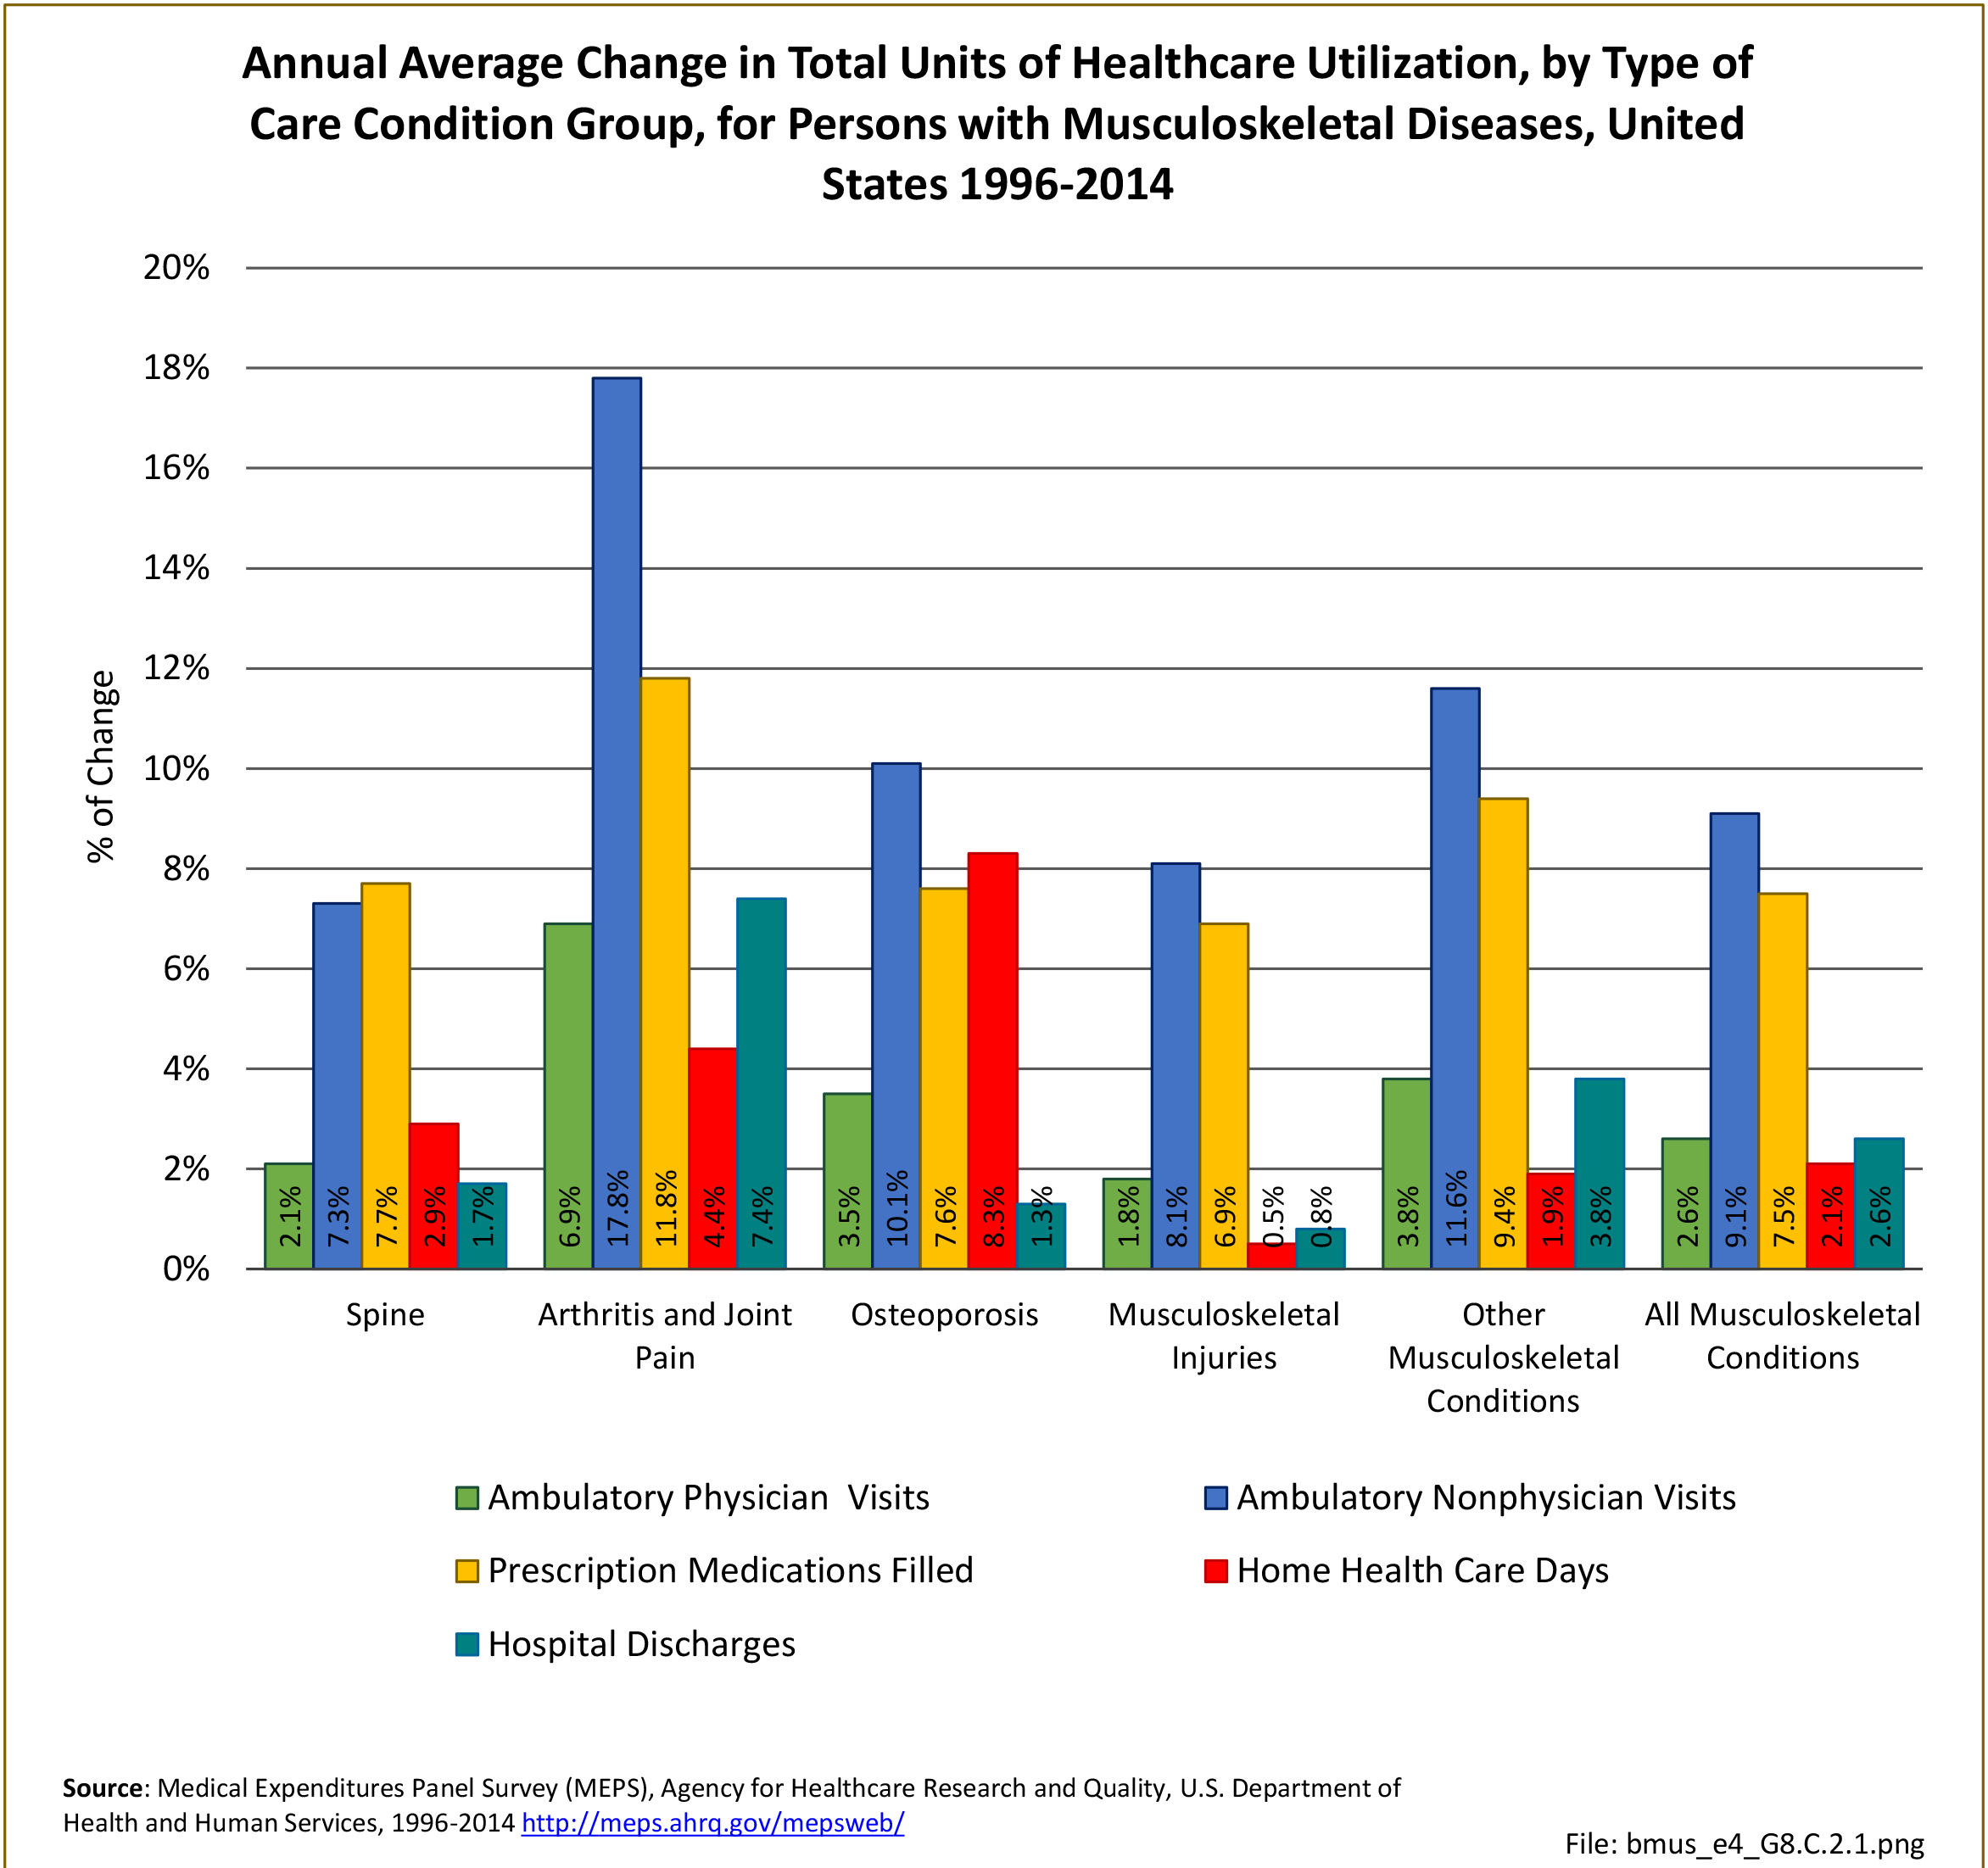
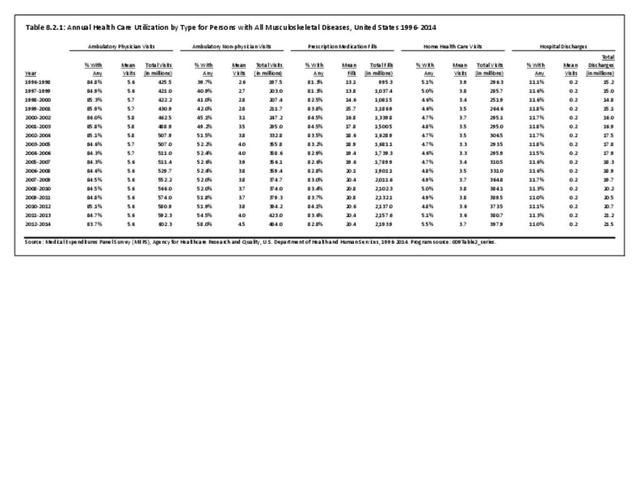
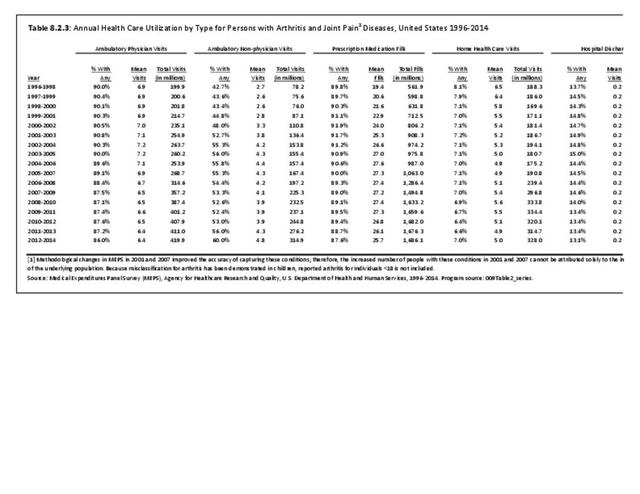
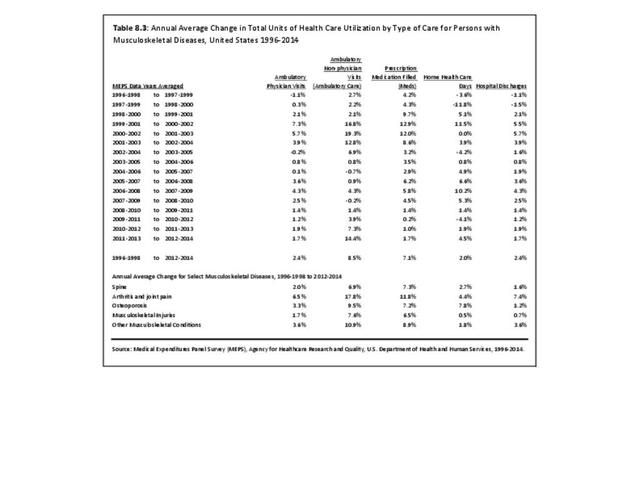
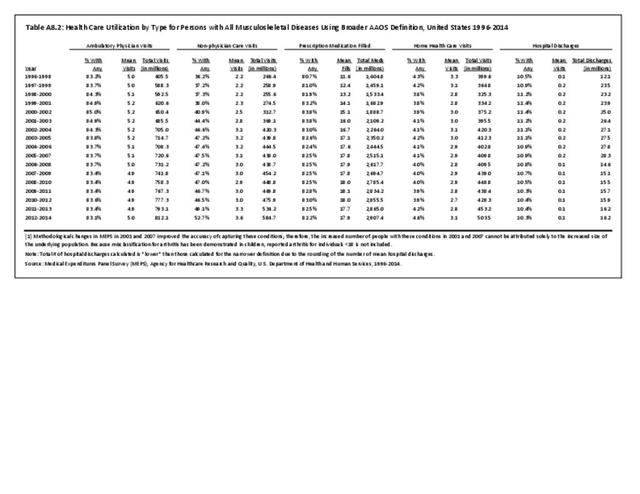
Over the annual 3-year average periods, 1996-1998 to 2012-2014, for which the MEPS data is analyzed, ambulatory non-physician care visits show the greatest increase, both in share (%) of population reporting such a visit and in total visits. While the proportion of the population with a prescription filled remained steady at just over 80%, prescription medications filled increased in total number due to population increases and the rise in mean number of prescriptions filled. The total number of prescriptions filled showed an average annual increase of 7.5%, while the mean number of prescriptions filled showed an annual increase of 3.5%. Ambulatory physician visits and hospital discharges both increased by 2.6% annually over the seventeen-year period from 1996-1998 through 2012-2014. (Reference Table 8.2.1 PDF CSV)

Ambulatory Visits
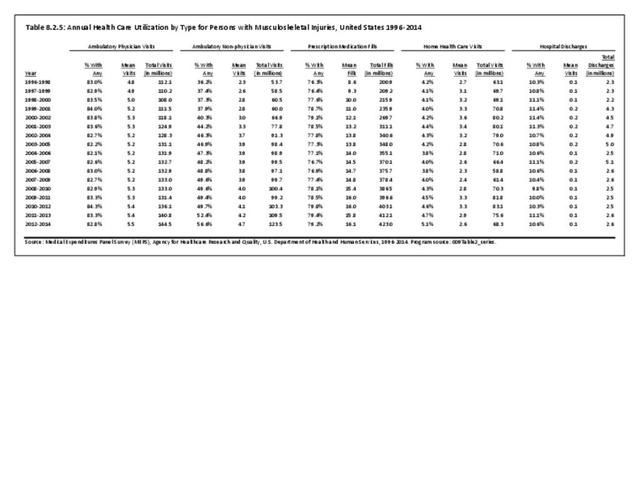
Persons with musculoskeletal diseases account for a large and growing share of healthcare utilization. In any given year, about 85% of persons with musculoskeletal diseases have at least one ambulatory care visit to a physician's office, averaging just under six such visits per year. Between 1996-1998 and 2012-2014, ambulatory physician visits for these individuals increased from 425.5 million to 602.3 million. Growth in the number of persons with musculoskeletal diseases, rather than an increase in the number of visits by individuals, is primarily responsible for this increase.
Non-Physician Ambulatory Care Visits
In contrast to the relatively stable number of physician office visits per person with a musculoskeletal condition, there was an increase in the proportion of the US population with visits to ambulatory providers other than physicians. The average number of visits to non-physician providers by persons with musculoskeletal diseases also increased. Non-physician ambulatory healthcare providers include physical therapists, occupational therapists, chiropractors, social workers, physician assistants, nurse practitioners, and other related healthcare workers. In 1996-1998, approximately 40% of persons with musculoskeletal diseases visited a non-physician healthcare provider at least once; by 2012-2014, the proportion had jumped to 58.0%. At the same time, the average number of such visits increased from 2.6 per person to 4.5. The result was more than a doubling, from 197.5 million to 484.0 million, in total non-physician ambulatory care visits between 1996-1998 and 2012-2014.
Prescription Medications Filled
During this same time frame of 1996-1998 through 2012-2014, the use of prescription medications among persons with musculoskeletal diseases rose substantially. While the proportion of persons with a musculoskeletal disease who filled at least one prescription ranged 81% to 84% over the 17-year period, the mean number of prescriptions filled per person steadily increased from 13.1 to 20.4 mean fills. The result was a more than doubling, from 995.3 million in 1996-1998 to nearly 2.2 billion in 2012-2014, in the number of prescription medications filled by persons with a musculoskeletal disease.
Home Health Care Visits
Despite widespread concerns that an aging population would use an increasing amount of home health care, there is no evidence that this is occurring. Both the proportion of persons with a musculoskeletal disease using home health care and the average number of home health care visits remained low with little change over the 1996-1998 through 2012-2014 period. Only 5.5% of persons reported any home health care visits in 2012-2014, with an average of 3.7 visits. The total number of home health care visits to persons with a musculoskeletal disease rose from 296.3 million to 397.9 million, entirely due to population increase.
Hospital Discharges
An increase of more than 40%, from 15.2 to 21.5 million, in the number of hospital discharges for persons with a musculoskeletal disease occurred in the periods 1996-1998 to 2012-2014. This may be due to the aging population. The percentage of persons with a musculoskeletal disease who were hospitalized one or more times in a year was roughly stable, with 11% to 12% of persons with these conditions hospitalized annually in 1996-1998 to 2012-2014 period. The average number of hospitalizations per person, at 0.2, did not change.
Expansive Definition of Healthcare Utilization
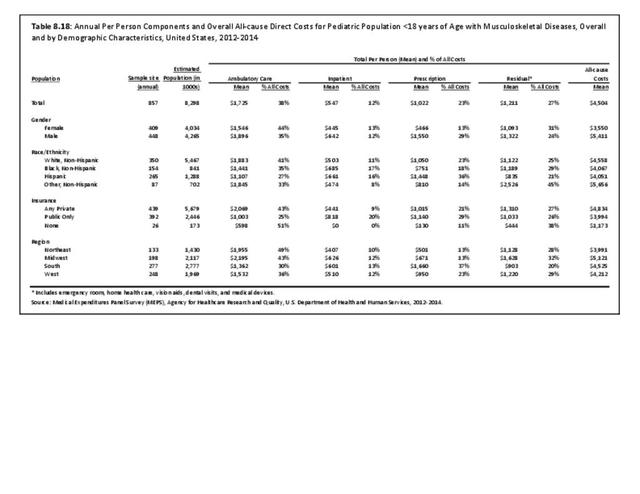
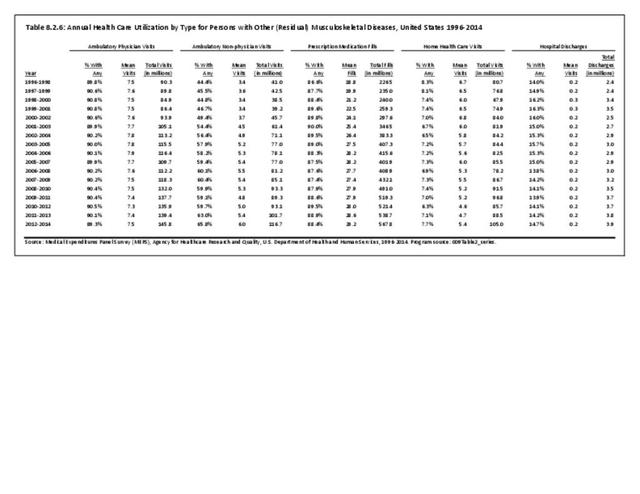
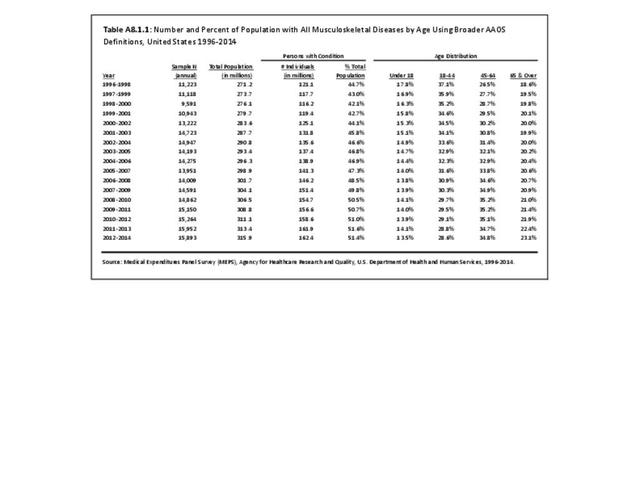
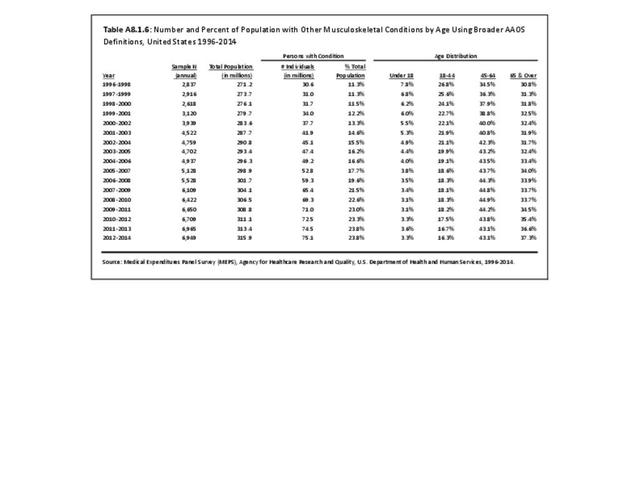
Using the more expansive definition of musculoskeletal diseases, in 2012-2014 there were an estimated 812.1 million visits to physicians among persons with these diseases, as well as 584.7 million ambulatory visits to providers other than physicians, 2.9 billion prescriptions filled, 503.5 million home care visits, and 16.2 million hospital discharges. It should be noted that in this expansive definition, the number of ambulatory visits per person to providers other than physicians and the number of medications per person has risen dramatically. (Reference Table A8.2 PDF CSV)
Edition:
- Fourth Edition