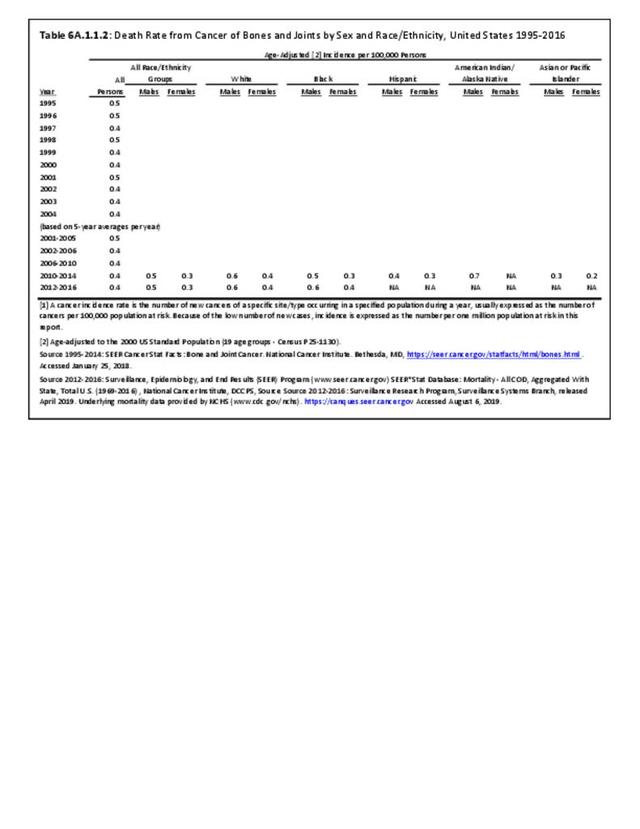
Annual population-based mortality rates due to cancers of bones and joints are low, averaging four deaths per one million people since the early 1990s.1 While the mortality rate from bone and joint cancer dropped by approximately 50% from that of the late 1970s, no significant improvement in this rate has been observed over the past 20 years.2 Males have a higher mortality rate than females for all race/ethnic groups. (Reference Table 6A.A.1.1.2 PDF CSV)
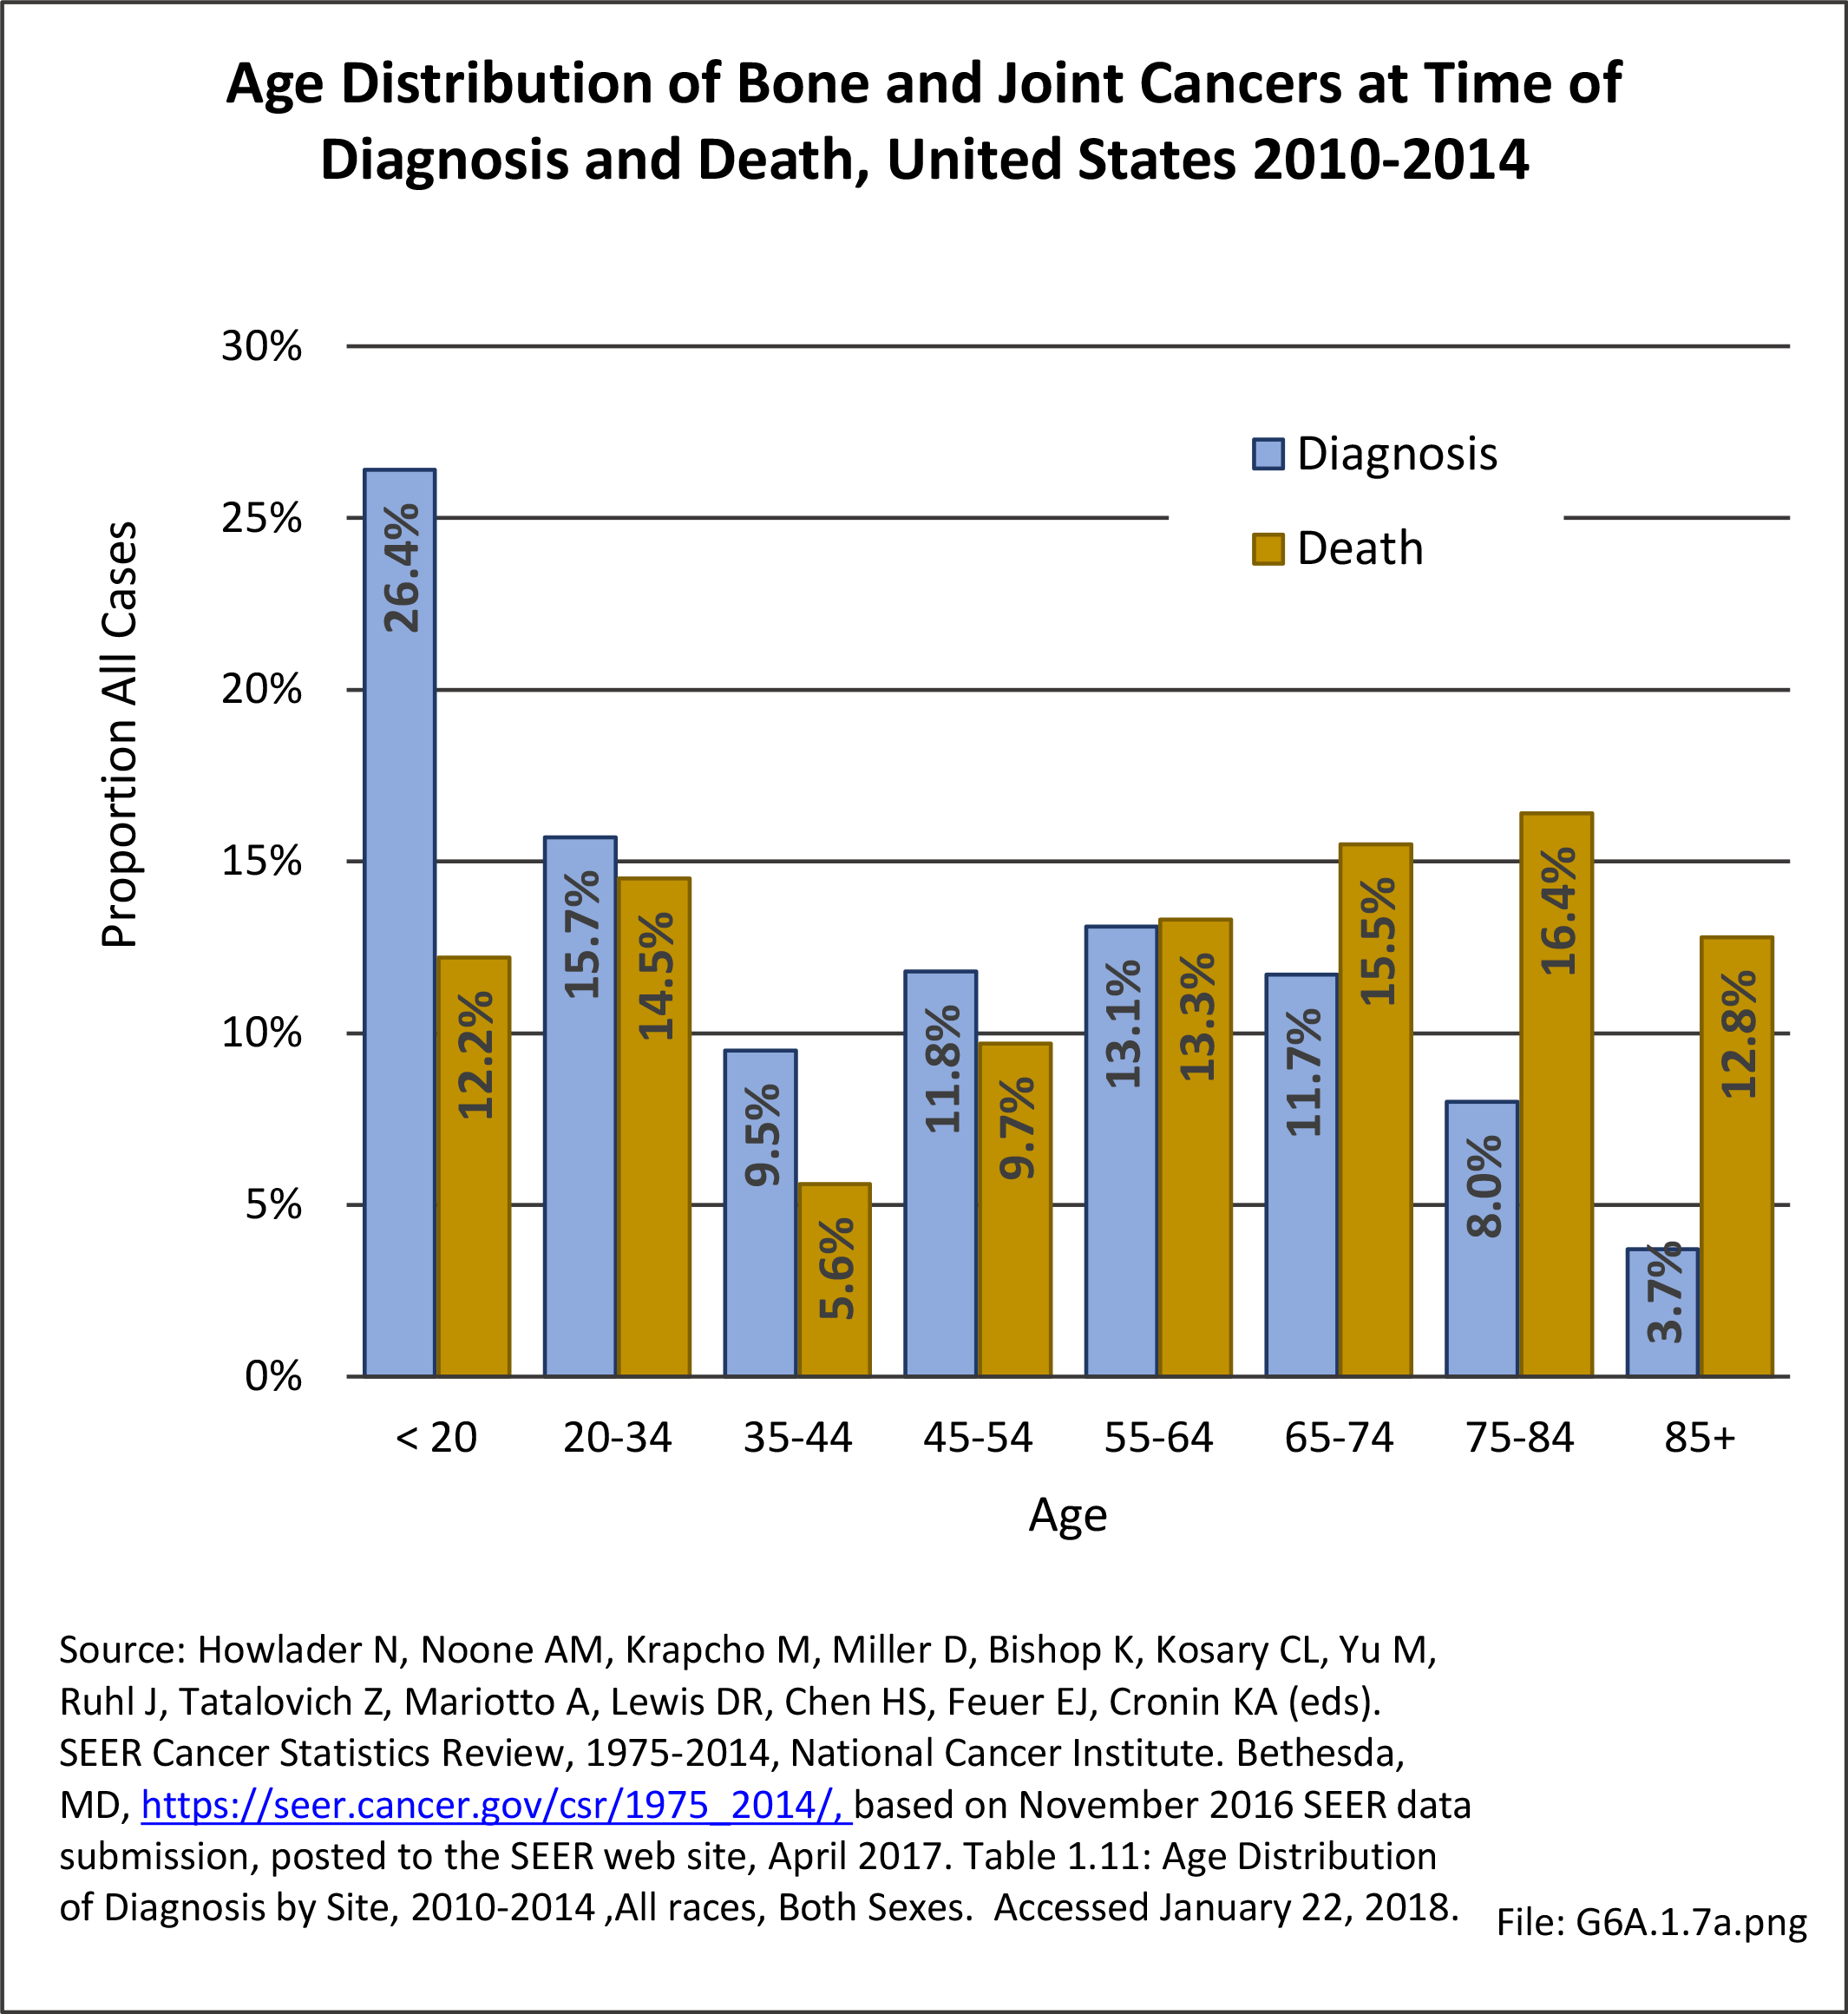
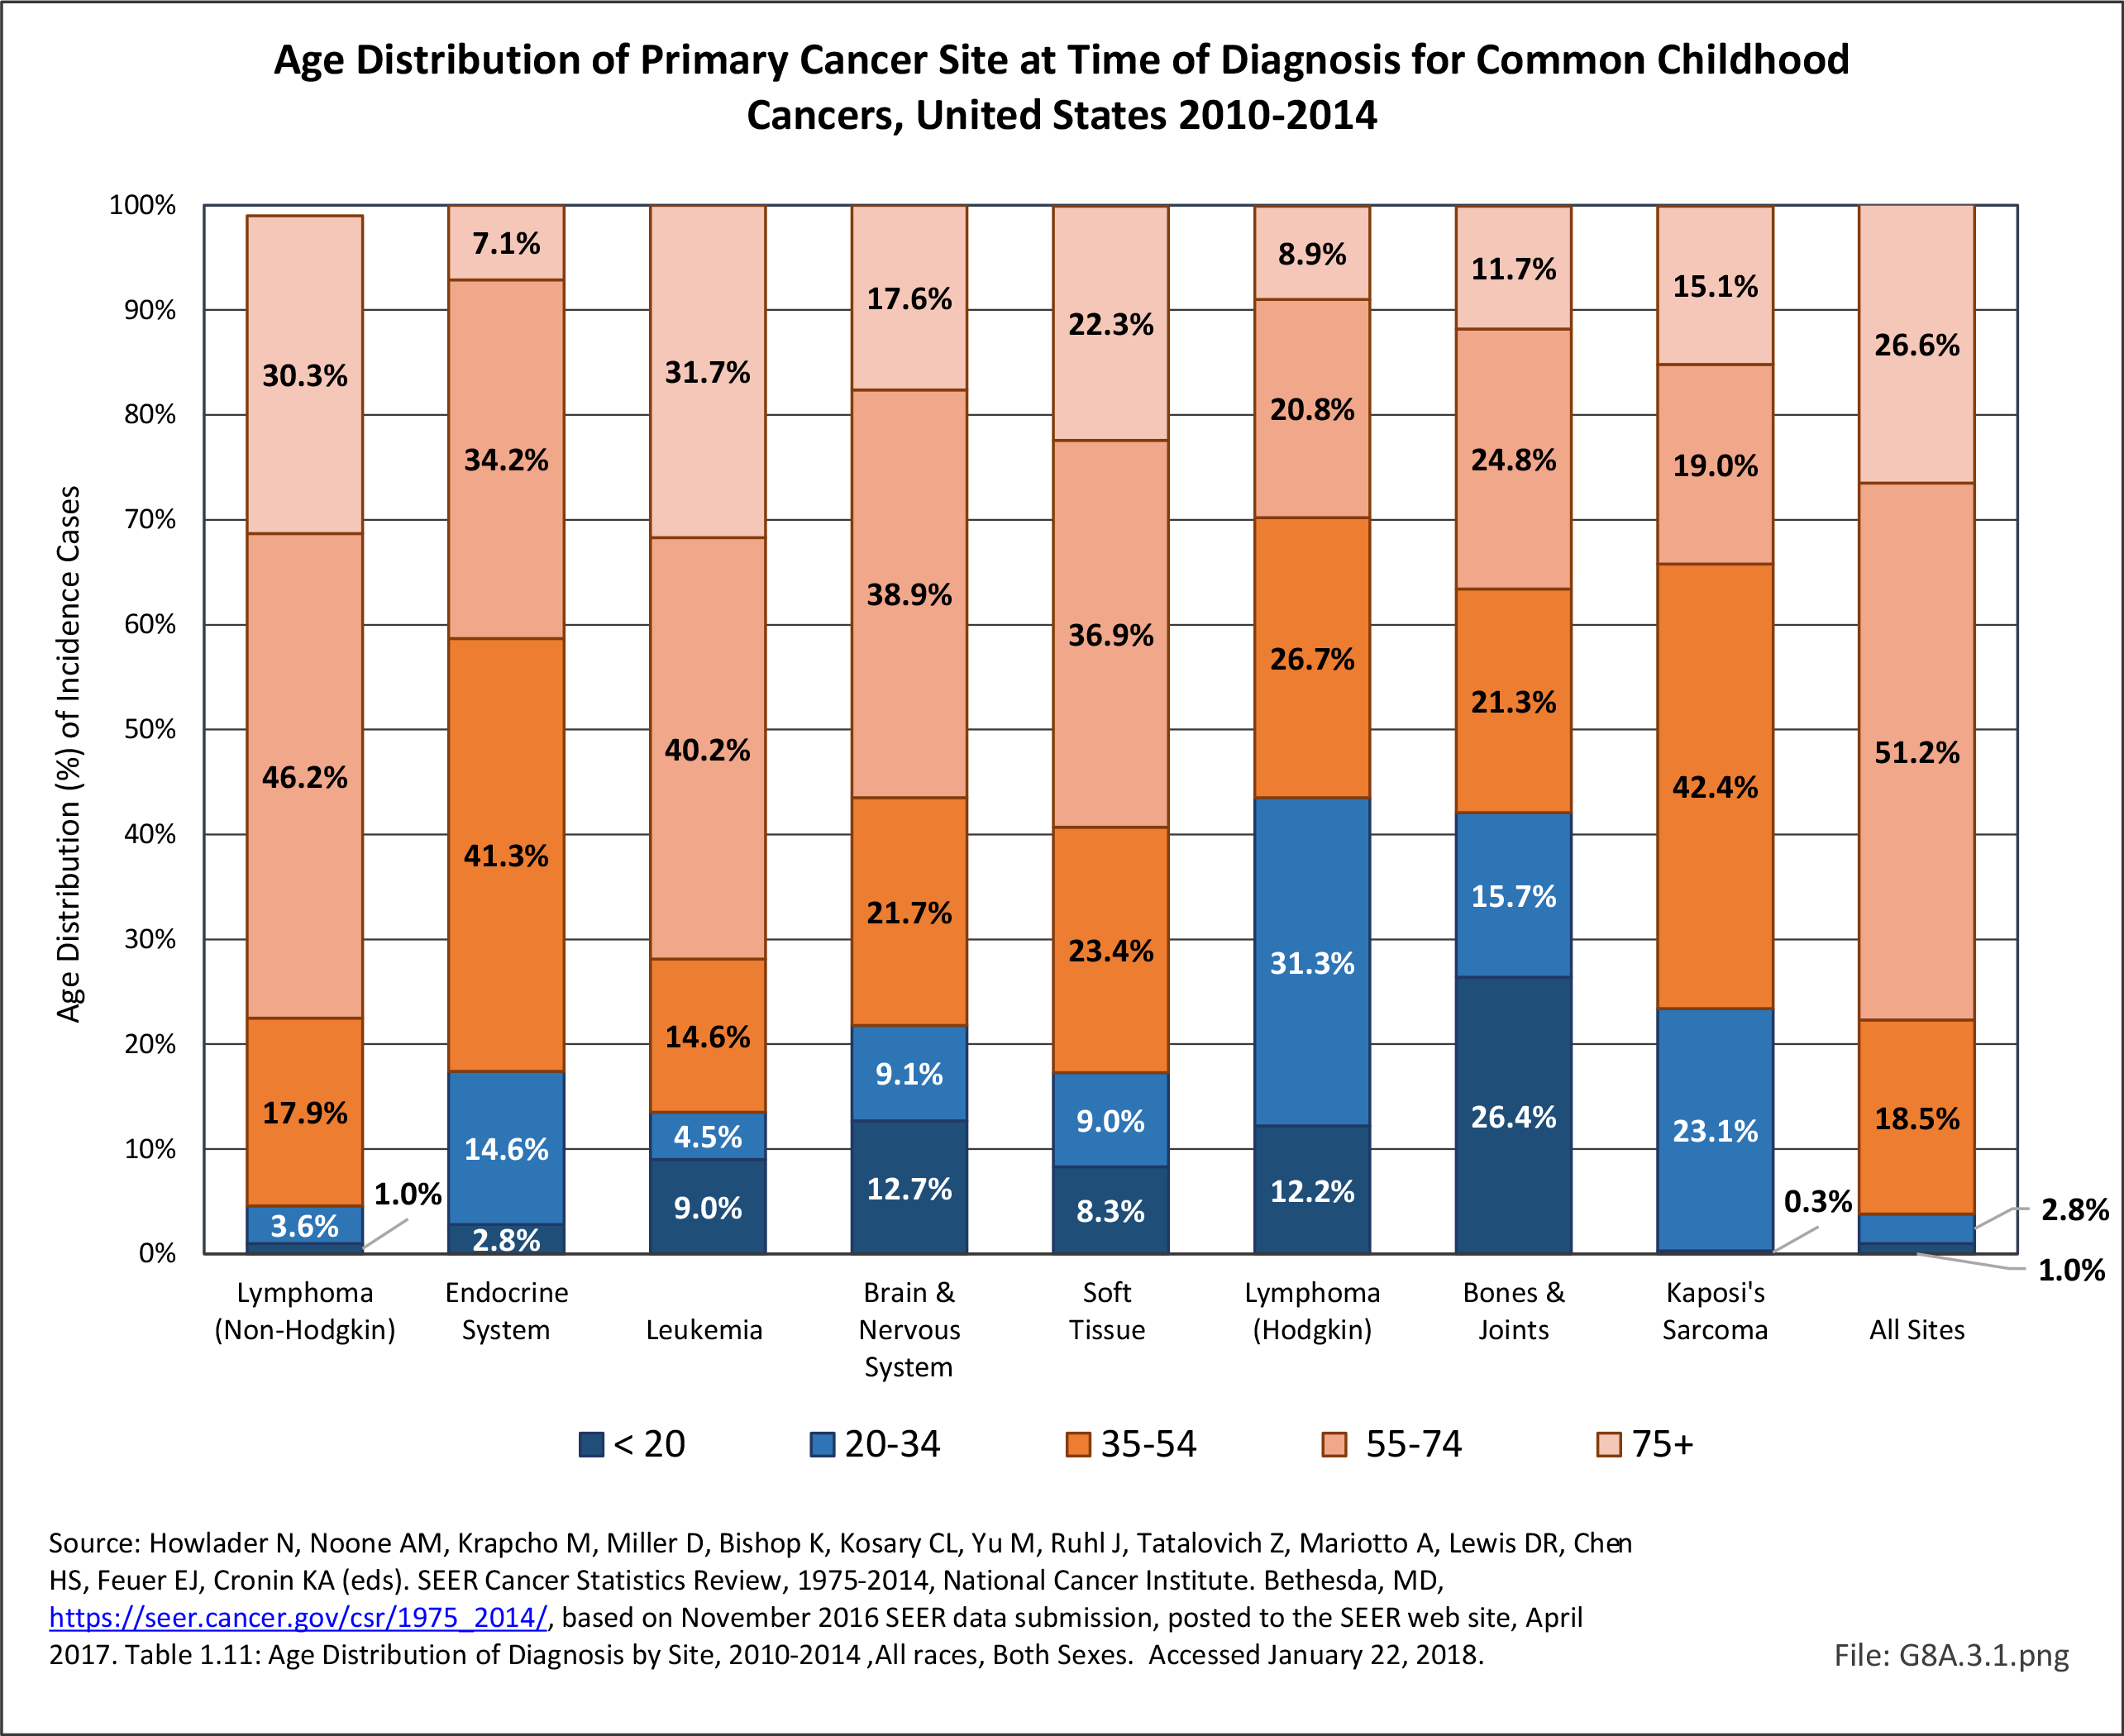
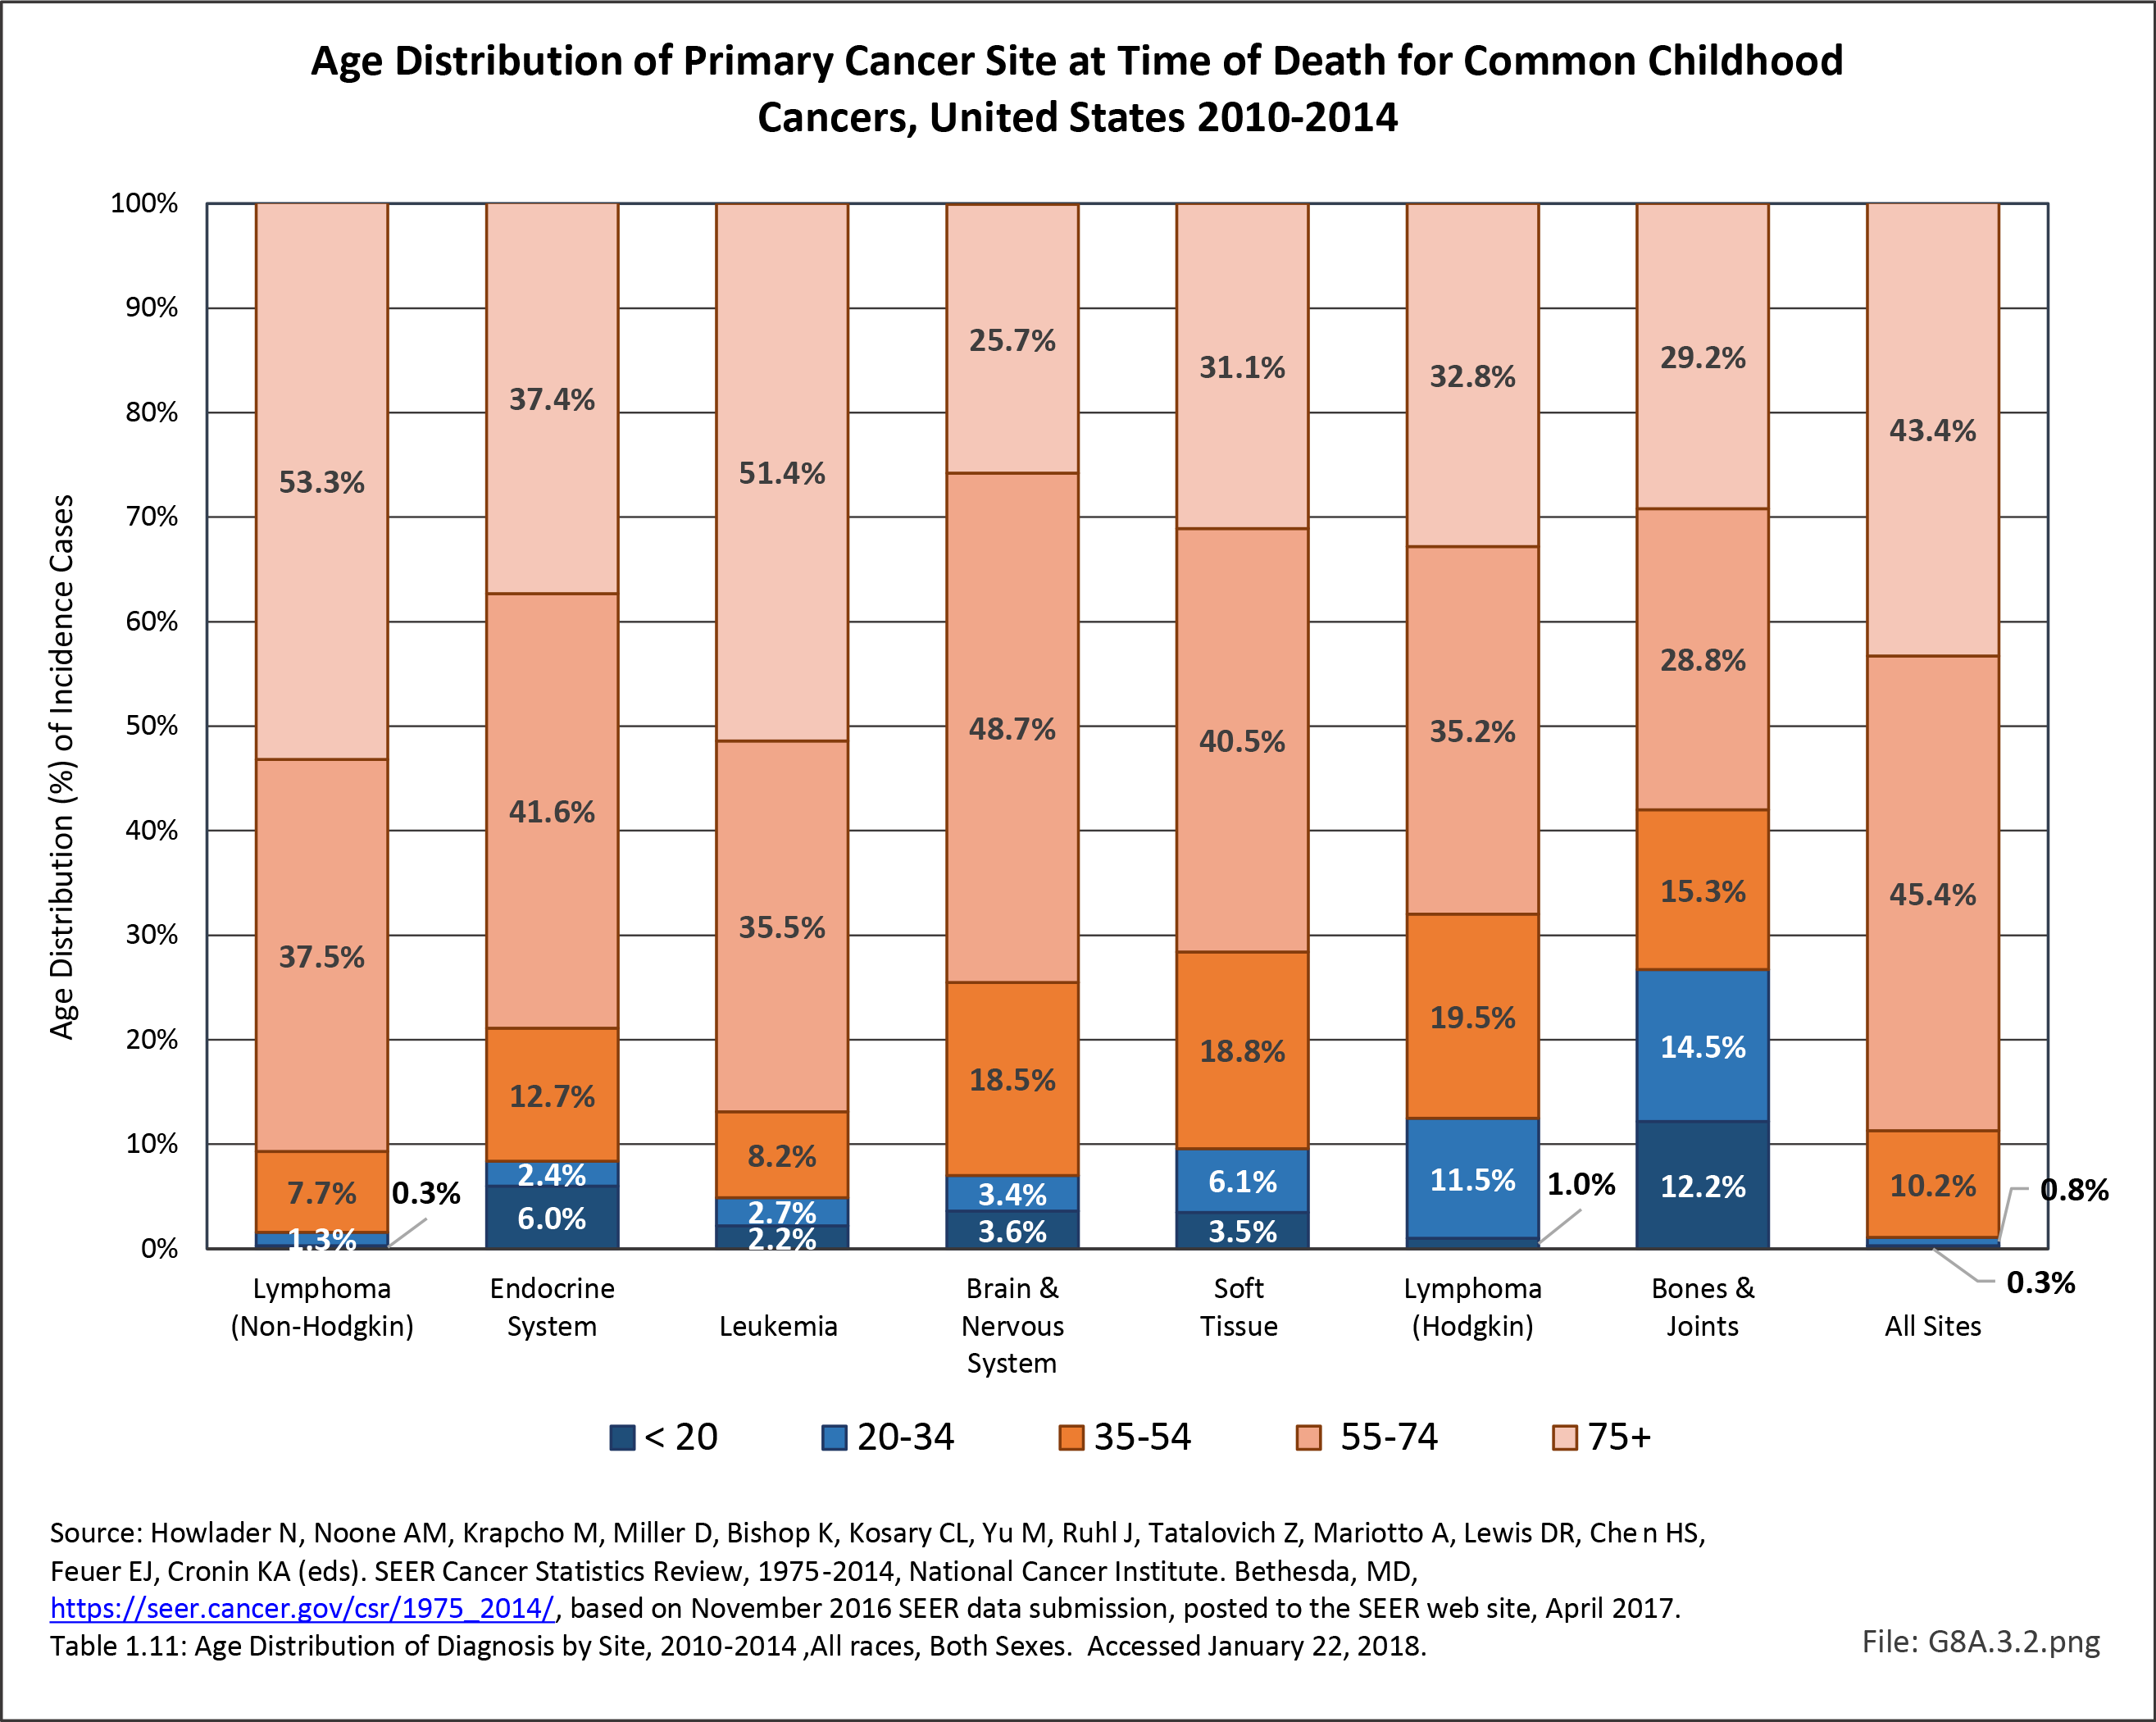
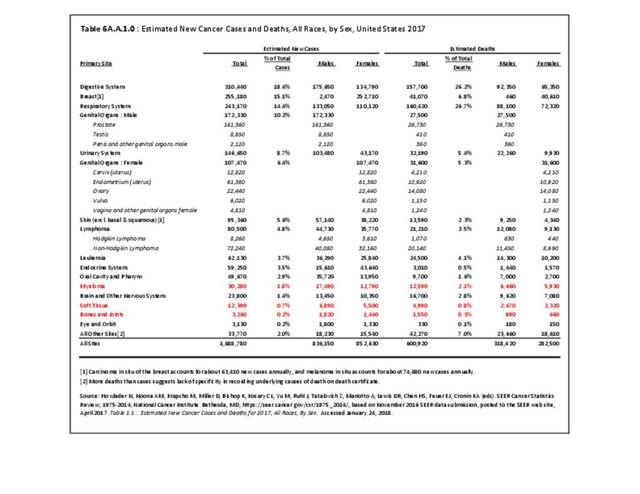
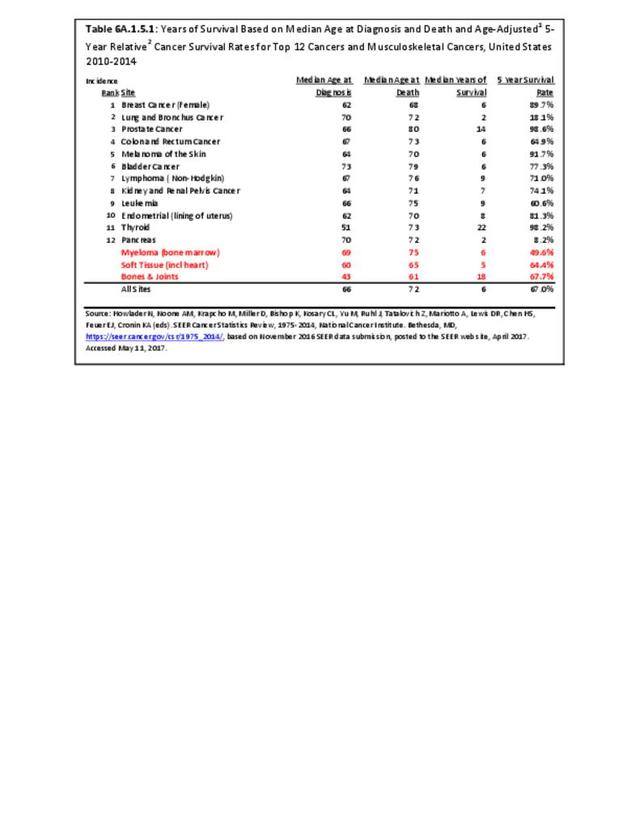
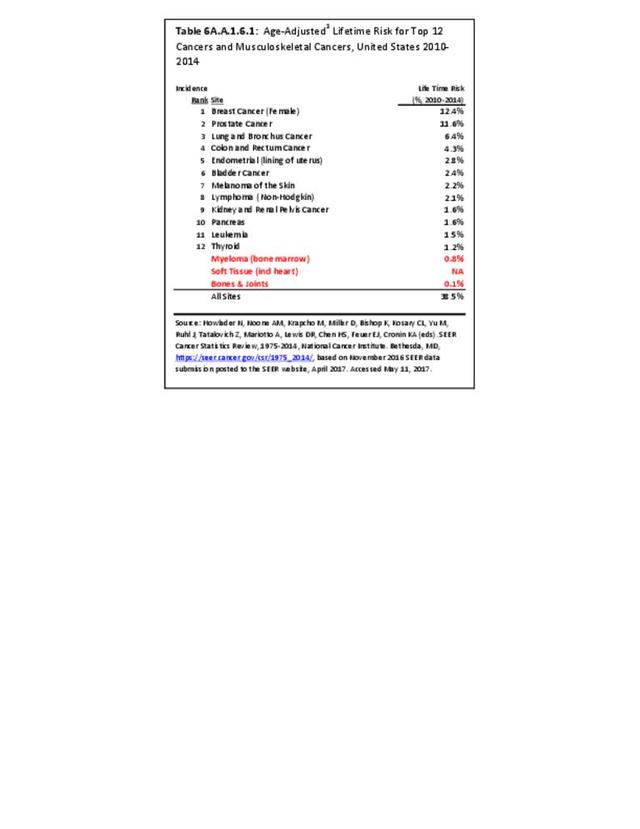
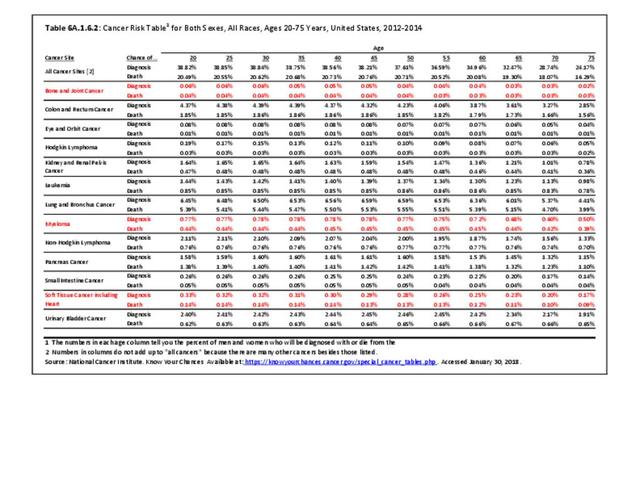
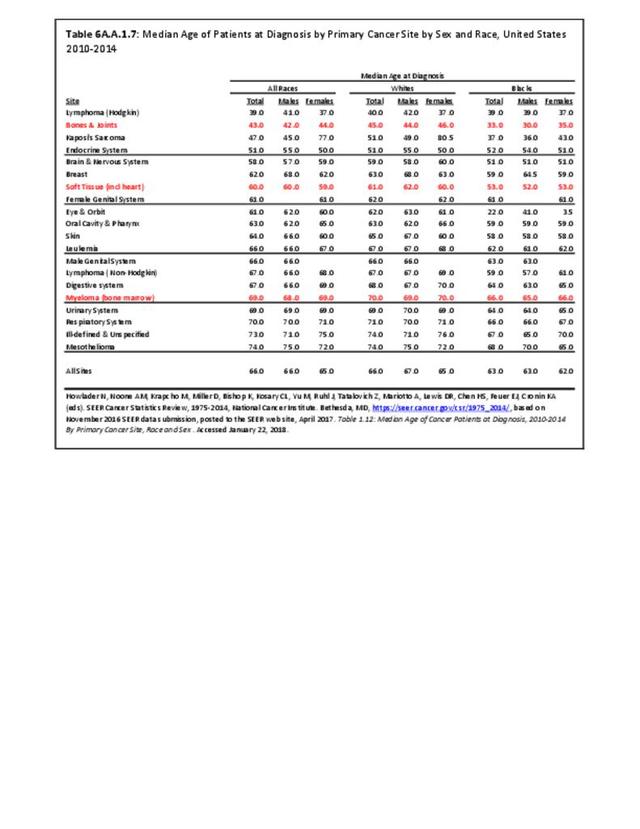
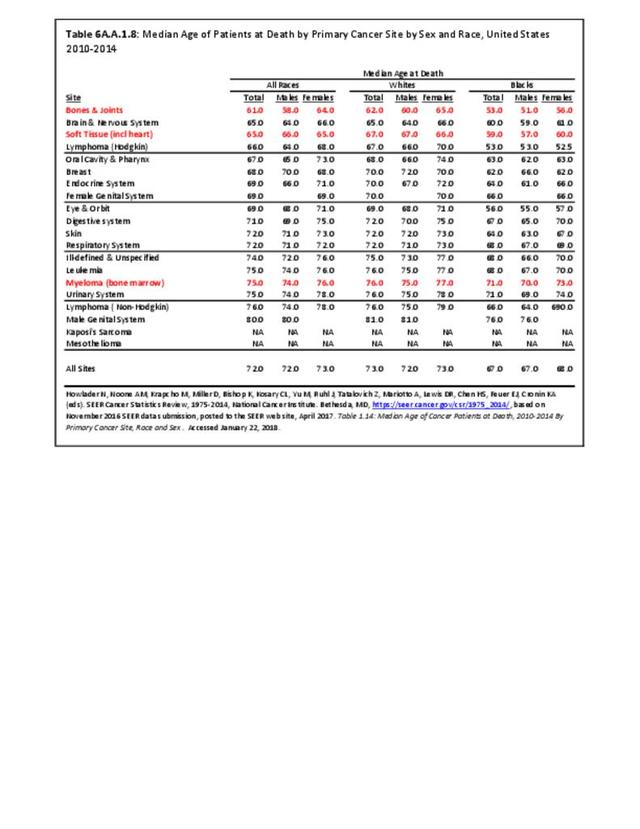
Because bone and joint cancers affect younger populations more than other types of cancers, the median age at death, 61 years of age, is younger than any other type of cancer. There is a higher death rate in older individuals, but a higher incidence rate in younger individuals. At 0.1% risk, bone and joints cancer also has one of lowest life-time risks. This compares to 12% risk for breast and prostate cancer, the two highest risk cancers. (Reference Table 6A.A.1.5.1 PDF CSV and Table 6A.A.1.6.1 PDF CSV; and Table 6A.A.1.6.2 PDF CSV)
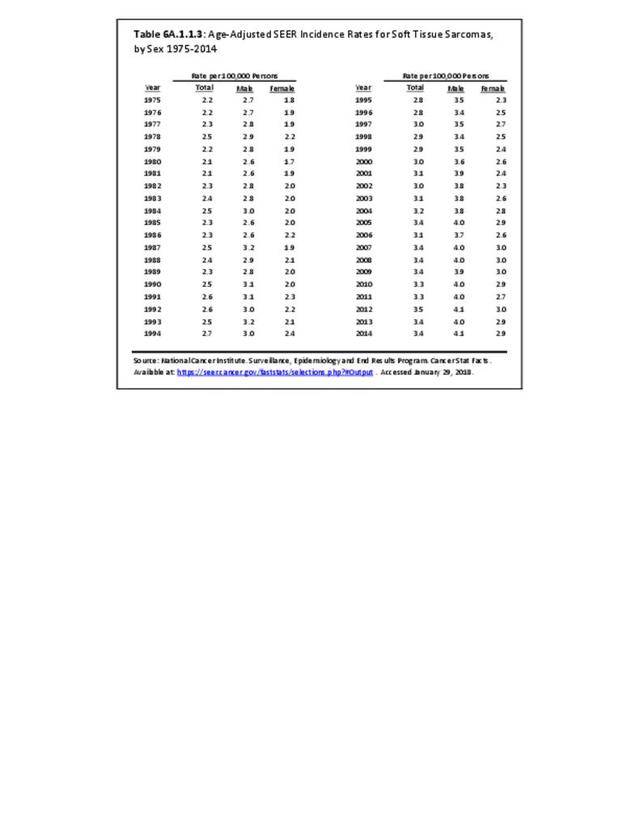
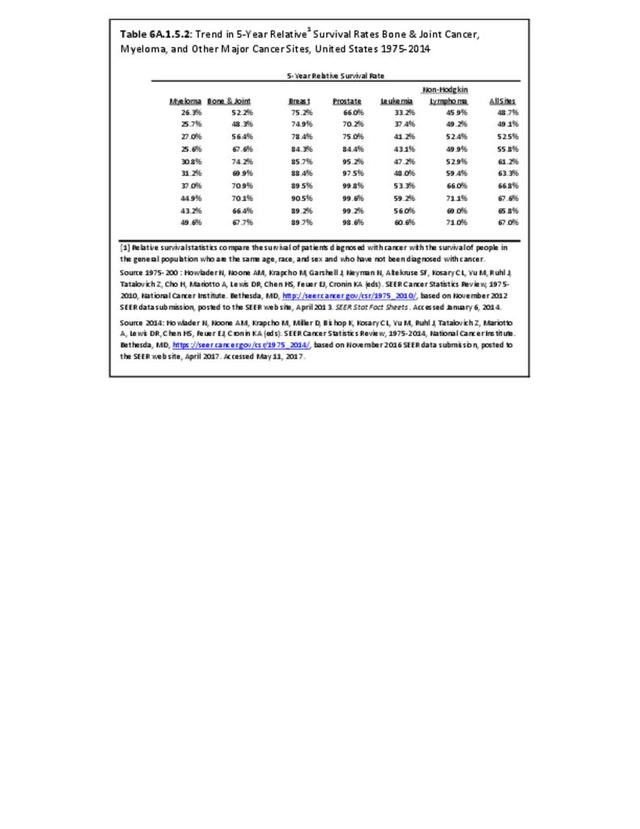
The overall 5-year survival rate in 2009-2015 for bone and joint cancers was 66.2%, placing it roughly in the middle of all cancers for 5-year survival and comparable to several more common cancers such as rectal, cervical, and soft tissue cancers.3 This is a survival rate increase of 27% since 1975, when the 5-year survival rate was 52%. (Reference Table 6A.A.1.5.2 PDF CSV)

By extrapolation from median age at diagnosis and median age at death, one could estimate a median survival rate. However, this extrapolated survival time is misleading and inaccurate as younger patients, who typically are healthier and can tolerate more aggressive treatments, have improved survival compared to older individuals, who cannot tolerate such aggressive treatments and have poorer survival, greatly affecting this derived or extrapolated estimate of survivorship.
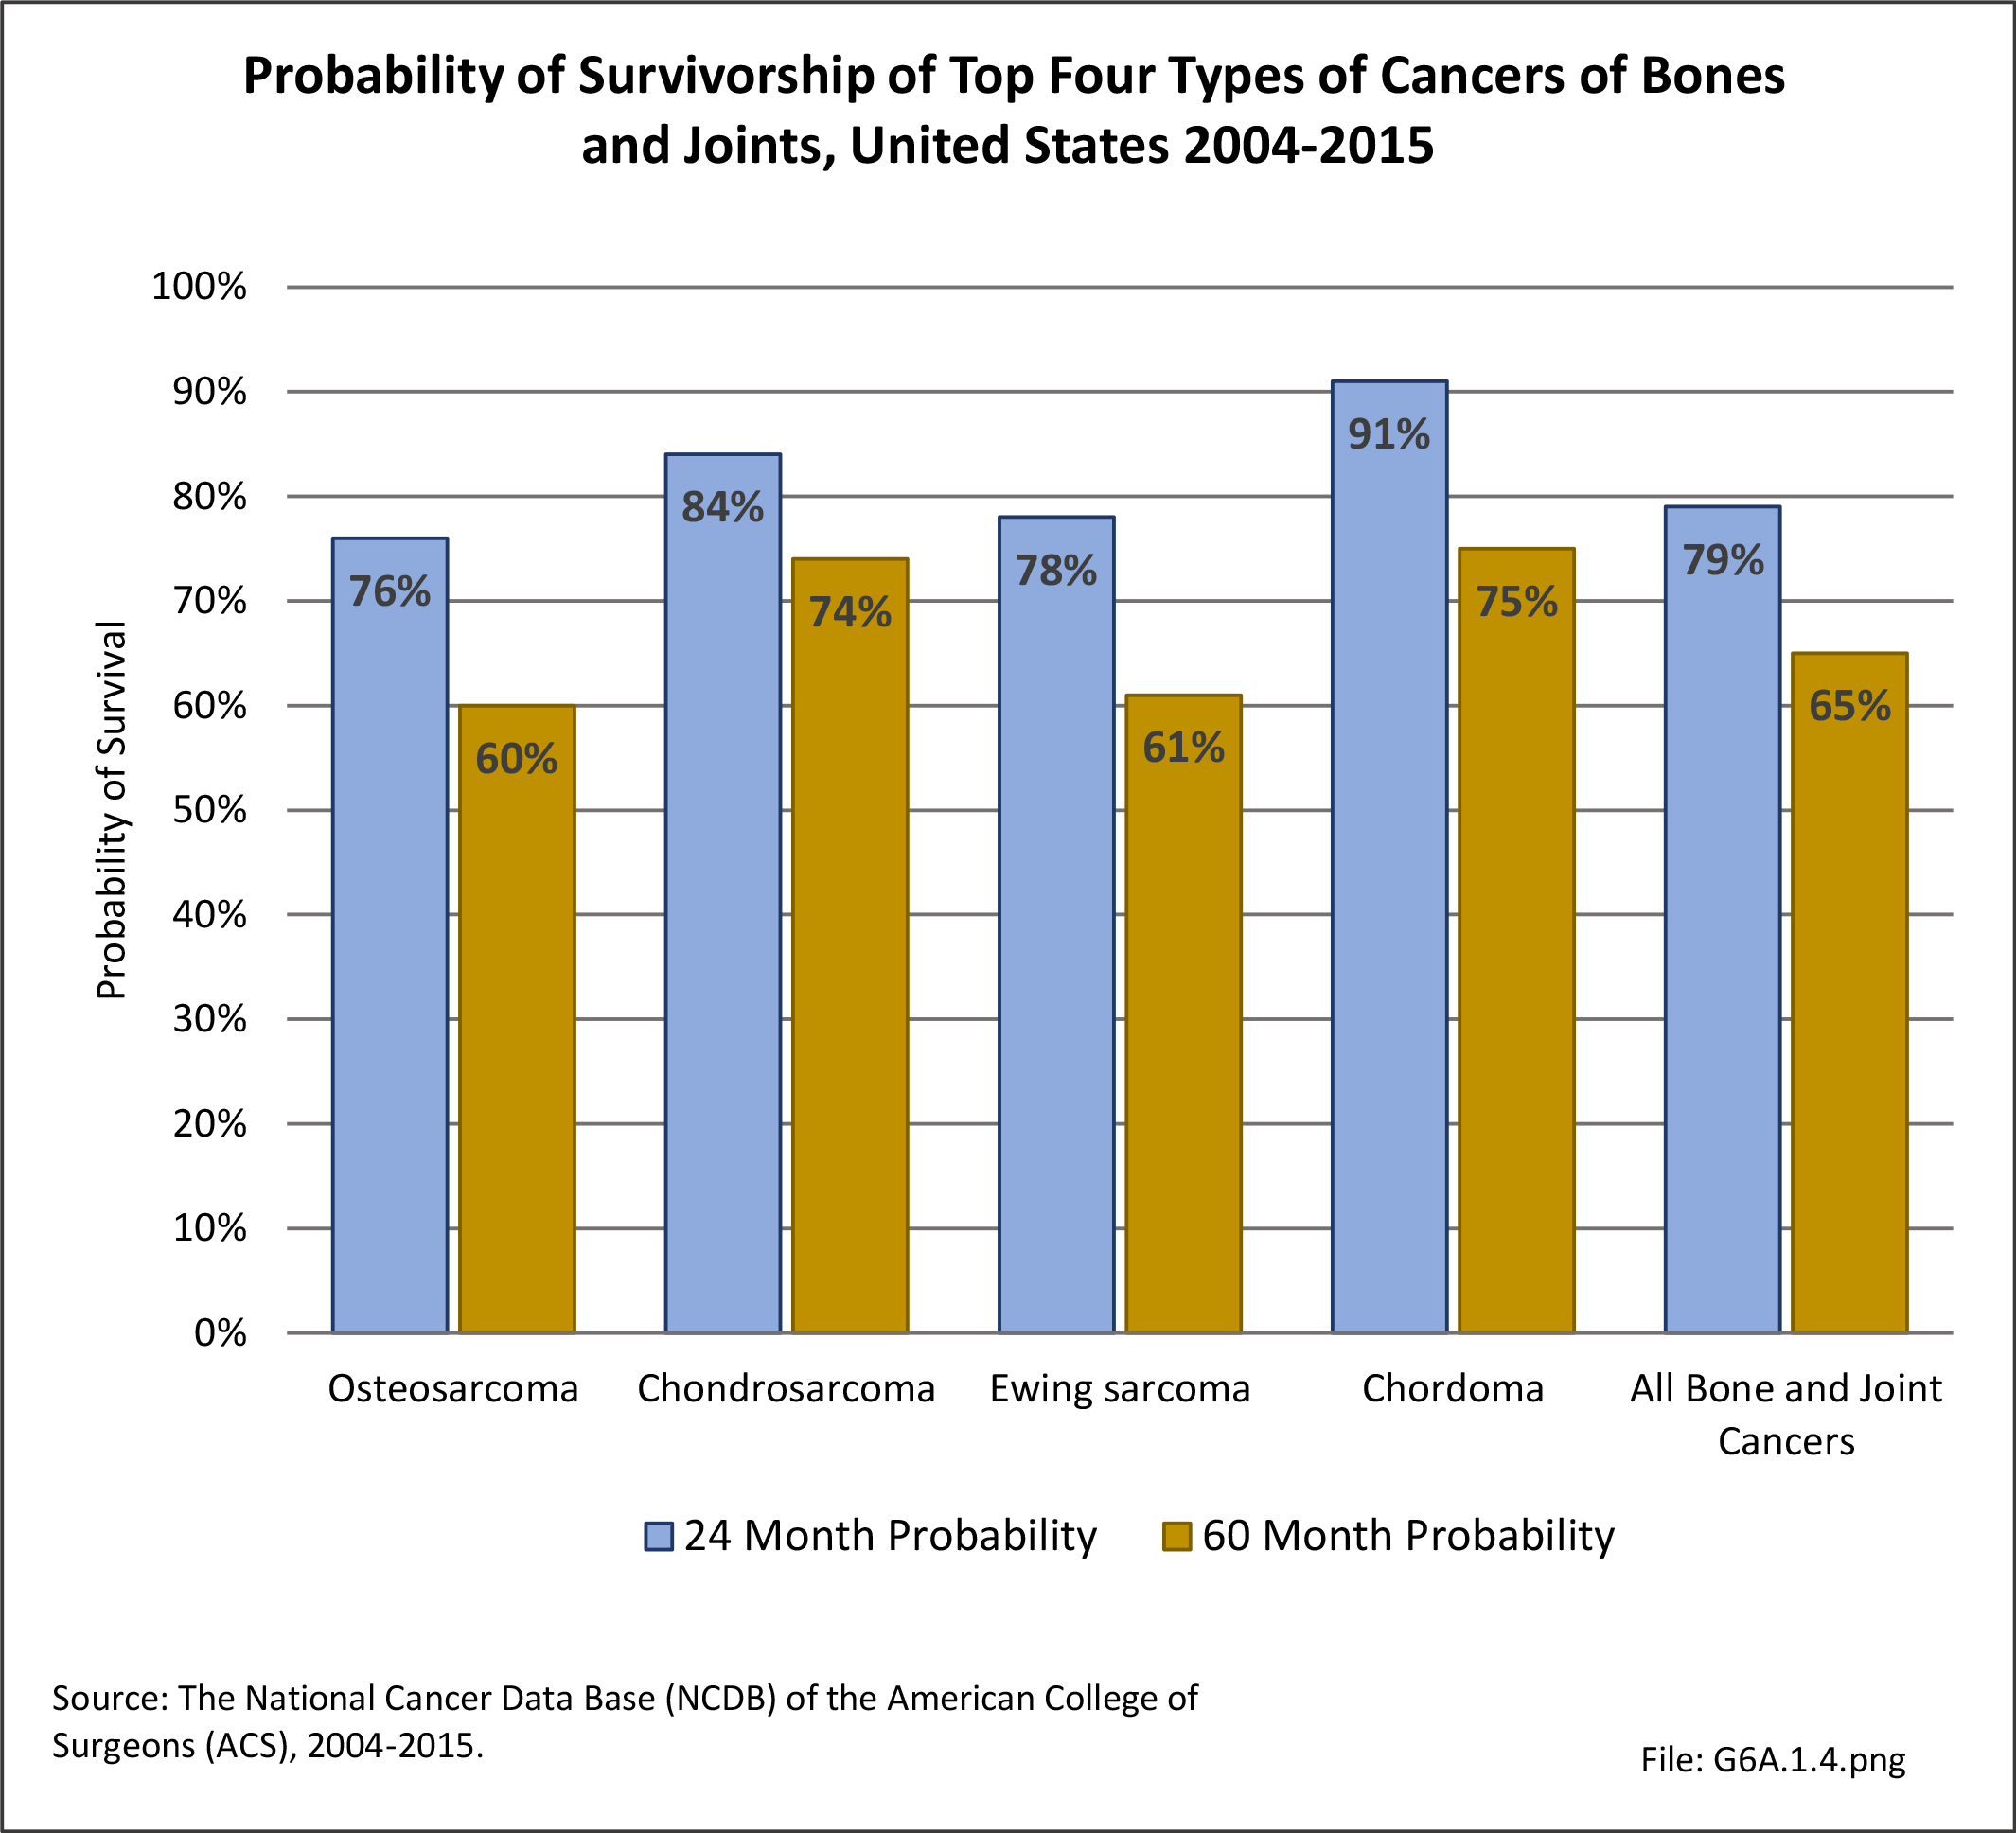
The overall 5-year survival rate for the primary types of bone and joint cancers varies by type and subtype of cancer, how it responds to treatment, and the degree to which the cancer has spread. Osteosarcoma diagnosed and treated before it has spread has a reported general survival rate between 60% and 80%; if it has already spread at the time of diagnosis, the 5-year survival rate is reported to be between 15% and 30%.4
If Ewing sarcoma is found before it metastasizes, the 5-year survival rate for children and youth is about 70%, with a survival rate of 78% reported for children under age 5, dropping to around 60% survival for adolescents age 15 to 19. However, if already metastasized when found, the 5-year survival rate drops to 15% to 30%.5
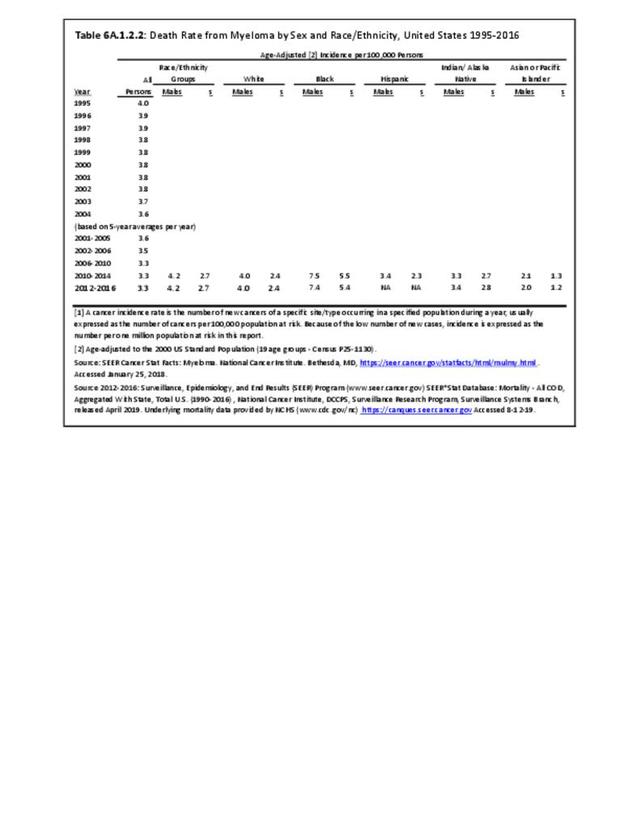
The annual population-based mortality rate of myeloma has been an average of 33 persons per one million population between 2001 and 2016. The mortality rate from myeloma has remained relatively constant since the mid-1970s. The 5-year survival rate for myeloma, 50%, is one of the lowest for all cancers; however, due to being primarily a cancer of older persons, this age-relatedness may, in part, reflect survival regardless of the presence or absence of myeloma. The median calculated rate of survival after diagnosis of myeloma is only 6 years. (Reference Table 6A.A.1.2.2 PDF CSV and Table 6A.A.1.5.1 PDF CSV)
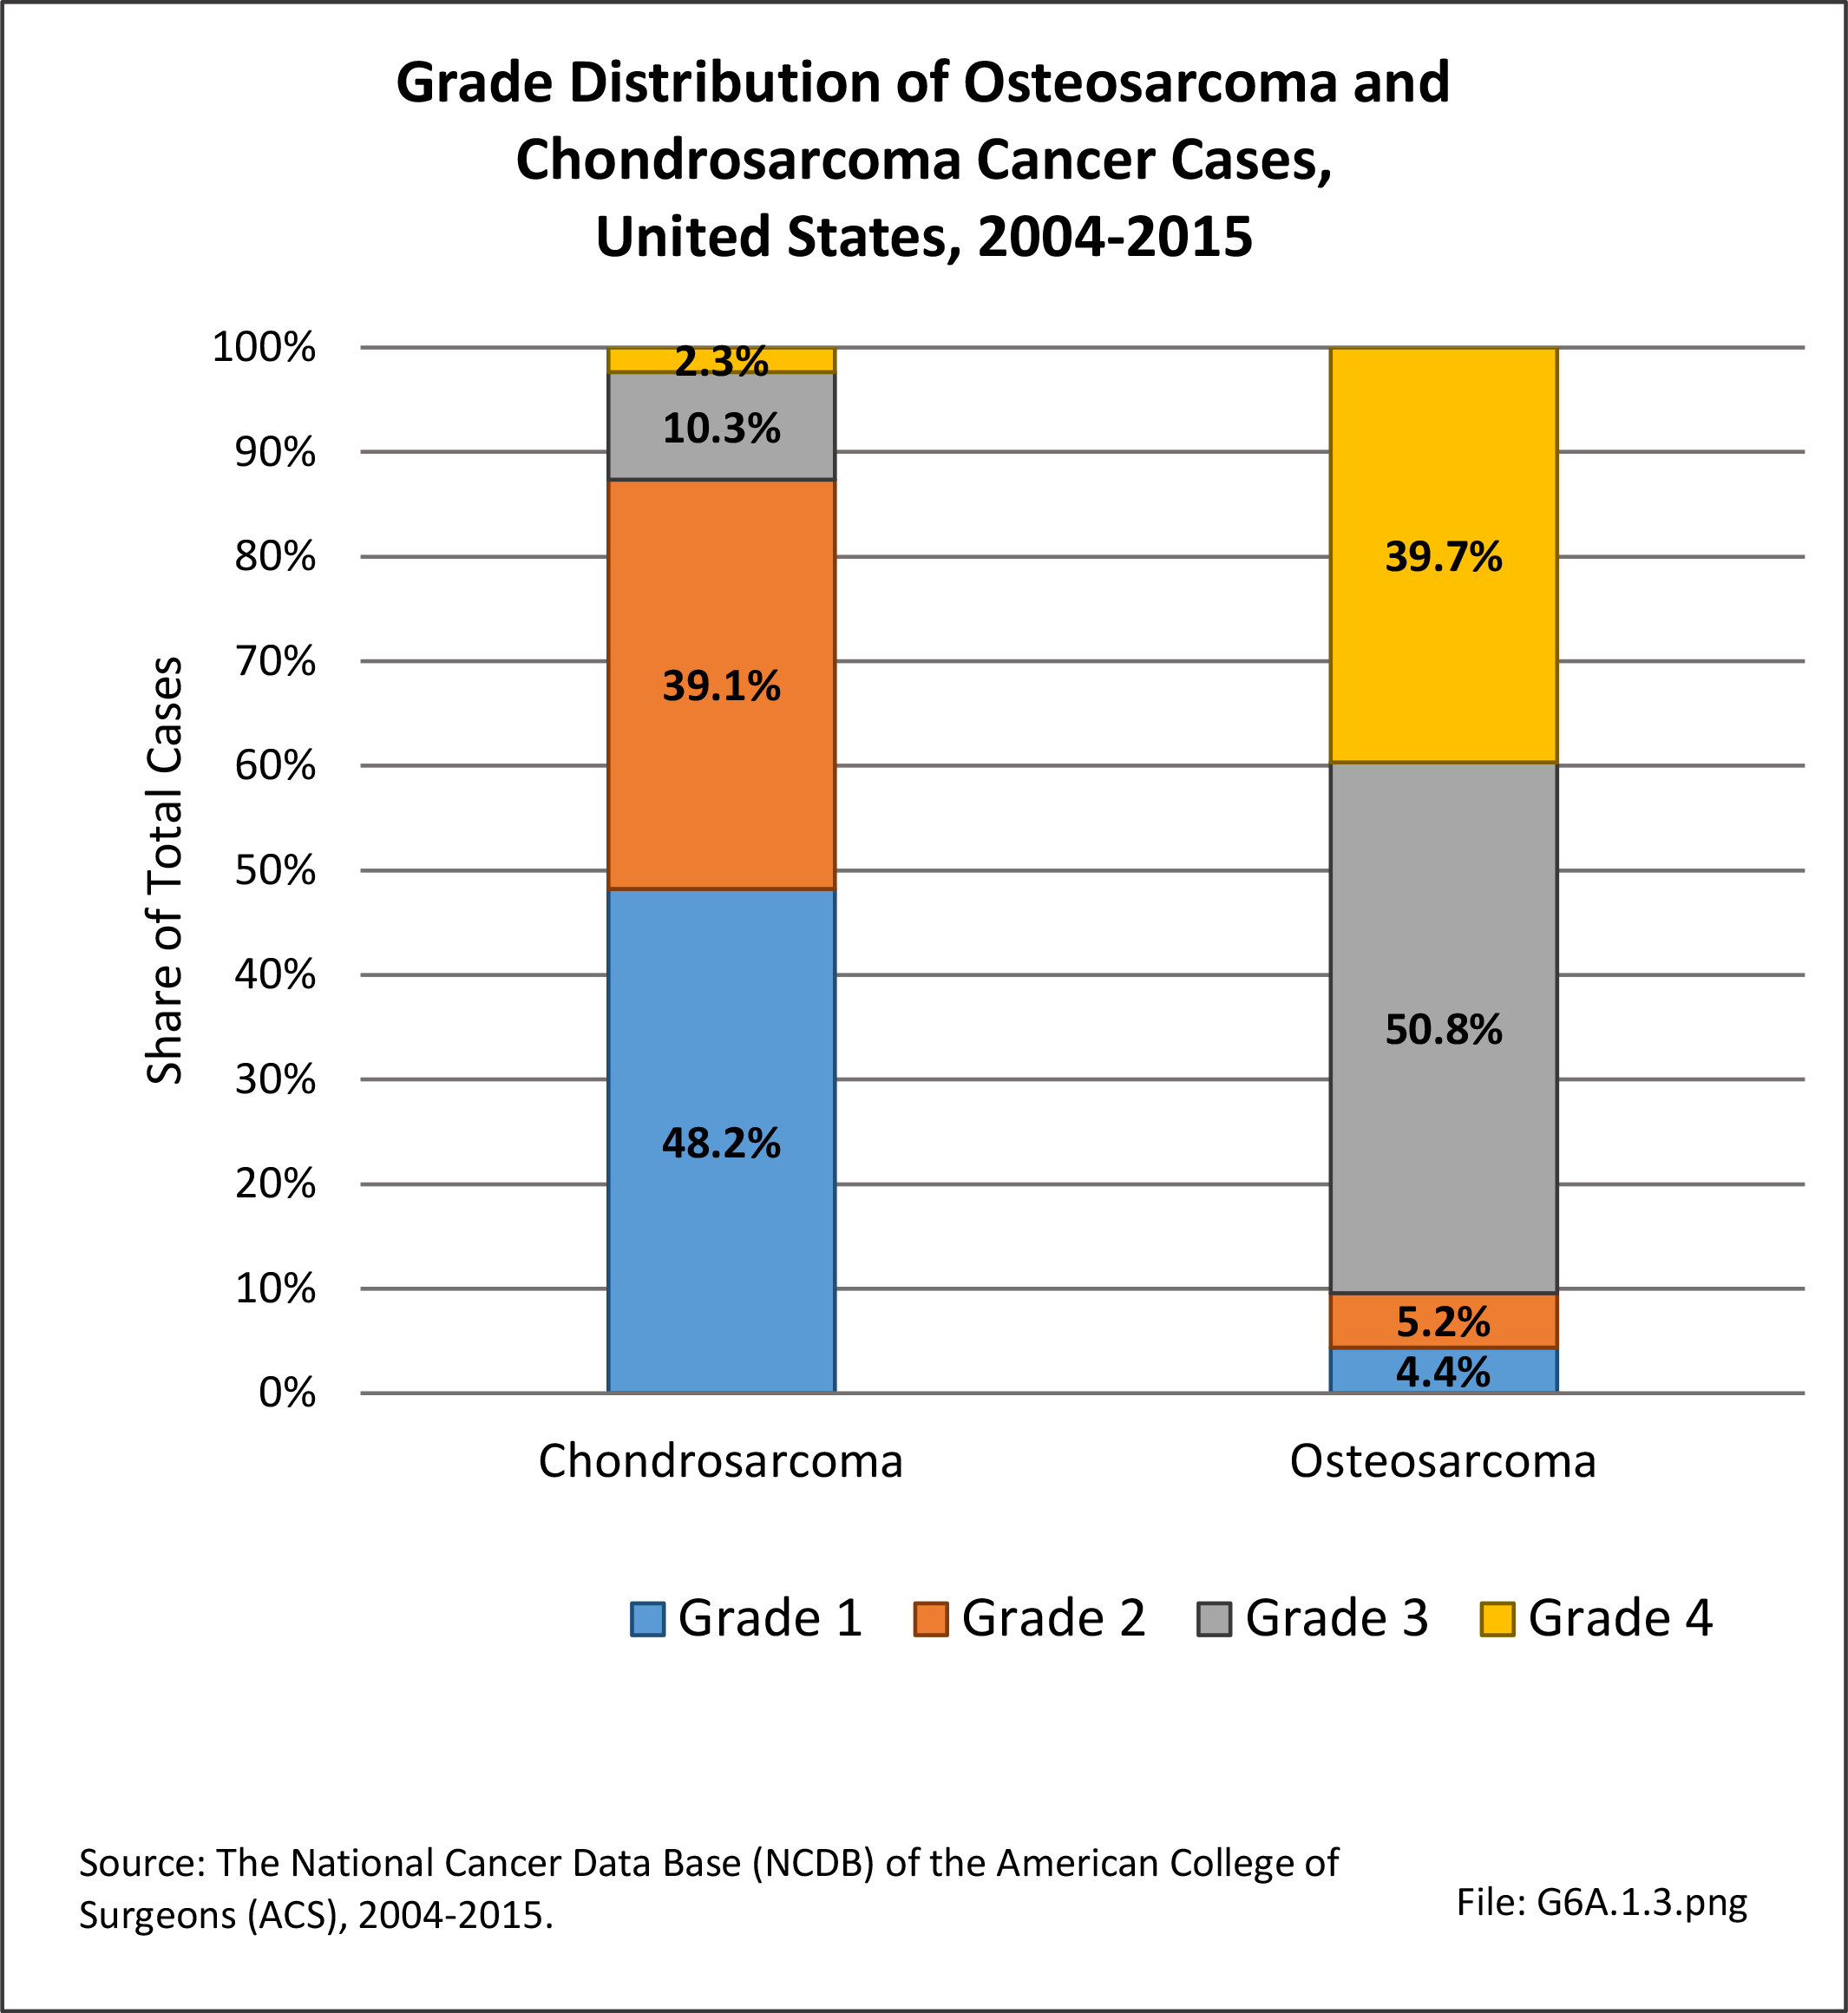
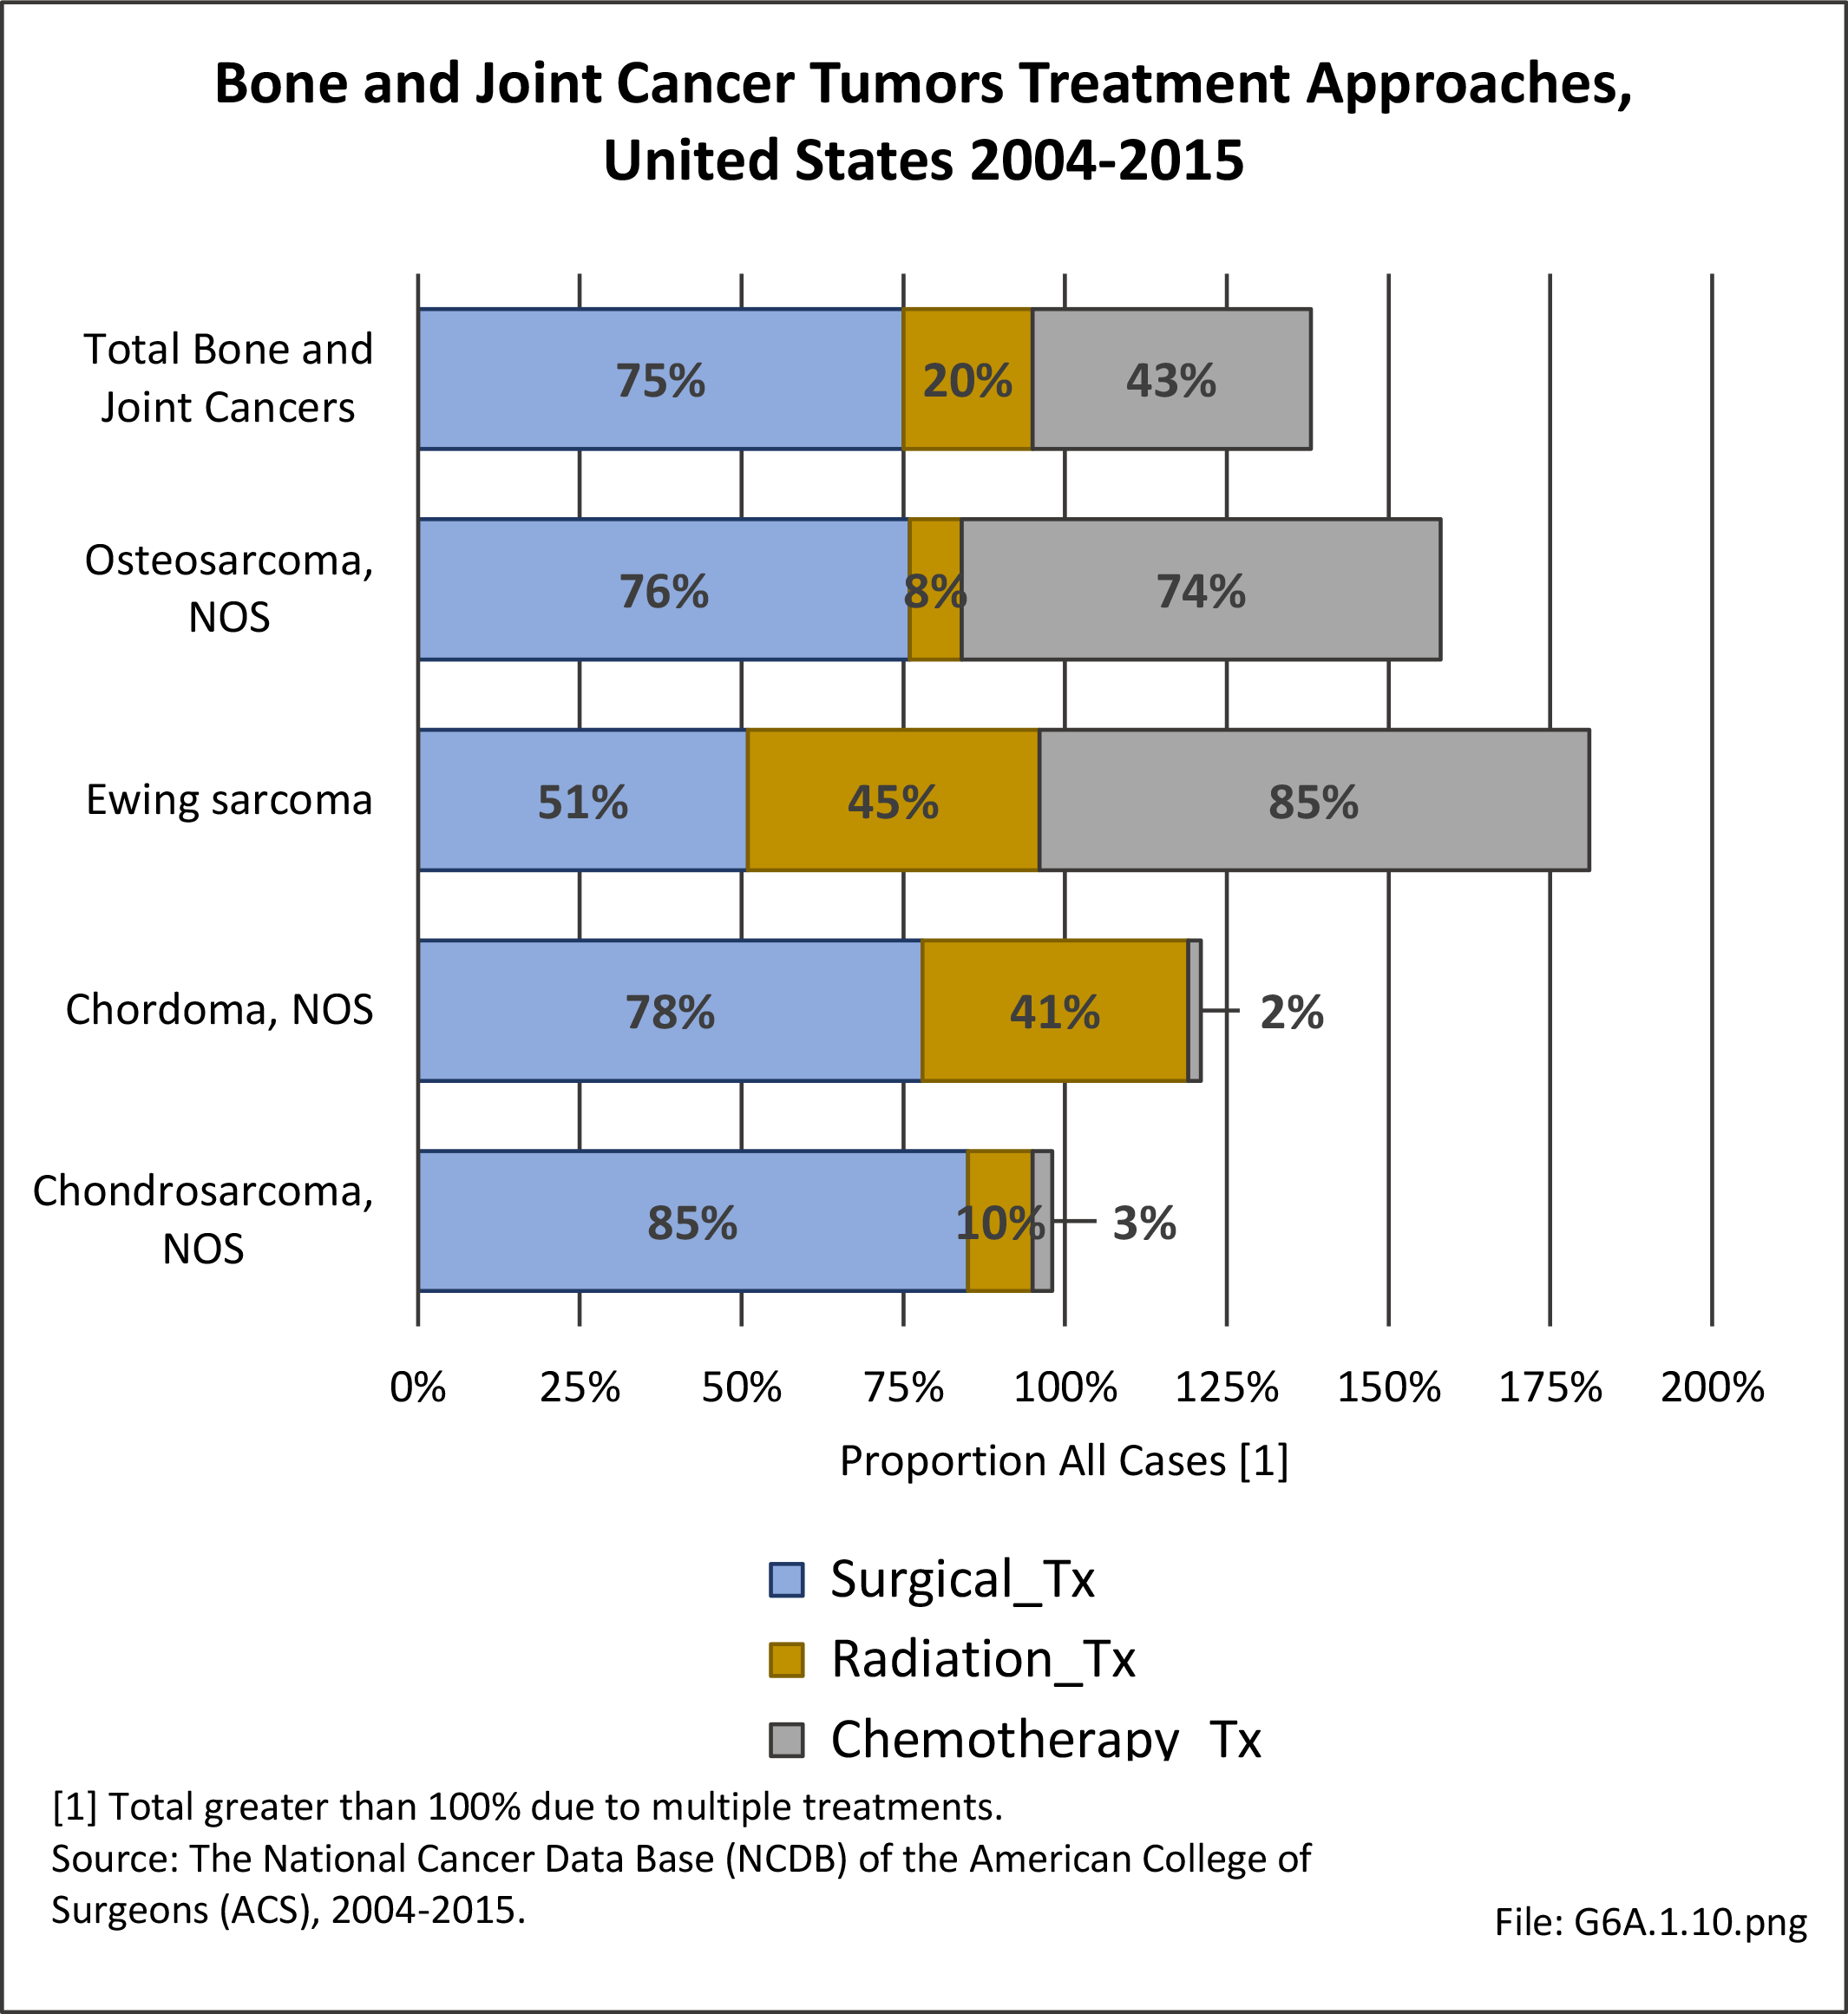
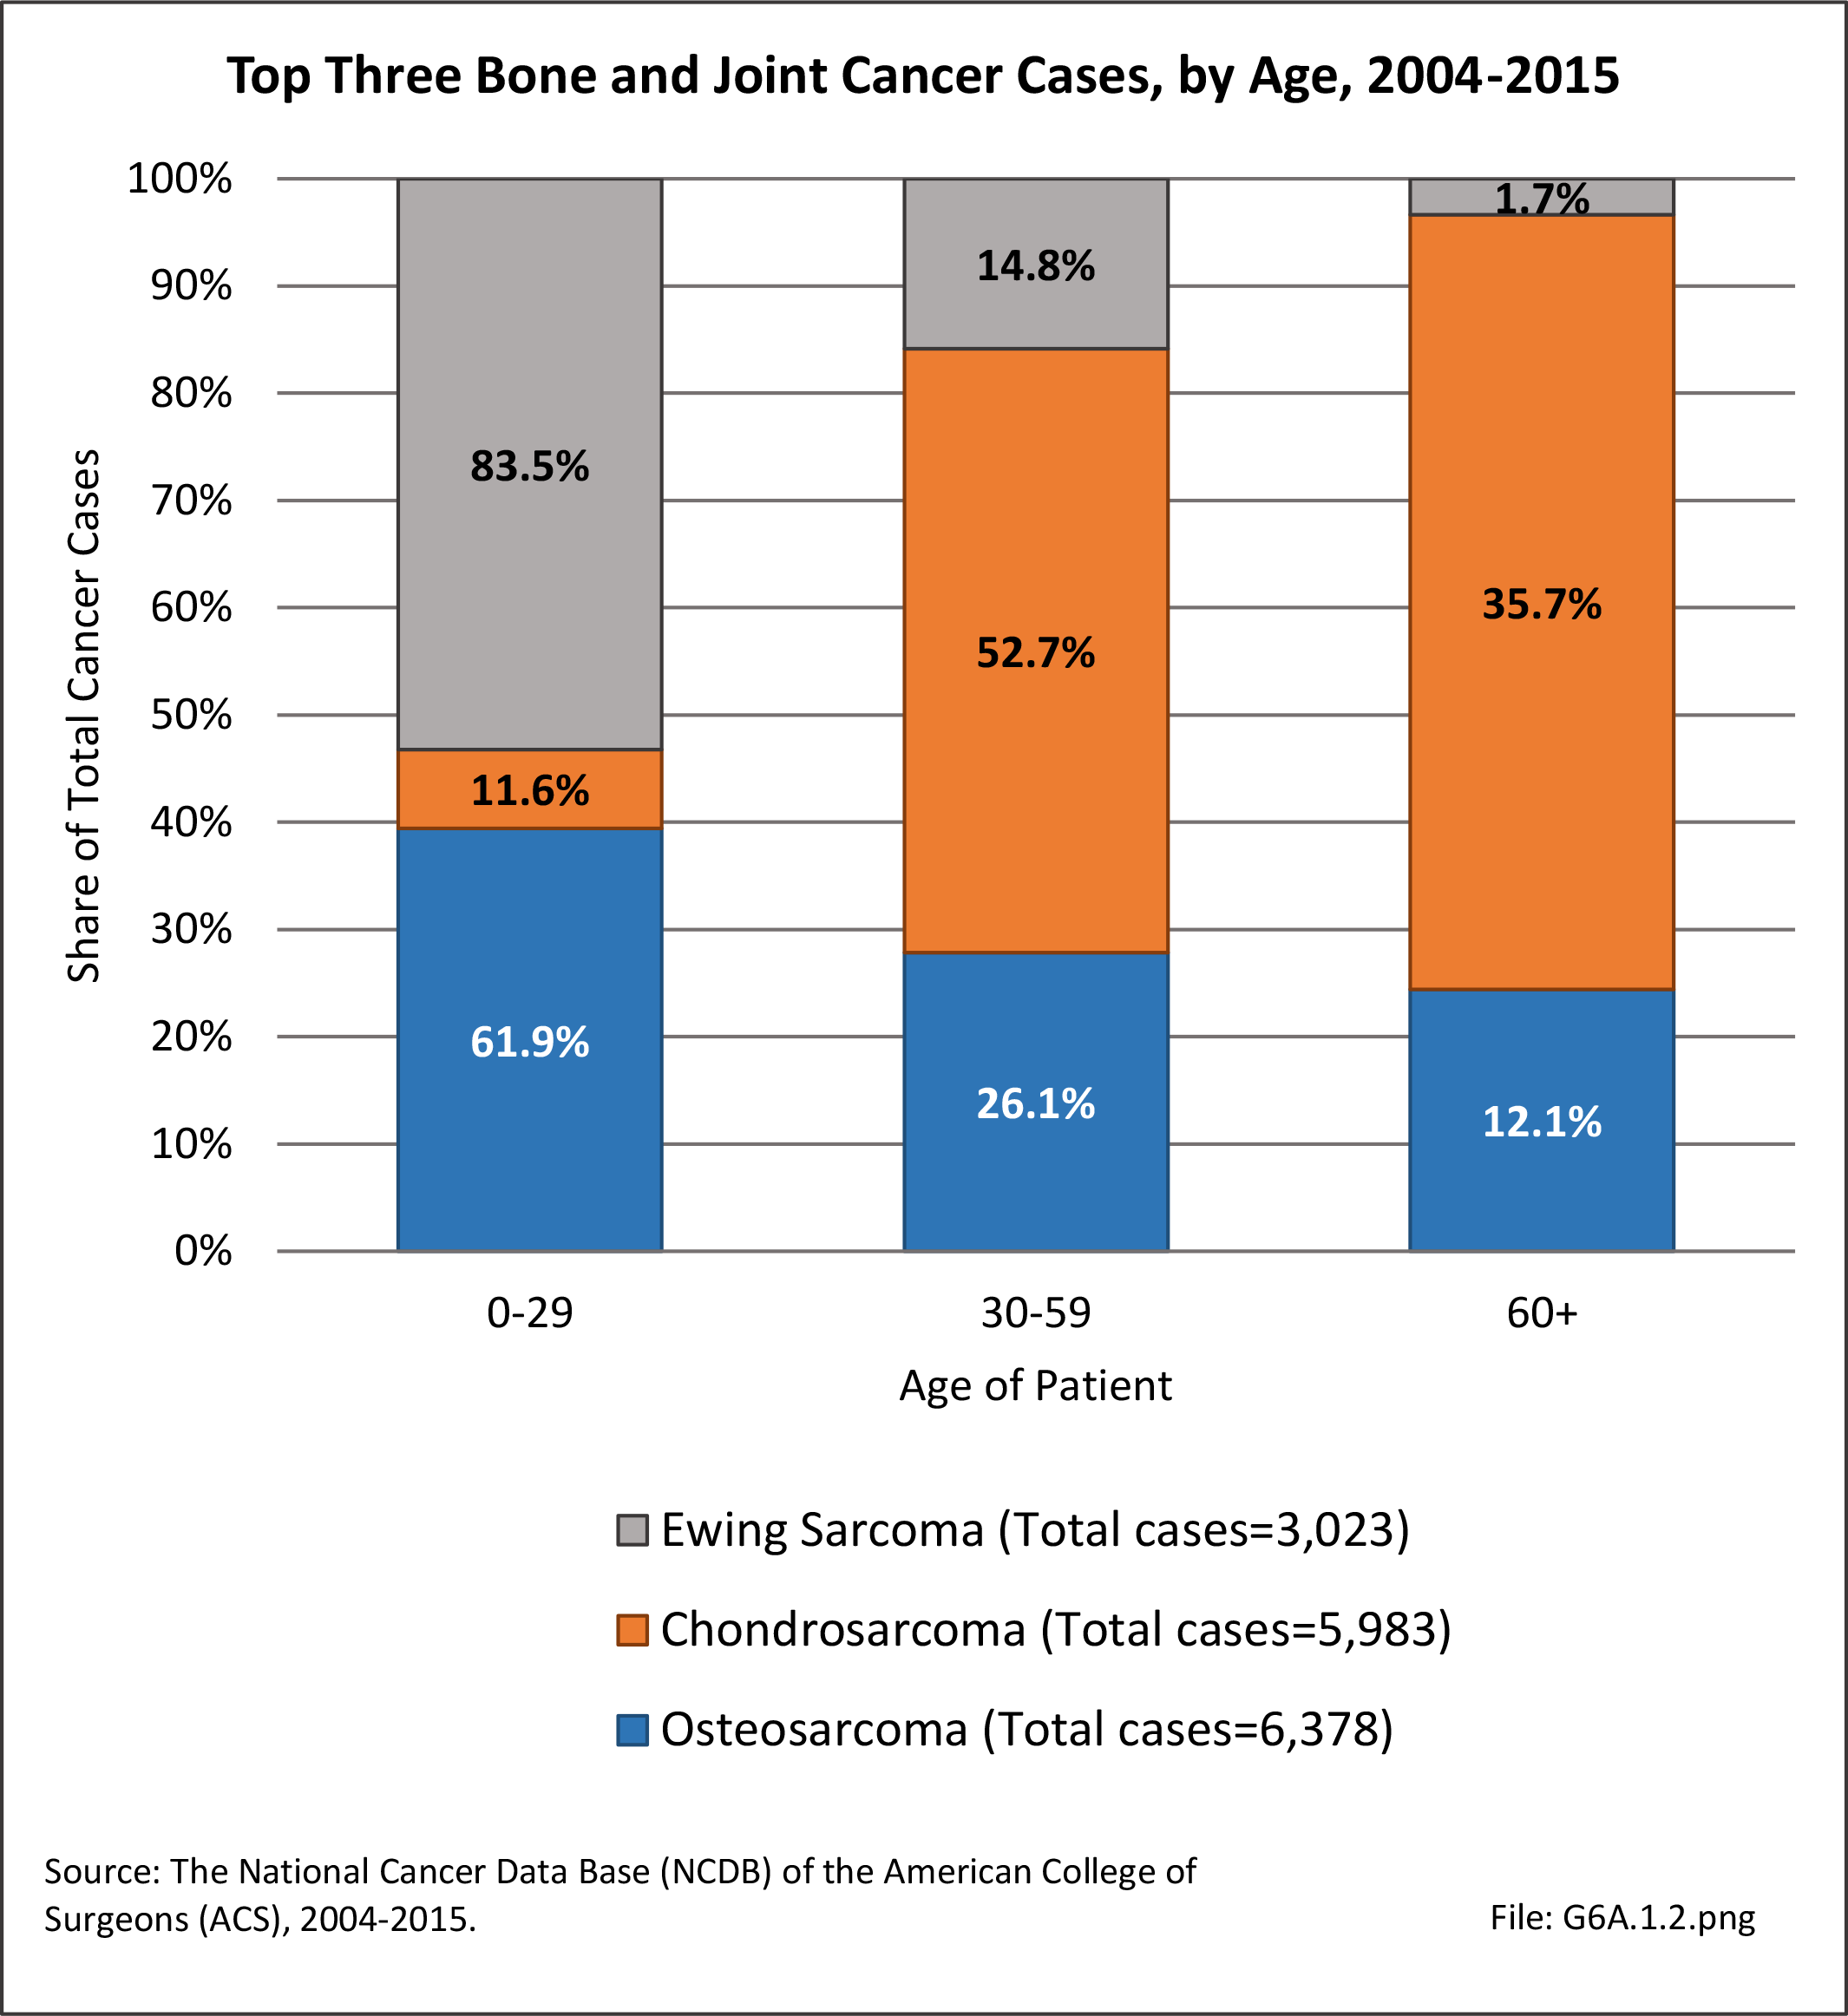
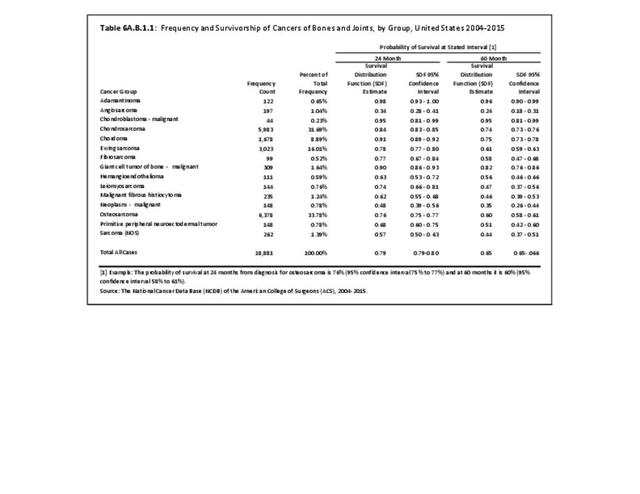
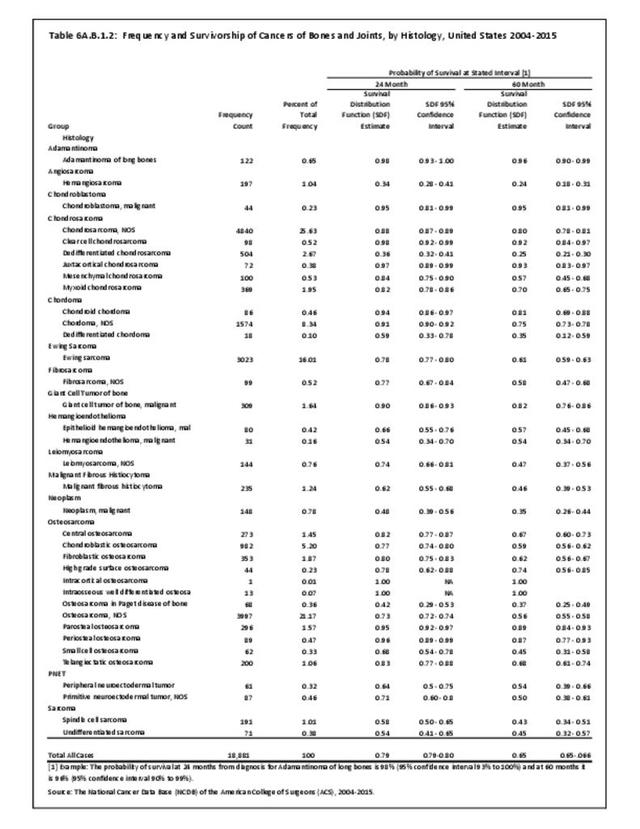
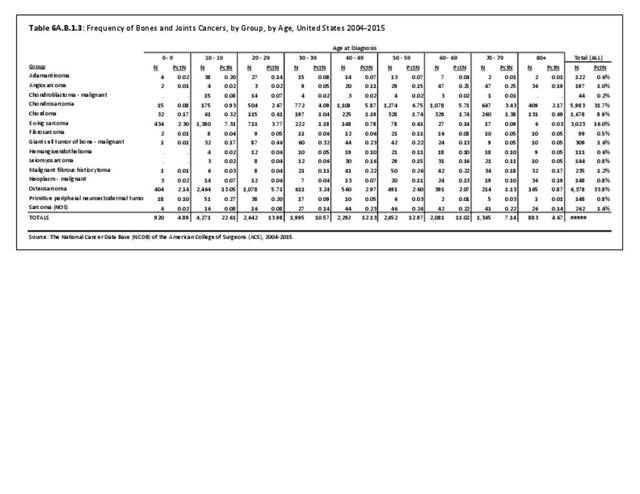
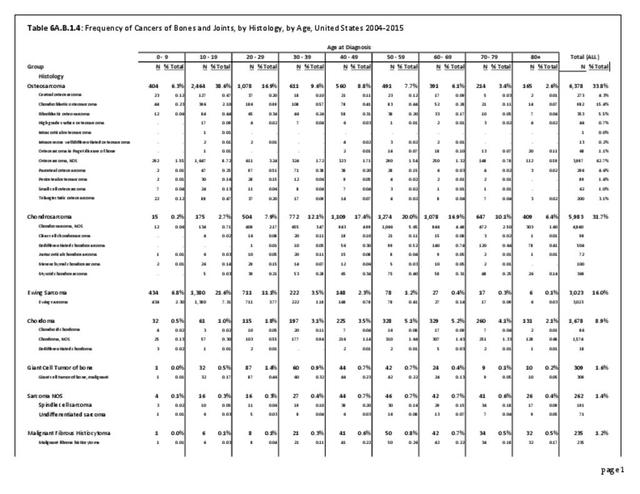
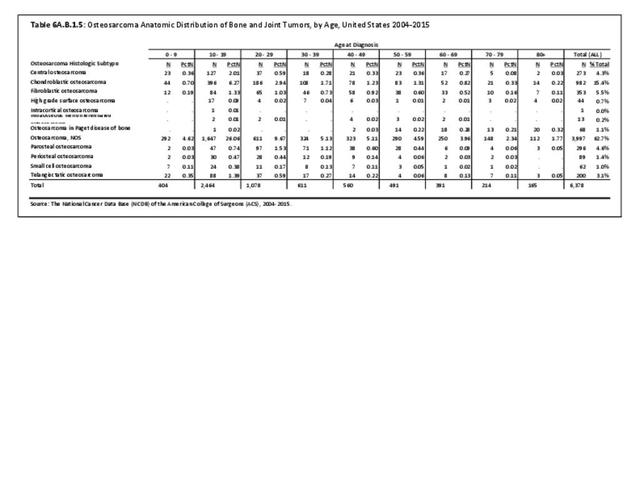
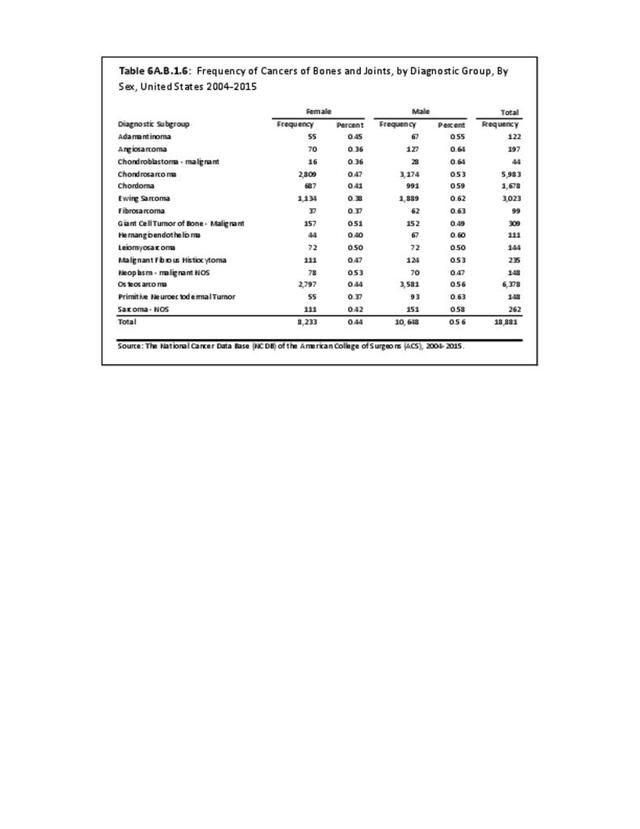
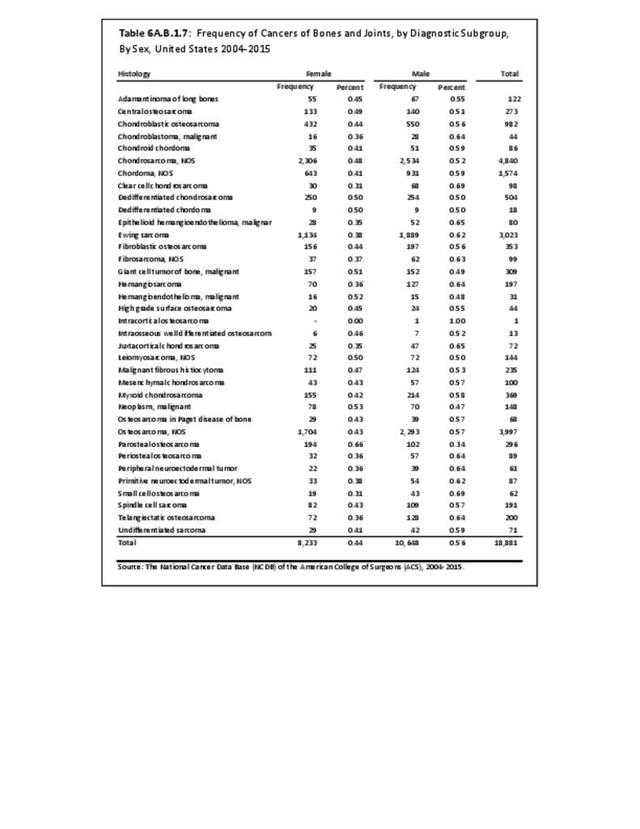
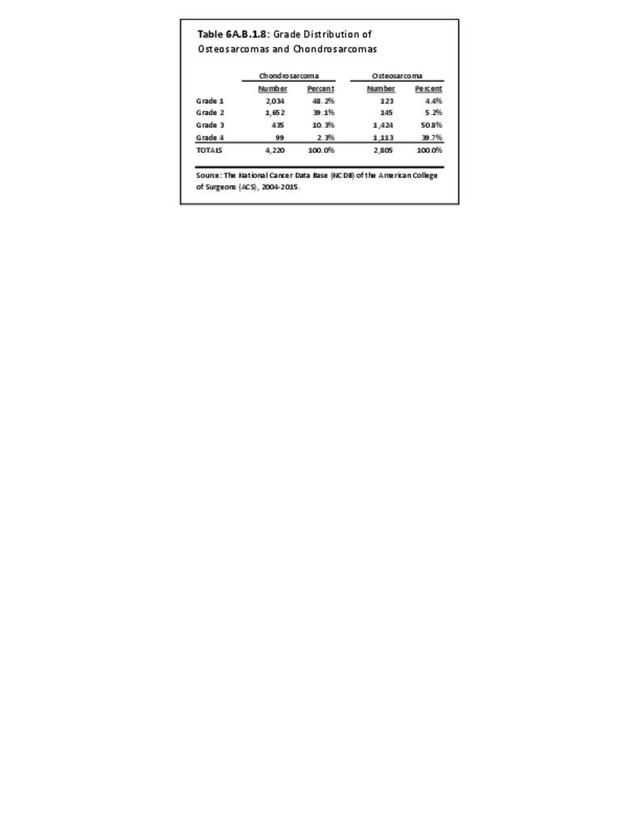
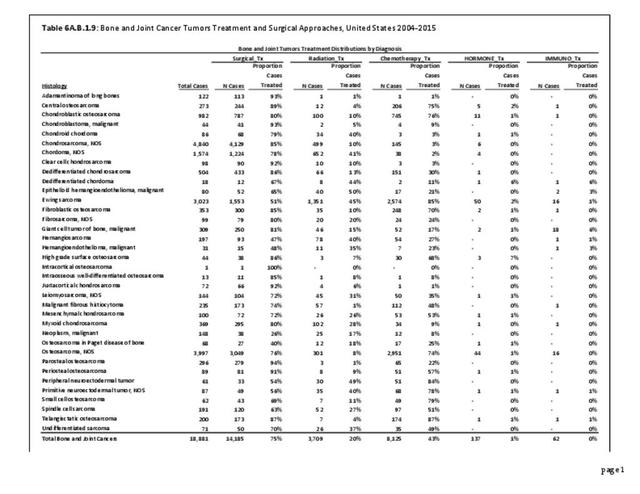
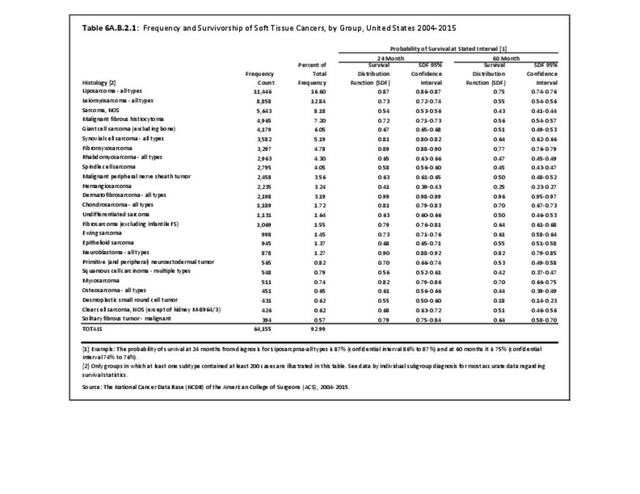
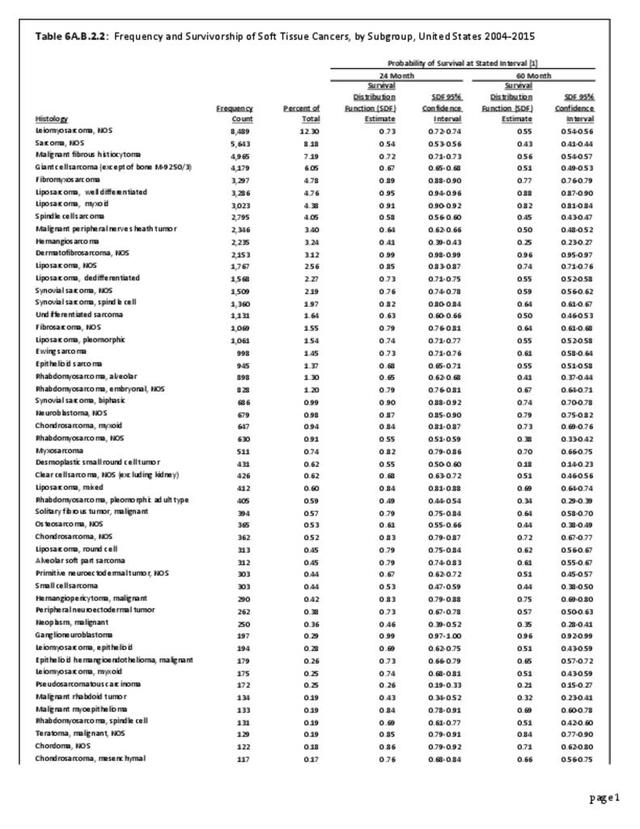
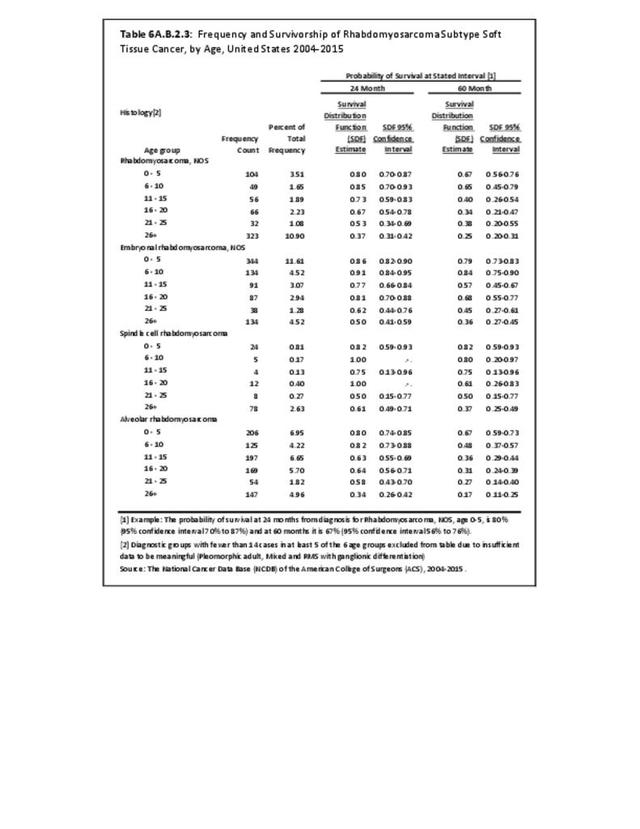
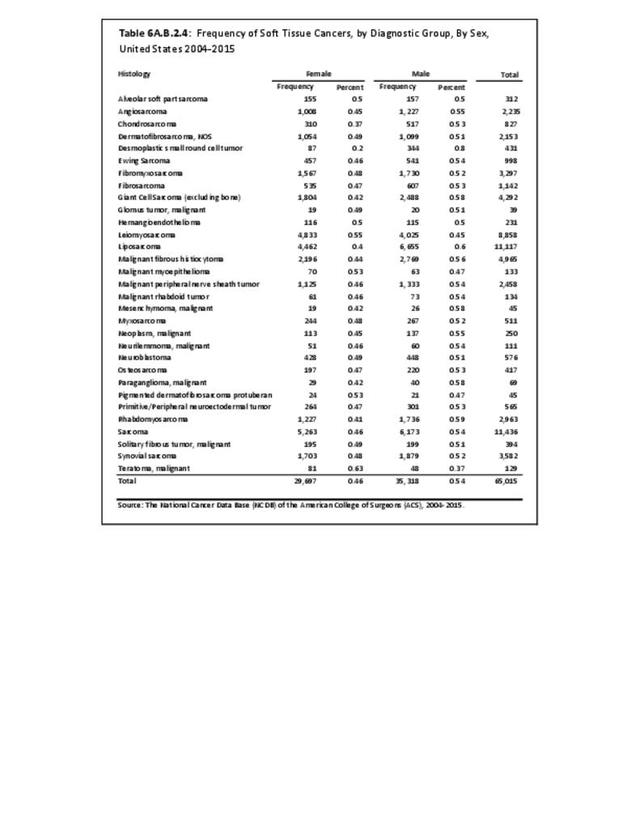
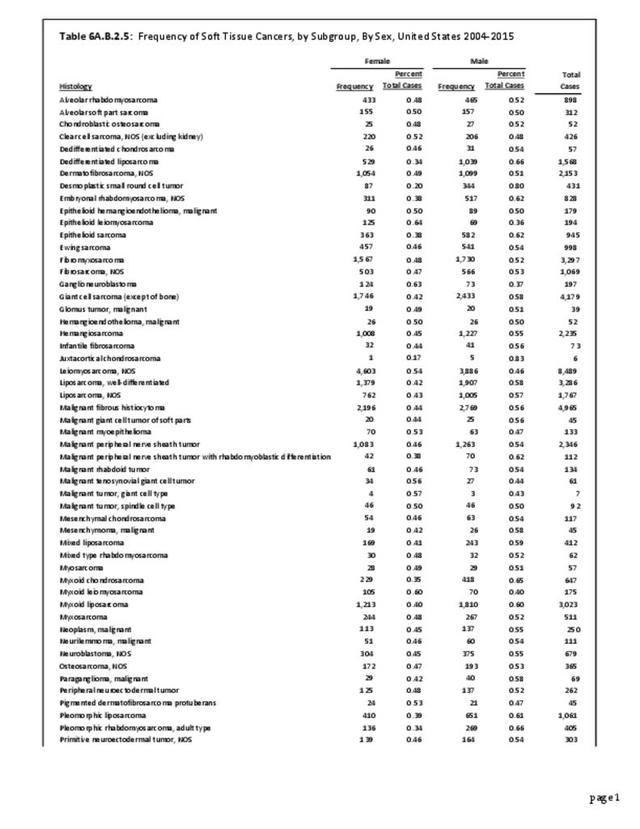
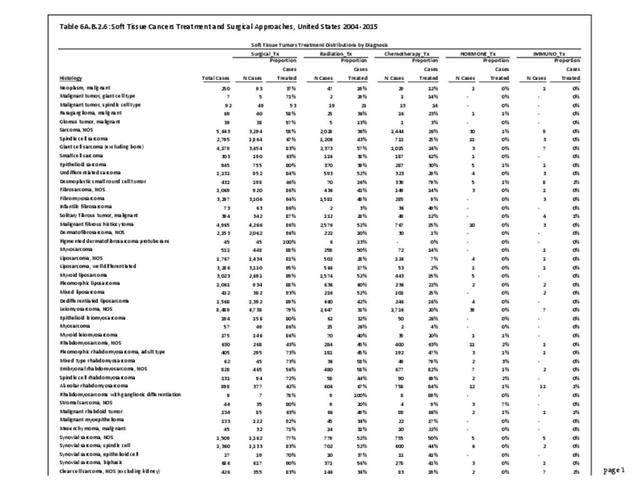
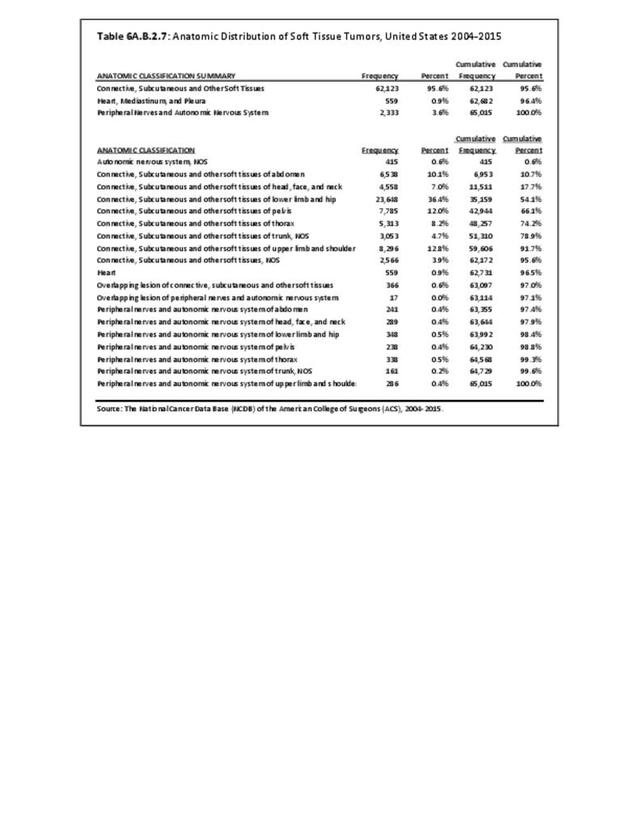
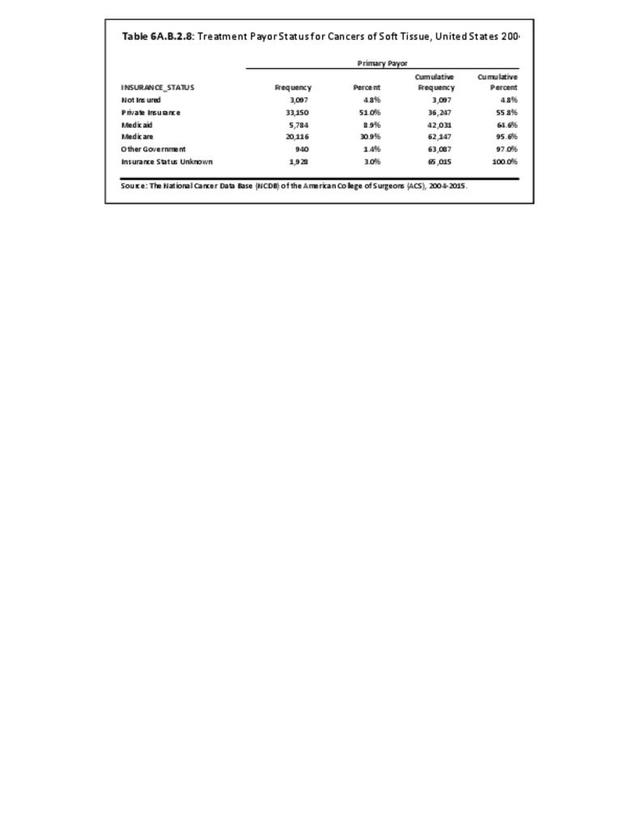
Within the NCDB, no change in the overall survival rates for patients diagnosed and treated in the years 1985 to 1988 compared to patients between 1994 and 1998 was found. There have been no substantial changes in therapies utilized for osteosarcoma since 1998, and the overall 1998-2010 NCDB data reveals no significant improvement, with an approximate 50% 5-year overall survival. However, the survival rate varies greatly with the histologic subtype of sarcoma. For instance, the 5-year relative survival rate is 56% for classic high-grade osteosarcoma, 89% for parosteal osteosarcoma, and 37% for osteosarcoma associated with Paget's disease of the bone. The most recent NCDB database investigation the three primary authors have performed, which covered patients diagnosed between 2004-2015, inclusive, is summarized in the data tables attached to this chapter. These data provide the analysis of the numbers of cases reported during these years, along with the Kaplan-Meier survivorship of the major diagnostic groupings, as well as of the subgroups and age-based for the various primary bone and joint tumors reported and treated 2004-2015. (Reference Table 6A.B.1.1 PDF CSV; Table 6A.B.1.2 PDF CSV; Table 6A.B.1.3 PDF CSV; and Table 6A.B.1.4 PDF CSV)

The above and all other reported survivorships in this chapter were generated using SAS/STAT software, Version14.2 for Windows 3. Copyright 2002-2012, SAS Institute Inc. SAS and all other SAS Institute Inc. product or service names are registered trademarks or trademarks of SAS Institute Inc., Cary, NC, USA. As stated previously, the NCDB is a joint project of the Commission on Cancer of the American College of Surgeons and the American Cancer Society. The data used in this study and this report are derived from a de-identified NCDB file comprising more than 1,500 Commission-accredited cancer programs. The American College of Surgeons and the Commission on Cancer have not verified and are not responsible for the analytic or statistical methodology employed or the conclusions drawn from these data by the investigator and authors of this chapter.
- 1. SEER Cancer Stat Facts: Bone and Joint Cancer. National Cancer Institute. Bethesda, MD, https://seer.cancer.gov/statfacts/html/bones.html . Accessed January 25, 2018.
- 2. Damron TA , Ward WG, Stewart A. Osteosarcoma, chondrosarcoma, and Ewing sarcoma: National Cancer Center Data Base Report. Clin Orthop Relat Res 2007;459·40-47.
- 3. National Institutes of Health. National Cancer Institute, Division of Cancer Control & Population Sciences., Surveillance Research Program. Table 1.4: Age-Adjusted SEER Incidence and U.S. Death Rates and 5-Year Relative Survival (Percent) By Primary Cancer Site, Sex and Time Period. https://surveillance.cancer.gov/statistics/types/survival.html Accessed October 29, 2019.
- 4. Cancer.net. Osteosarcoma-Childhood Statistics. Available at: https://www.cancer.net/cancer-types/osteosarcoma-childhood/statistics. Accessed January 25, 2018.
- 5. Cancer.net. Ewing Sarcoma-Childhood Statistics. Available at: https://www.cancer.net/cancer-types/ewing-sarcoma-childhood-and-adolesce... . Accessed January 25, 2018.
Edition:
- Fourth Edition