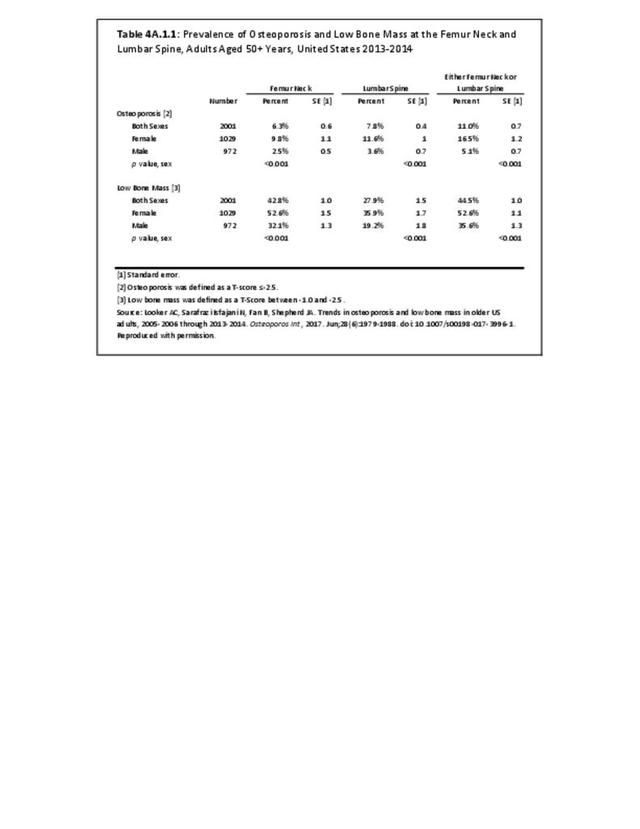
In addition to BMD testing, osteoporosis can be clinically diagnosed in individuals who have had a fragility fracture, irrespective of BMD, particularly if that fracture occurs at the hip or spine.1
There is no single national database that captures all hip and clinical spine fractures and estimates how many additional people have fractures without BMD-defined osteoporosis. One of the most comprehensive databases for evaluation of the total number of hospitalized fractures is the Agency for Healthcare Research and Quality’s (AHRQ) Nationwide Inpatient Sample (NIS). The NIS includes more than 8 million inpatient hospitalizations each year from all payers in the United States.
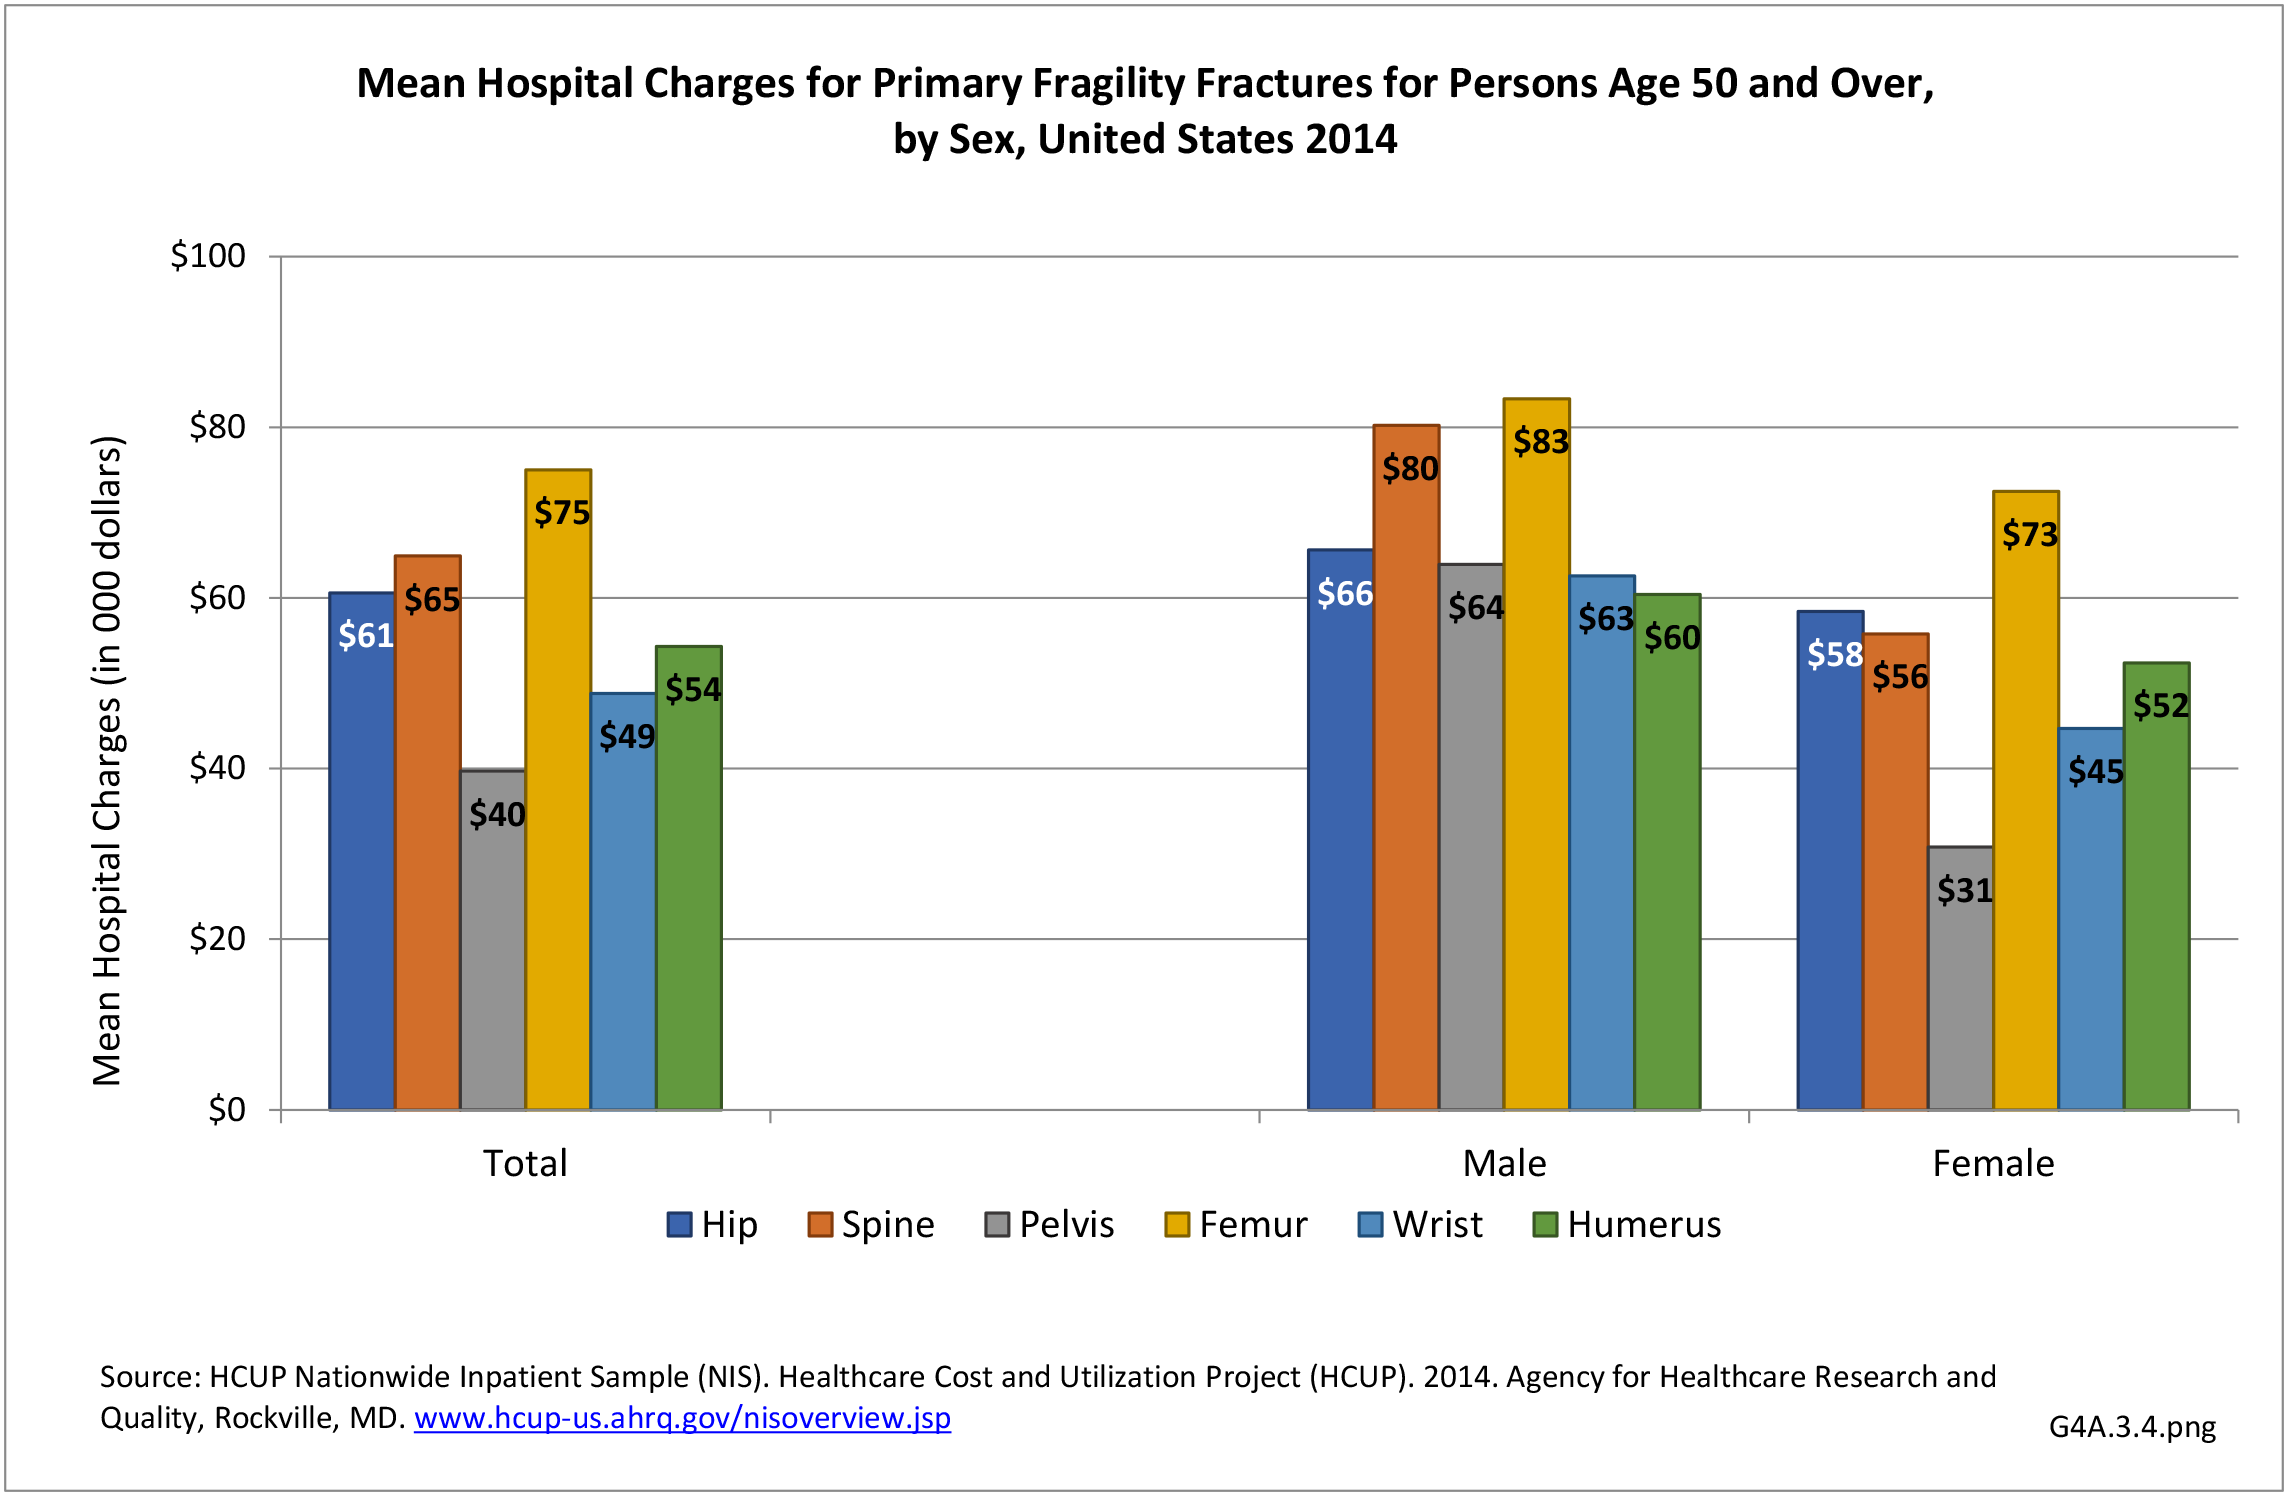
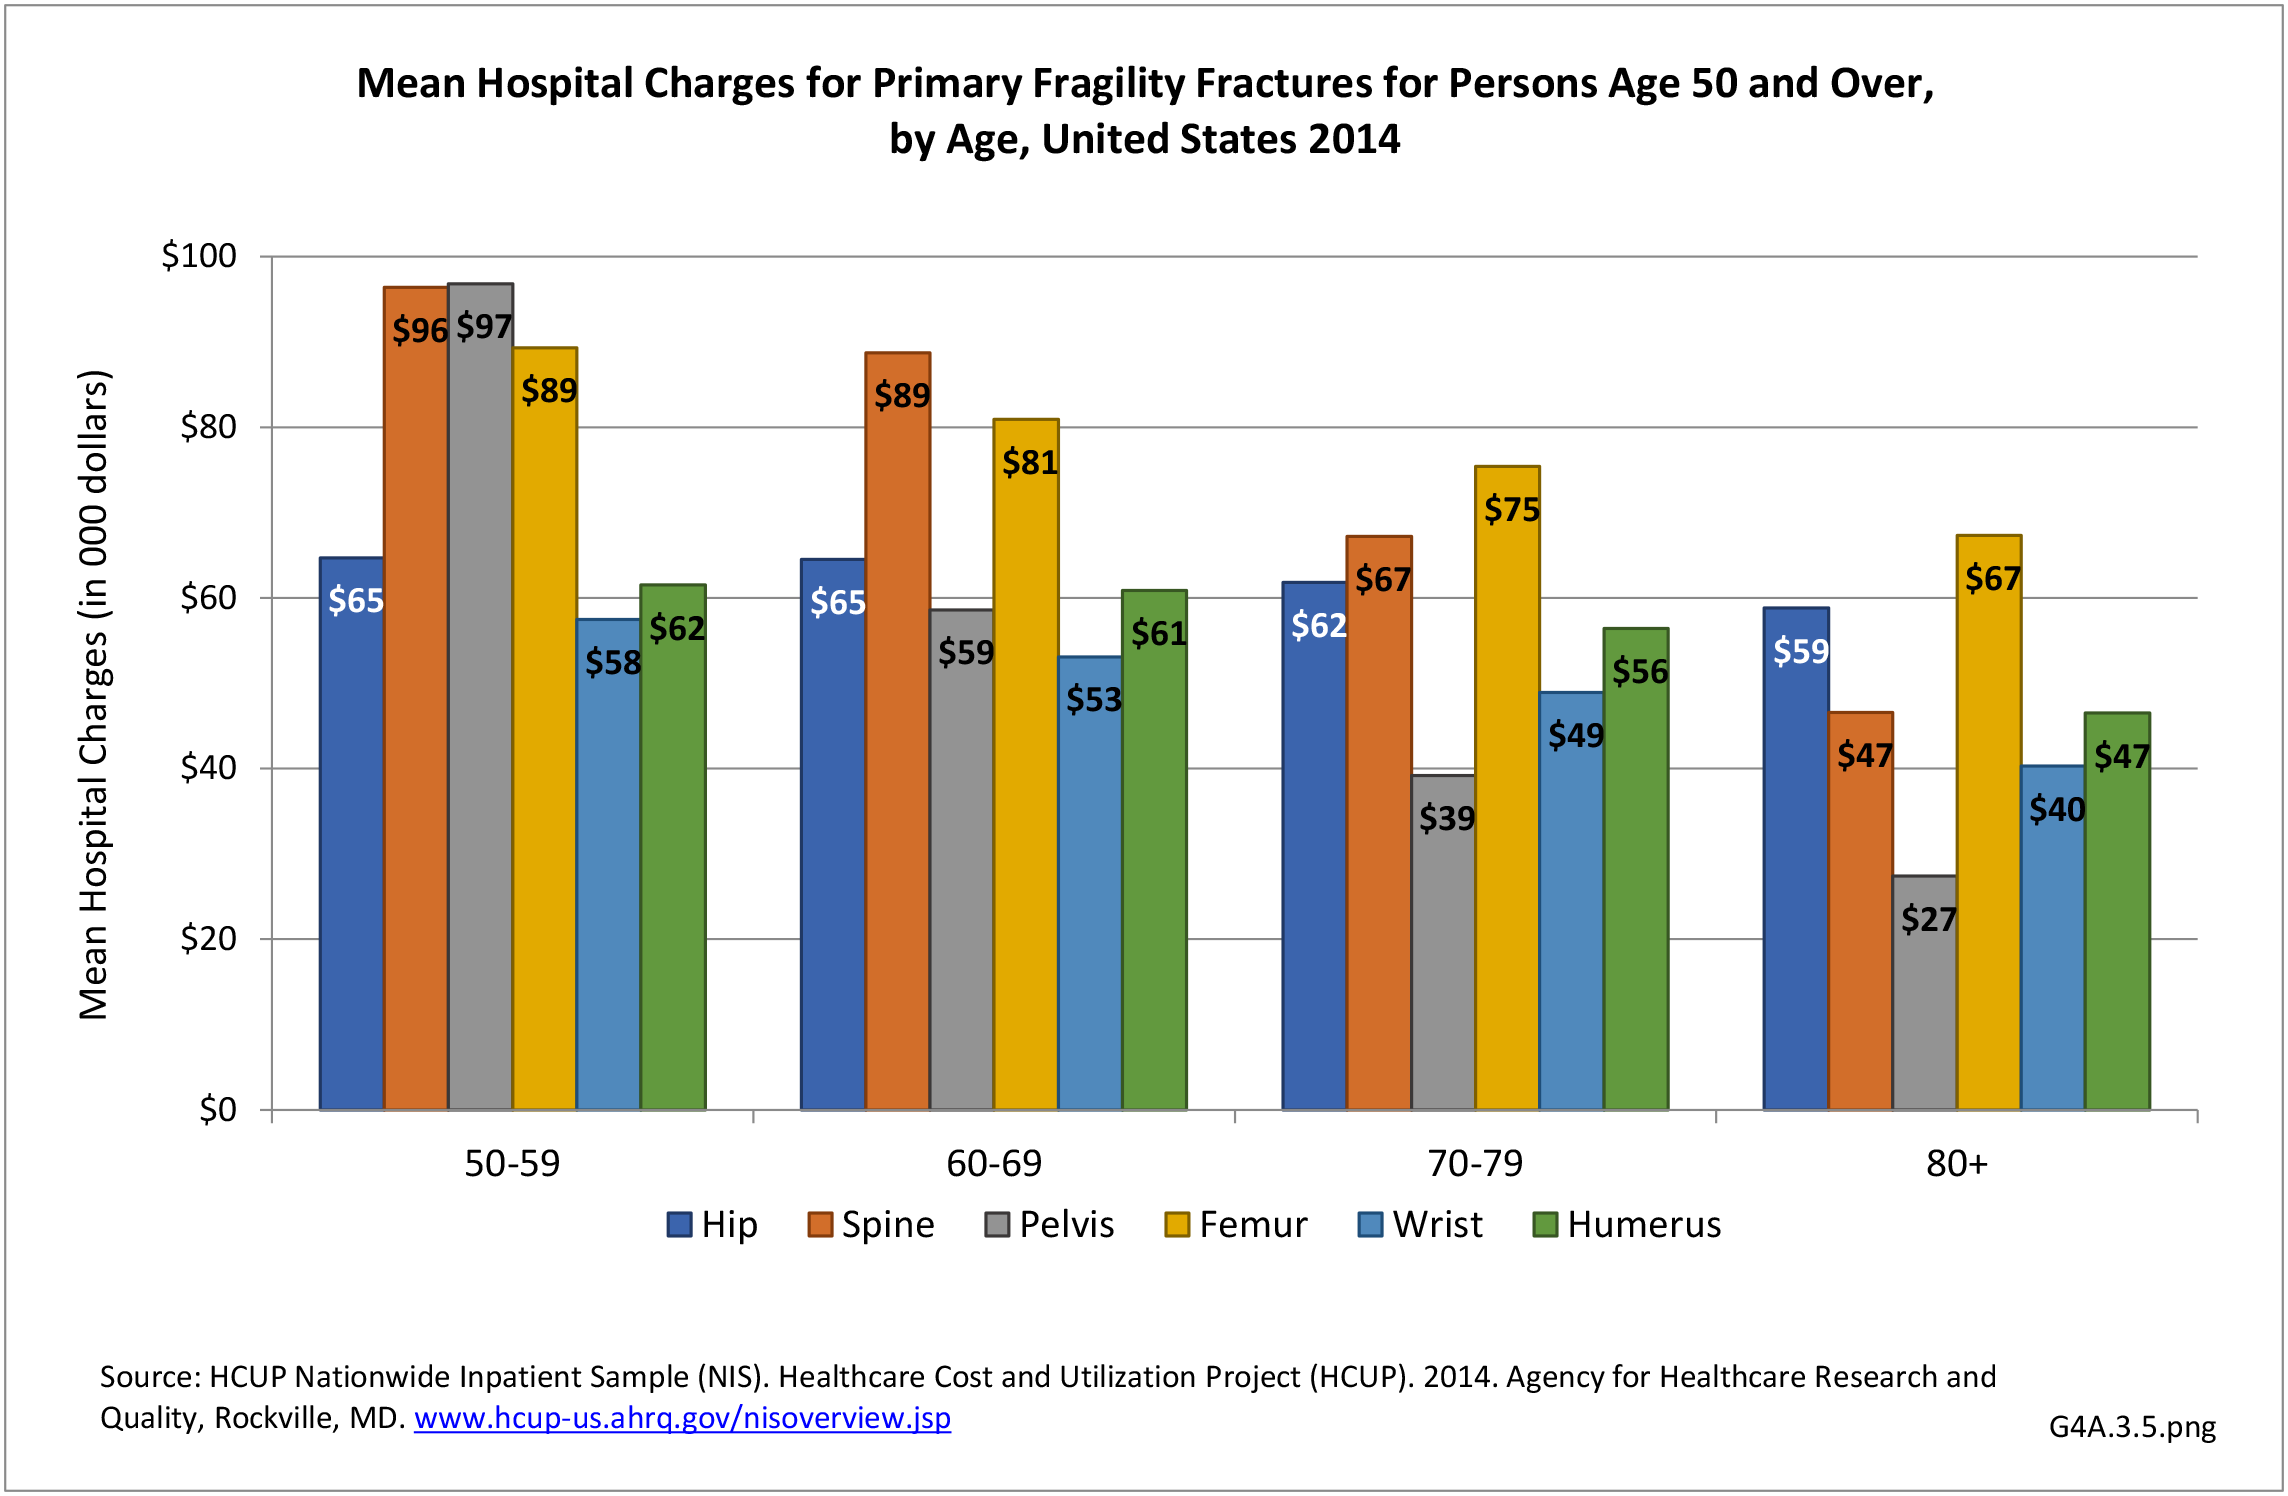
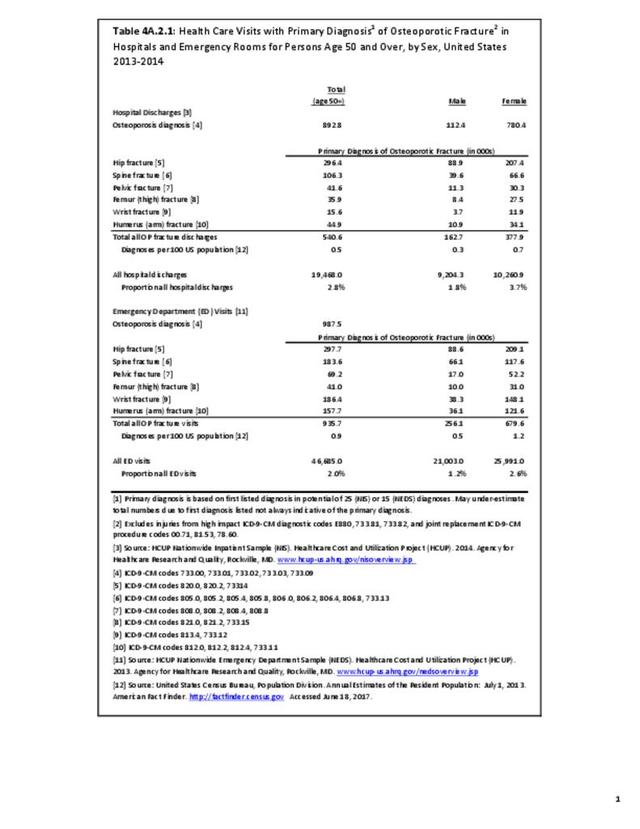
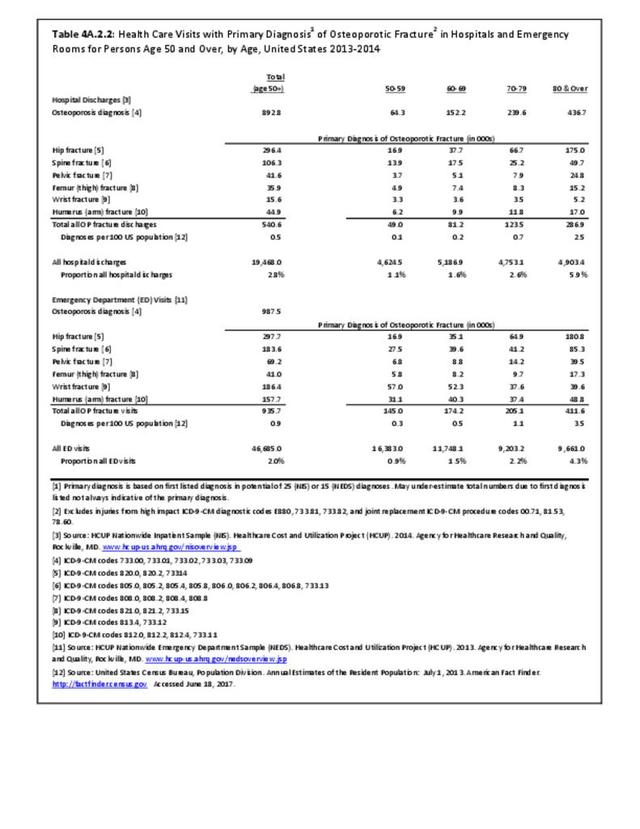
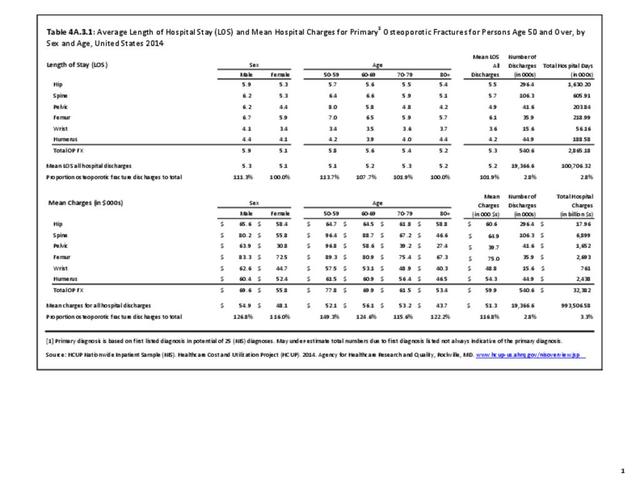
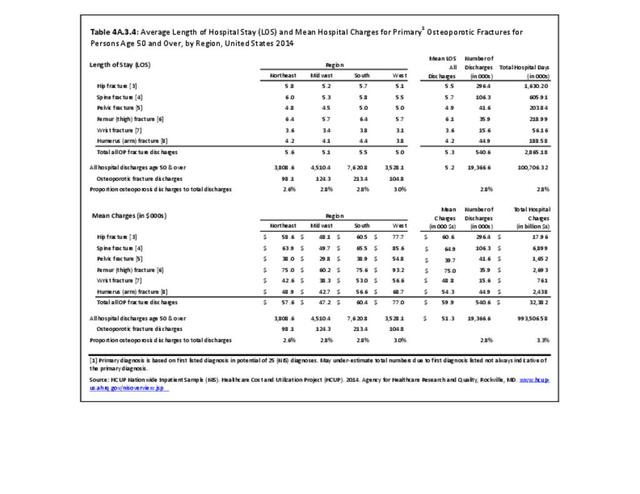
We evaluated the 2013-2014 NIS sample to estimate the number of discharges for fragility fractures, defined as a fracture of the hip, spine, pelvis, femur, humerus or wrist. Among US adults aged 50 and above, there were a total of 19.5 million hospital discharges, of which 540,600 (2.8%) were for fragility fractures. The distribution of these fractures by fracture type, sex, and age can be seen below. As expected, the prevalence of fractures is higher in women than in men, with fragility fractures representing 3.7% of the total hospital discharges in 2013-2014 in women, compared to only 1.8% in men. Likewise, the prevalence of fracture increased with age, with persons age 80 and over representing only 11% of the 50+ population, but accounting for 25% of fractures. (Reference Table 4A.2.1 PDF CSV and Table 4A.2.2 PDF CSV)

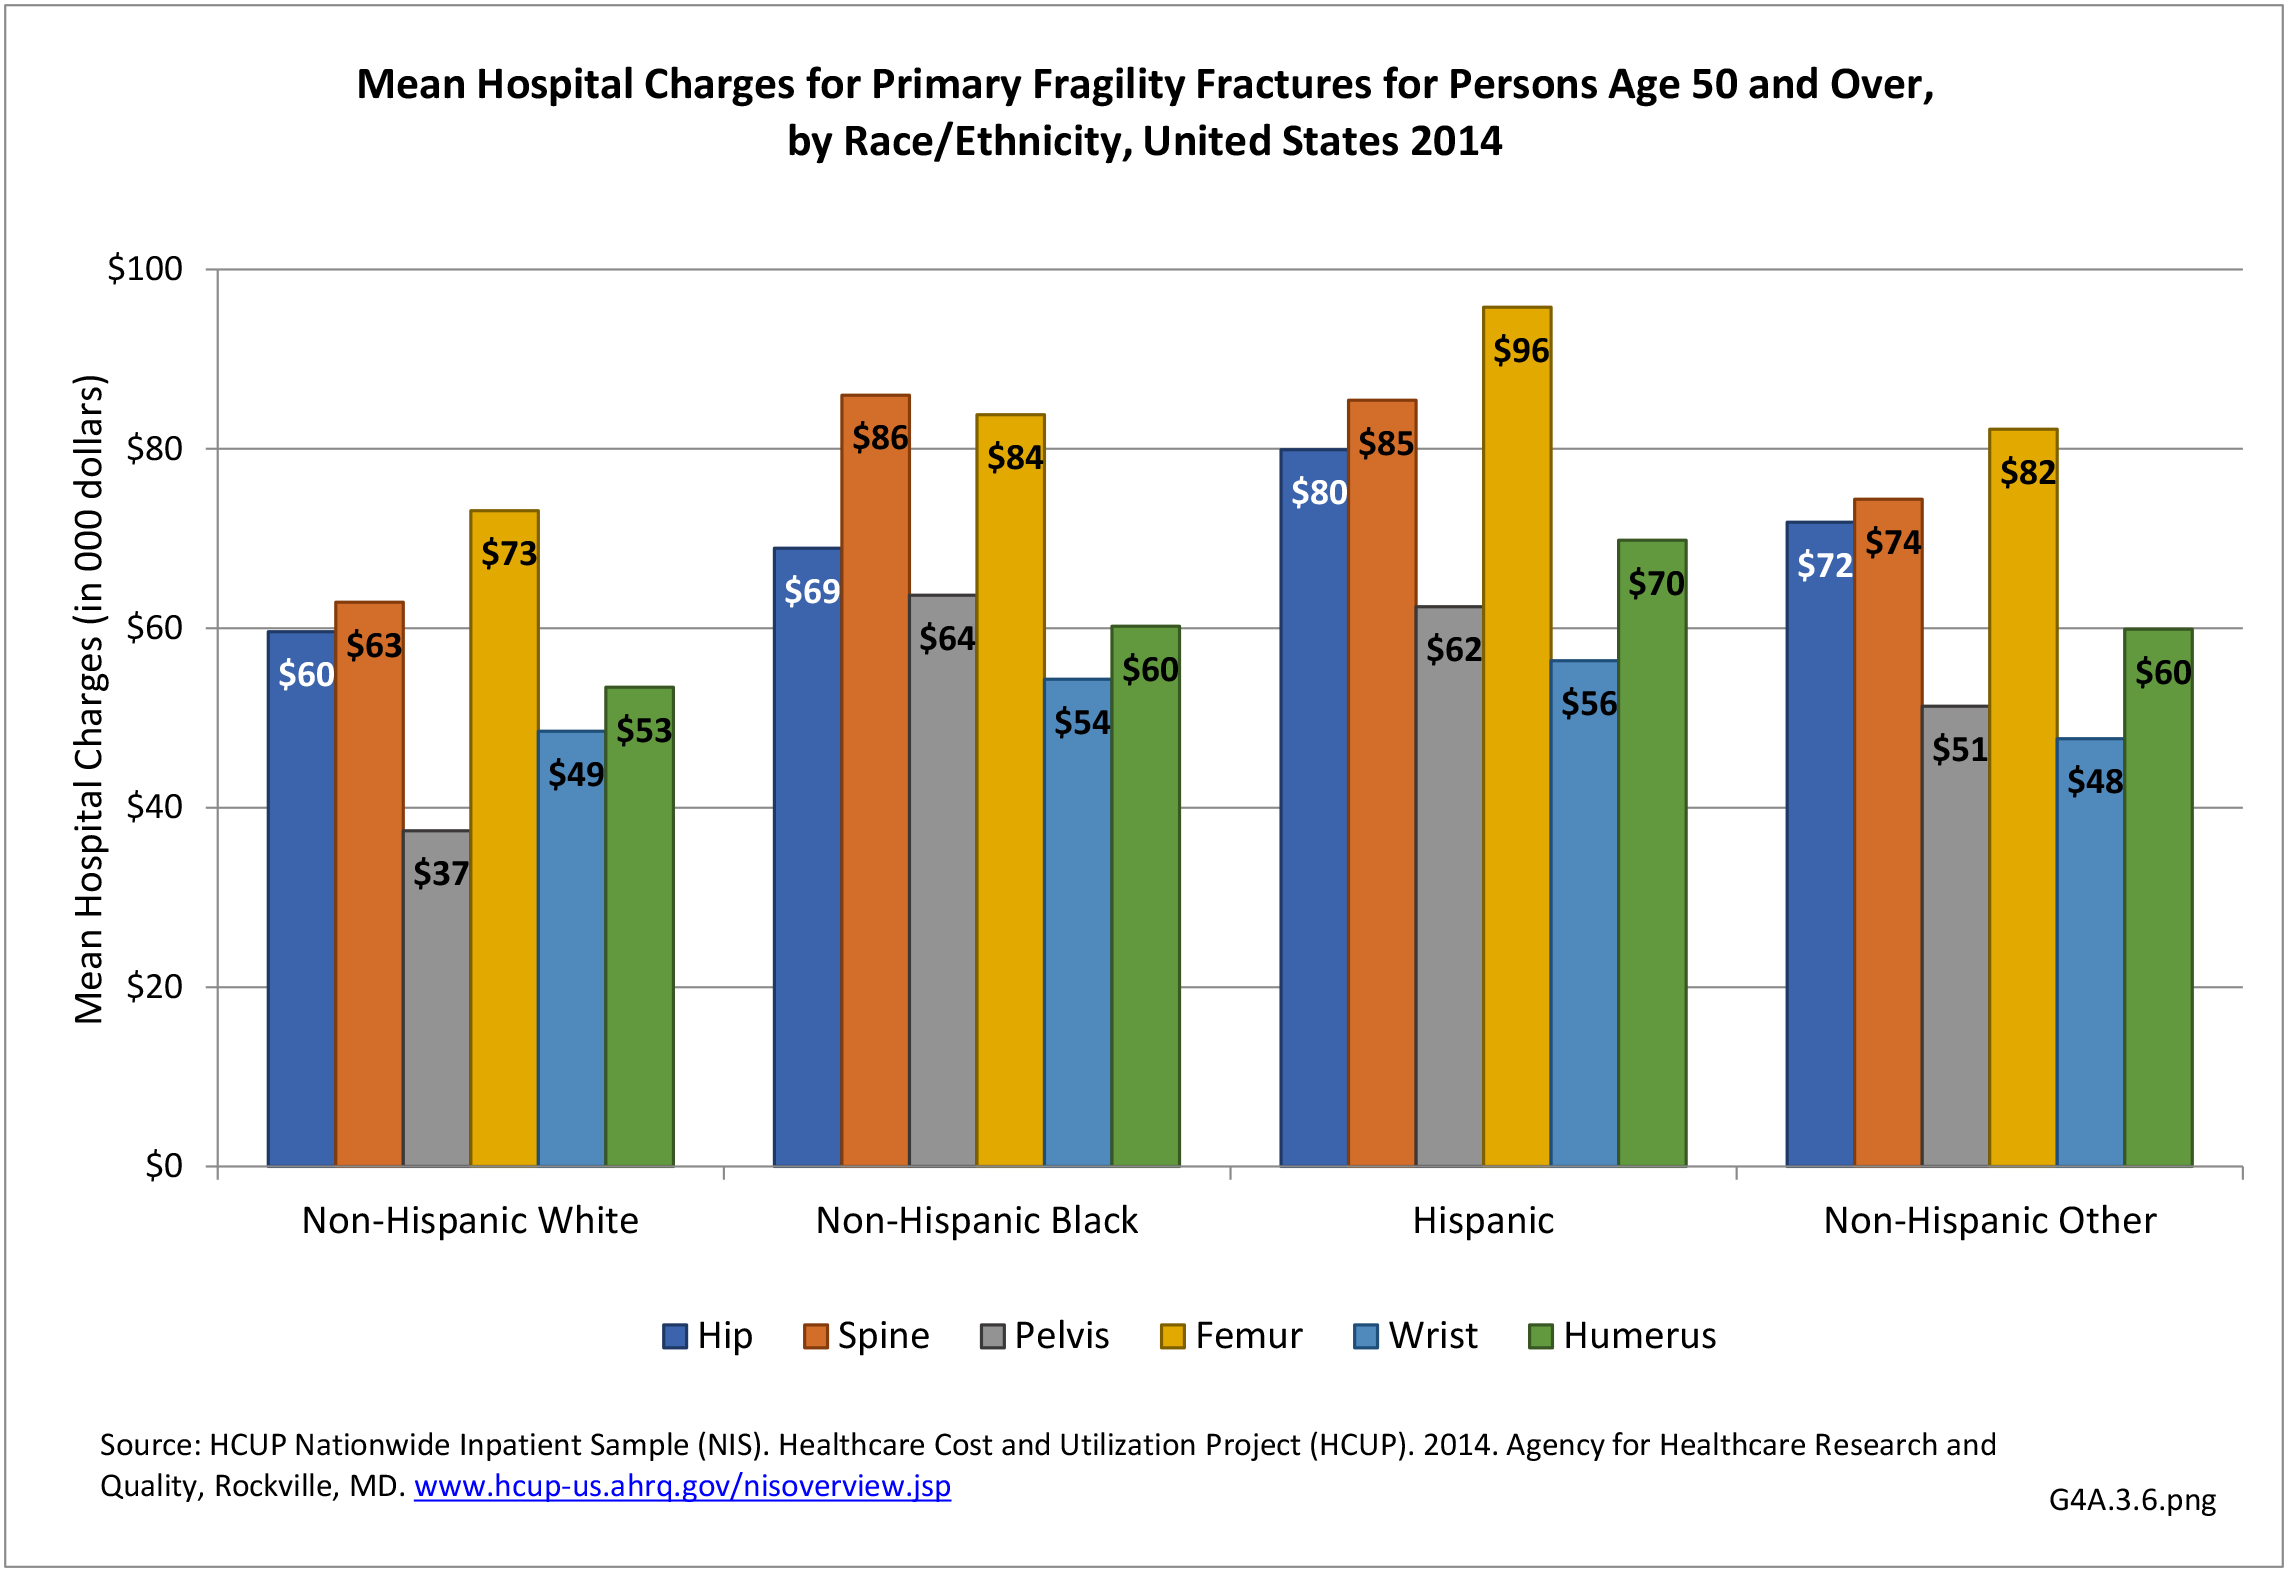
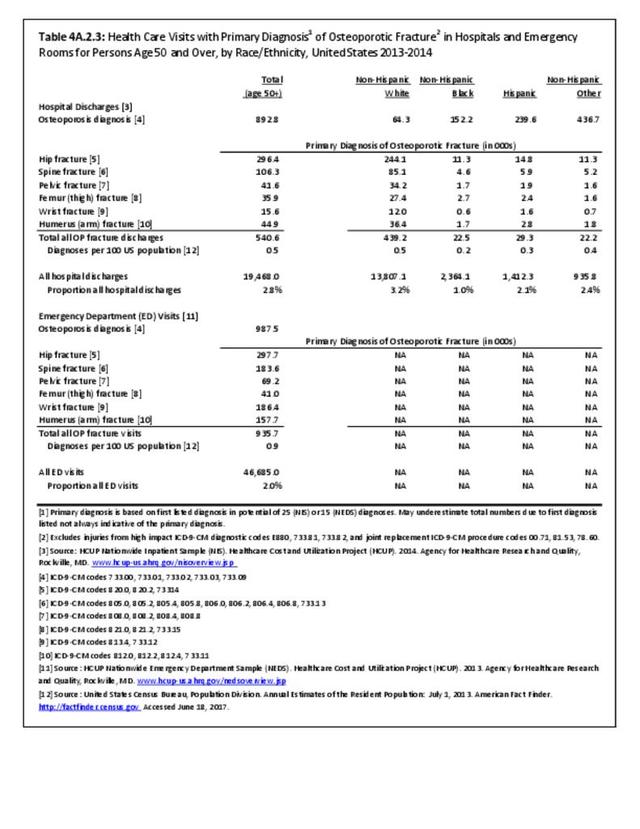
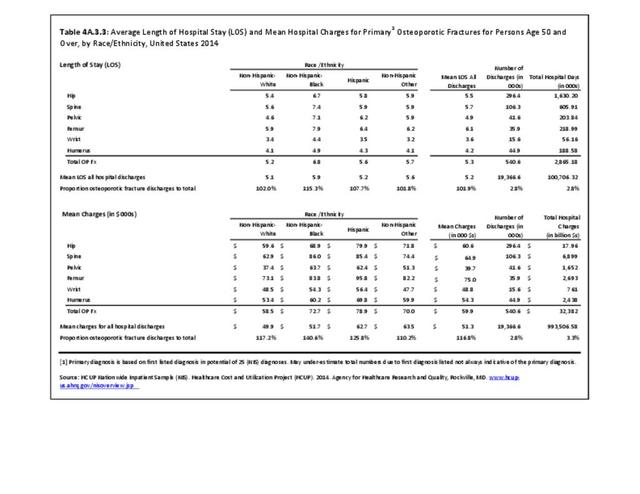
We also evaluated the distribution of fragility fractures by race and ethnicity. Overall non-Hispanic white individuals had the highest number of hospital discharges associated with fragility fractures, particularly at the hip and the spine. Hispanic individuals had a larger number of discharges for fragility fractures other than hip and femur than the non-Hispanic black and the other race and ethnic groups. However, when compared to the proportion of the over 50 population in the US by race/ethnicity group, non-Hispanic whites, with a ratio of 1.1 (fractures to population) accounted for the highest incidence of all fractures. Non-Hispanic blacks had the lowest ratio (0.4), followed by Hispanics (0.6), and non-Hispanic others (0.7). (Reference Table 4A.2.3 PDF CSV)

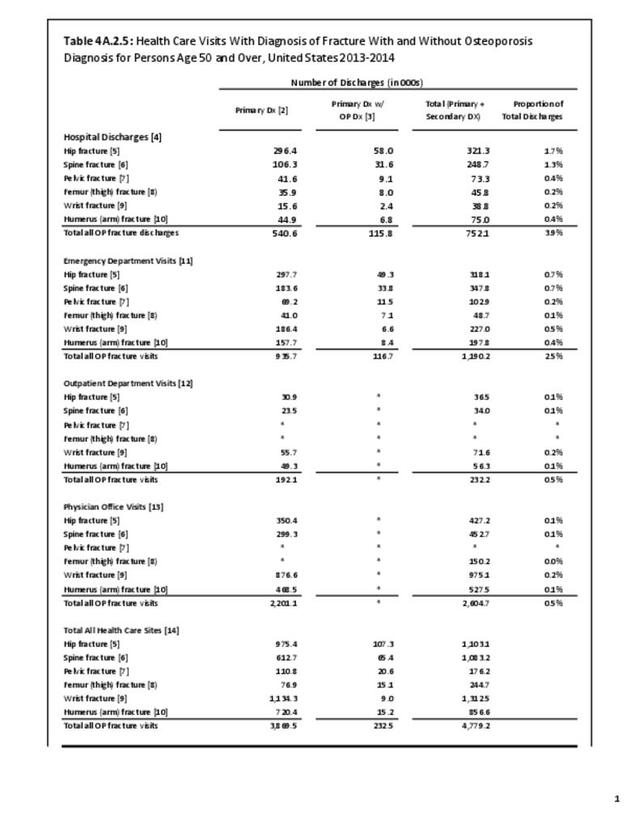
Relying on hospitalized fractures underestimates the true prevalence of all fragility fractures in the United States. For example, wrist fractures do not require hospital treatment and approximately two-thirds of all vertebral fractures are not clinically diagnosed.2 This is evident in our data. The 2012-2014 NIS dataset reports over 500,000 hospital discharges for fractures. Annually, there are about 1.5-2 million fractures in the US,3, thus, relying on the inpatient database alone clearly underestimates fracture prevalence. The data previously shown also portrays a low number of hospital discharges observed for fracture sites like wrist and spine, which are more frequently observed fracture sites. Again, as previously mentioned, these fracture types do not always require an inpatient hospital stay.
To account for the fracture prevalence underestimation using inpatient data, particularly for wrist fractures, we also utilized the HCUP National Emergency Department Sample (NEDS) to evaluate fragility fractures. The NEDS produces national estimates about ED visits across the country, regardless of whether they result in a hospital admission.4 The 2013-2014 NEDS data included a total of 46.7 million ED visits for all causes, with a primary diagnosis of a fragility fracture in 935,700 (0.9%) of the visits. Again, more visits related to fragility fractures were recorded for women (1.2%) than in men (0.5%). Likewise, the proportion of the total visits for fragility fractures increased from 1.1% to 5.9% hospital discharges age 50-59 years to age 80 years and older, and 0.9% to 4.3% emergency visits for the same age brackets. (Reference Table 4A.2.2 PDF CSV)
The figure below shows the distribution of the fragility fractures by fracture type overall, by sex, and by age. Unlike the hospital discharge data, there are more emergency department visits for fragility fractures of the wrist and humerus. Although overall there is an increase in ED visits for fragility fractures by age, the pattern is not consistent for all types of fractures. This may be due to changes in fracture risk and severity by age. The NEDS data does not routinely collect information on race/and ethnicity, so we were unable to evaluate the distribution of the fractures by race and ethnicity.

Given the clear difference in distribution of hospital discharges and ED visits for fragility fractures such as wrist fractures, the use of multiple data sources to estimate fracture incidence and prevalence in the US seems optimal. However, there are still situations where some fractures are identified via imaging and not treated (e.g. spine fractures), treated in a physician’s office, or are not the primary diagnosis of an ED or inpatient visit but are still a cause of admission. Algorithms can capture these and other situations to identify fragility fractures in administrative claims data, particularly for fragility fractures related to osteoporosis (hip, pelvis, femur, tibia/fibula or ankle, radius/ulna, humerus or scapula, clavicle, and clinical vertebral). Such an algorithm has been validated against medical records in the Medicare patient population and has been shown to have high positive predictive values overall and by each of their definitions.5
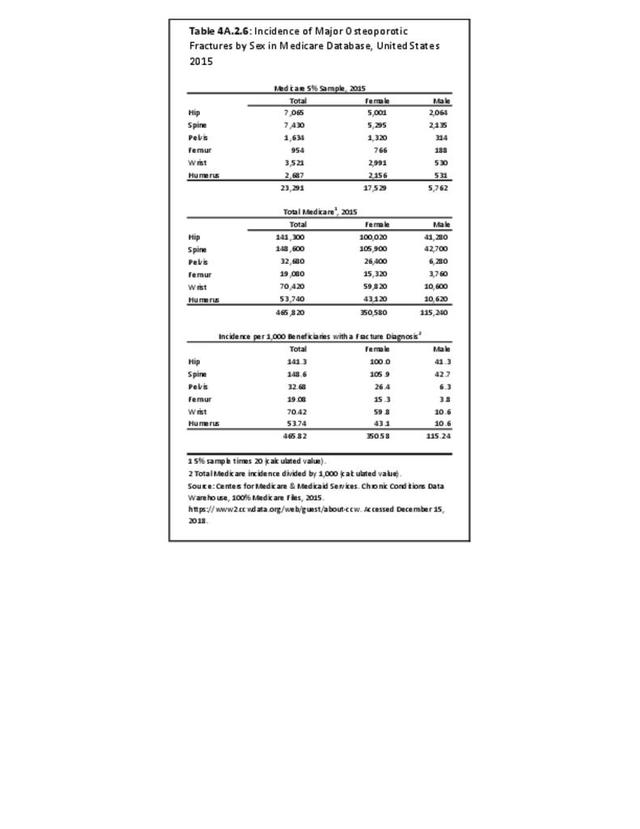
The 2015 incidence of the six major osteoporosis fractures in the Medicare 5% Sample can be found in the Figure below. A total of 465,820 fractures were identified, with 75% of the fractures occurring in women. As observed in the NIS data, hip and spine fractures were the most predominant fracture types, with incidences of 100.0 and 105.9 per 1,000 beneficiaries in women and 41.3 and 42.7 per 1000 in men with a fracture diagnosis, respectively. (Reference Table 4A.2.6 PDF CSV)

Trends in Fragility Fractures
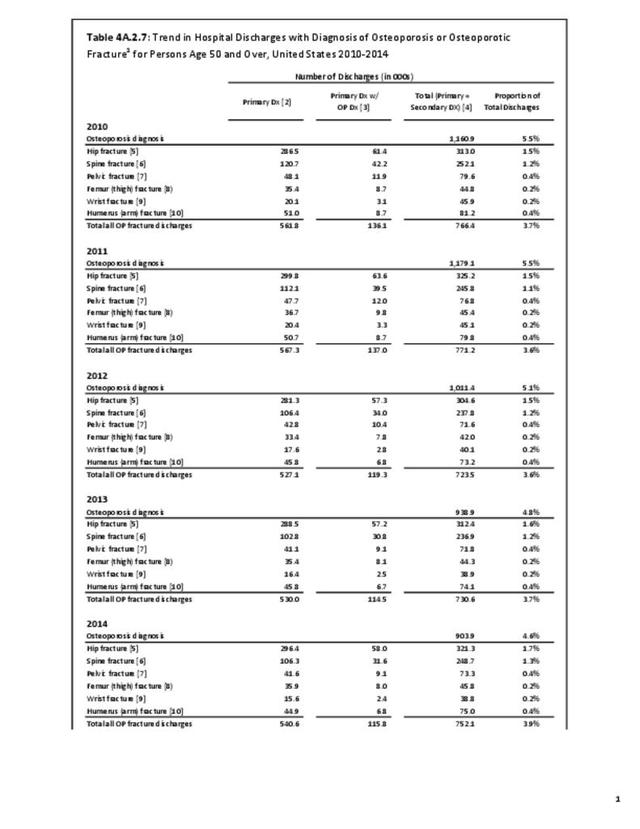
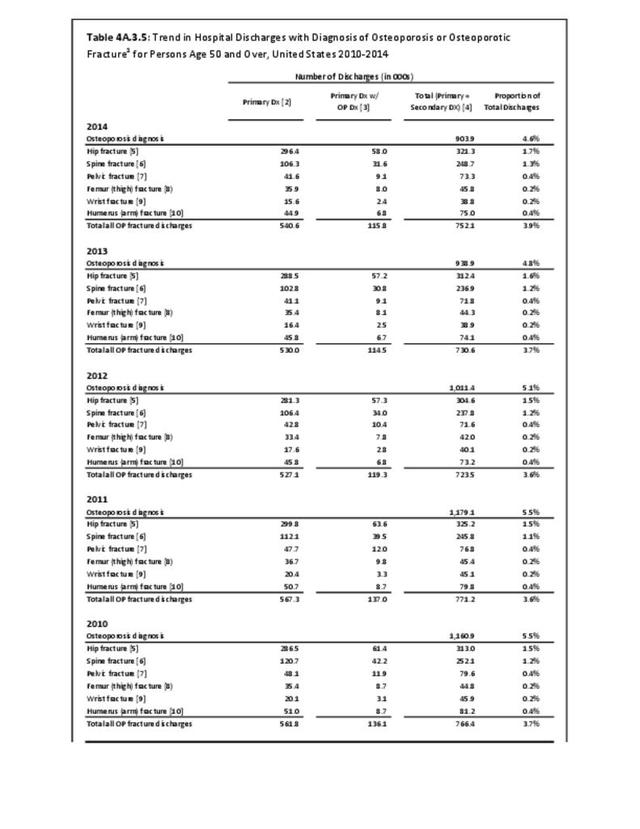
Using the 5% Medicare inpatient claims database, it was reported that the decline in hip fractures observed in women had plateaued since 2012.6 We also evaluated the trends in hip fracture in the 2010-2014 NIS data. We observed that from 2010 to 2014, there was a 3.5% and 1.4% increase in the number of hip and femur fracture discharges, respectively. All other fracture sites had decreases ranging from 12% to 22%. When evaluating the difference between 2012 and 2014, the inflection point observed in the previously cited paper,6 there were 5.4% and 7.5% increases in hip and femur fractures, respectively. The decline in other fractures ranged from 0.1% to 11%. However, overall, fragility fracture discharges remained within a relatively small range for each of the primary fractures over the five-year period. (Reference Table 4A.2.7 PDF CSV)

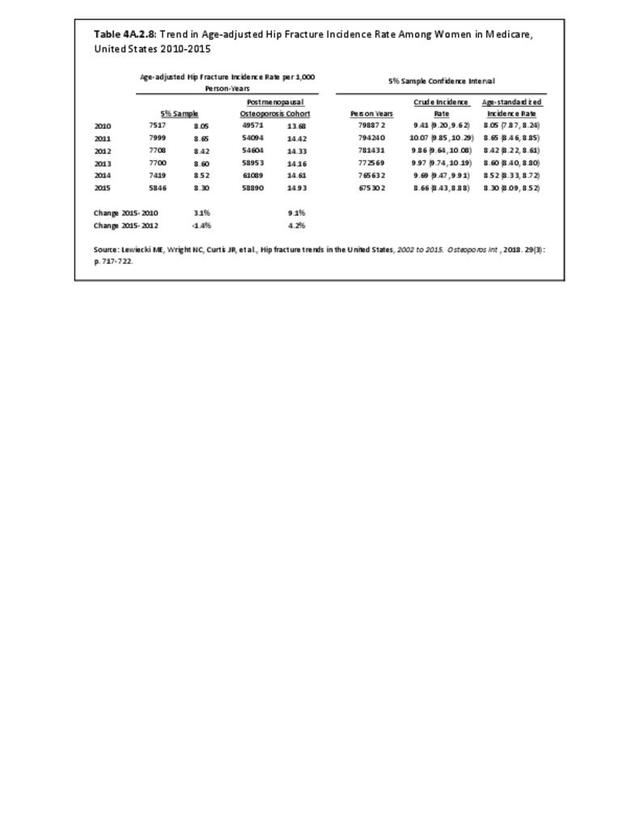
We also evaluated trends in hip fracture using Medicare data among women in the 5% sample and all women with postmenopausal osteoporosis (PMO). Women with PMO were identified if they had an osteoporosis diagnosis code, were taking osteoporosis medications, and/or sustained a major osteoporotic fracture.7 Similar to previous reports, we observed a plateau in the incidence of hip fractures in the most recent years of Medicare data available. In the 5% sample, more generalizable to all female Medicare beneficiaries, we observed a 3.1% increase in the age-standardized incidence rate from 2010 to 2015; however, the confidence intervals for these incidence rates overlapped, suggesting no significant difference between the two rates [8.05 (7.87, 8.24) vs. 8.30 (8.09, 8.52)]. The incidence rate from the last four years, 2012 to 2015, showed a slight increase, but again, this difference was not significant [8.42 (8.22, 8.61) vs. 8.30 (8.09,8.52)], indicating a relatively stable hip fracture incidence rate during this time window.
However, in the PMO cohort, a cohort potentially at higher risk for fragility fractures, we observed an increase in the incidence rate of hip fracture over time. From 2010 to 2015, the hip fracture incidence increased by 9.1%, slowing down from 2012 to 2015, to a hip fracture incidence increase of 4.2%. Each of these increases was statistically significant, as the confidence intervals did not overlap during these time windows. This increase in the hip fracture incidence could be due to the osteoporosis “treatment gap,” which will be discussed later in the chapter. (Reference Table 4A.2.8 PDF CSV)

- 1. Siris ES, Adler R, Bilezikian J, et al. The clinical diagnosis of osteoporosis: a position statement from the National Bone Health Alliance Working Group. Osteoporos Int. 2014; 25(5):1439-1443. doi: 10.1007/s00198-014-2655-z.
- 2. Singer A., Alex Exuzides A, Spangler L, et al. Burden of illness for osteoporotic fractures compared with other serious diseases among postmenopausal women in the United States. Mayo Clin Proc. 2015;90(1):53-62.
- 3. Burge R, Dawson-Hughes B, Solomon DH, et al.: Incidence and economic burden of osteoporosis-related fractures in the United States, 2005–2025. J Bone Miner Res. 2007;22:465–475.
- 4. NEDS Database Documentation. Healthcare Cost and Utilization Project (HCUP). 2018 [cited 2018 July 12]; Available from:https://www.hcup-us.ahrq.gov/db/nation/neds/nedsdbdocumentation.jsp.
- 5. Wright NC, Daigle S, Melton ME, Delzell ES, Balasubramanian A, Curtis JR. The design and validation of a new algorithm to identify initial incident and recurrent incident fragility fractures in administrative claims data. J Bone Miner Res. 2019. doi: 10.1002/jbmr.3807. [Epub ahead of print]
- 6. a. b. Lewiecki ME, Wright NC, Curtis JR, et al., Hip fracture trends in the United States, 2002 to 2015. Osteoporos Int. 2018;29(3):717-722.
- 7. Xue f, Ma H, Stehman-Breen C, et al. Design and methods of a postmarketing pharmacoepidemiology study assessing long-term safety of Prolia® (denosumab) for the treatment of postmenopausal osteoporosis. Pharmacoepidemiol Drug Saf. 2013;22(10):1107-1114. doi: 10.1002/pds.3477. Epub 2013 Jul 15.
Edition:
- Fourth Edition