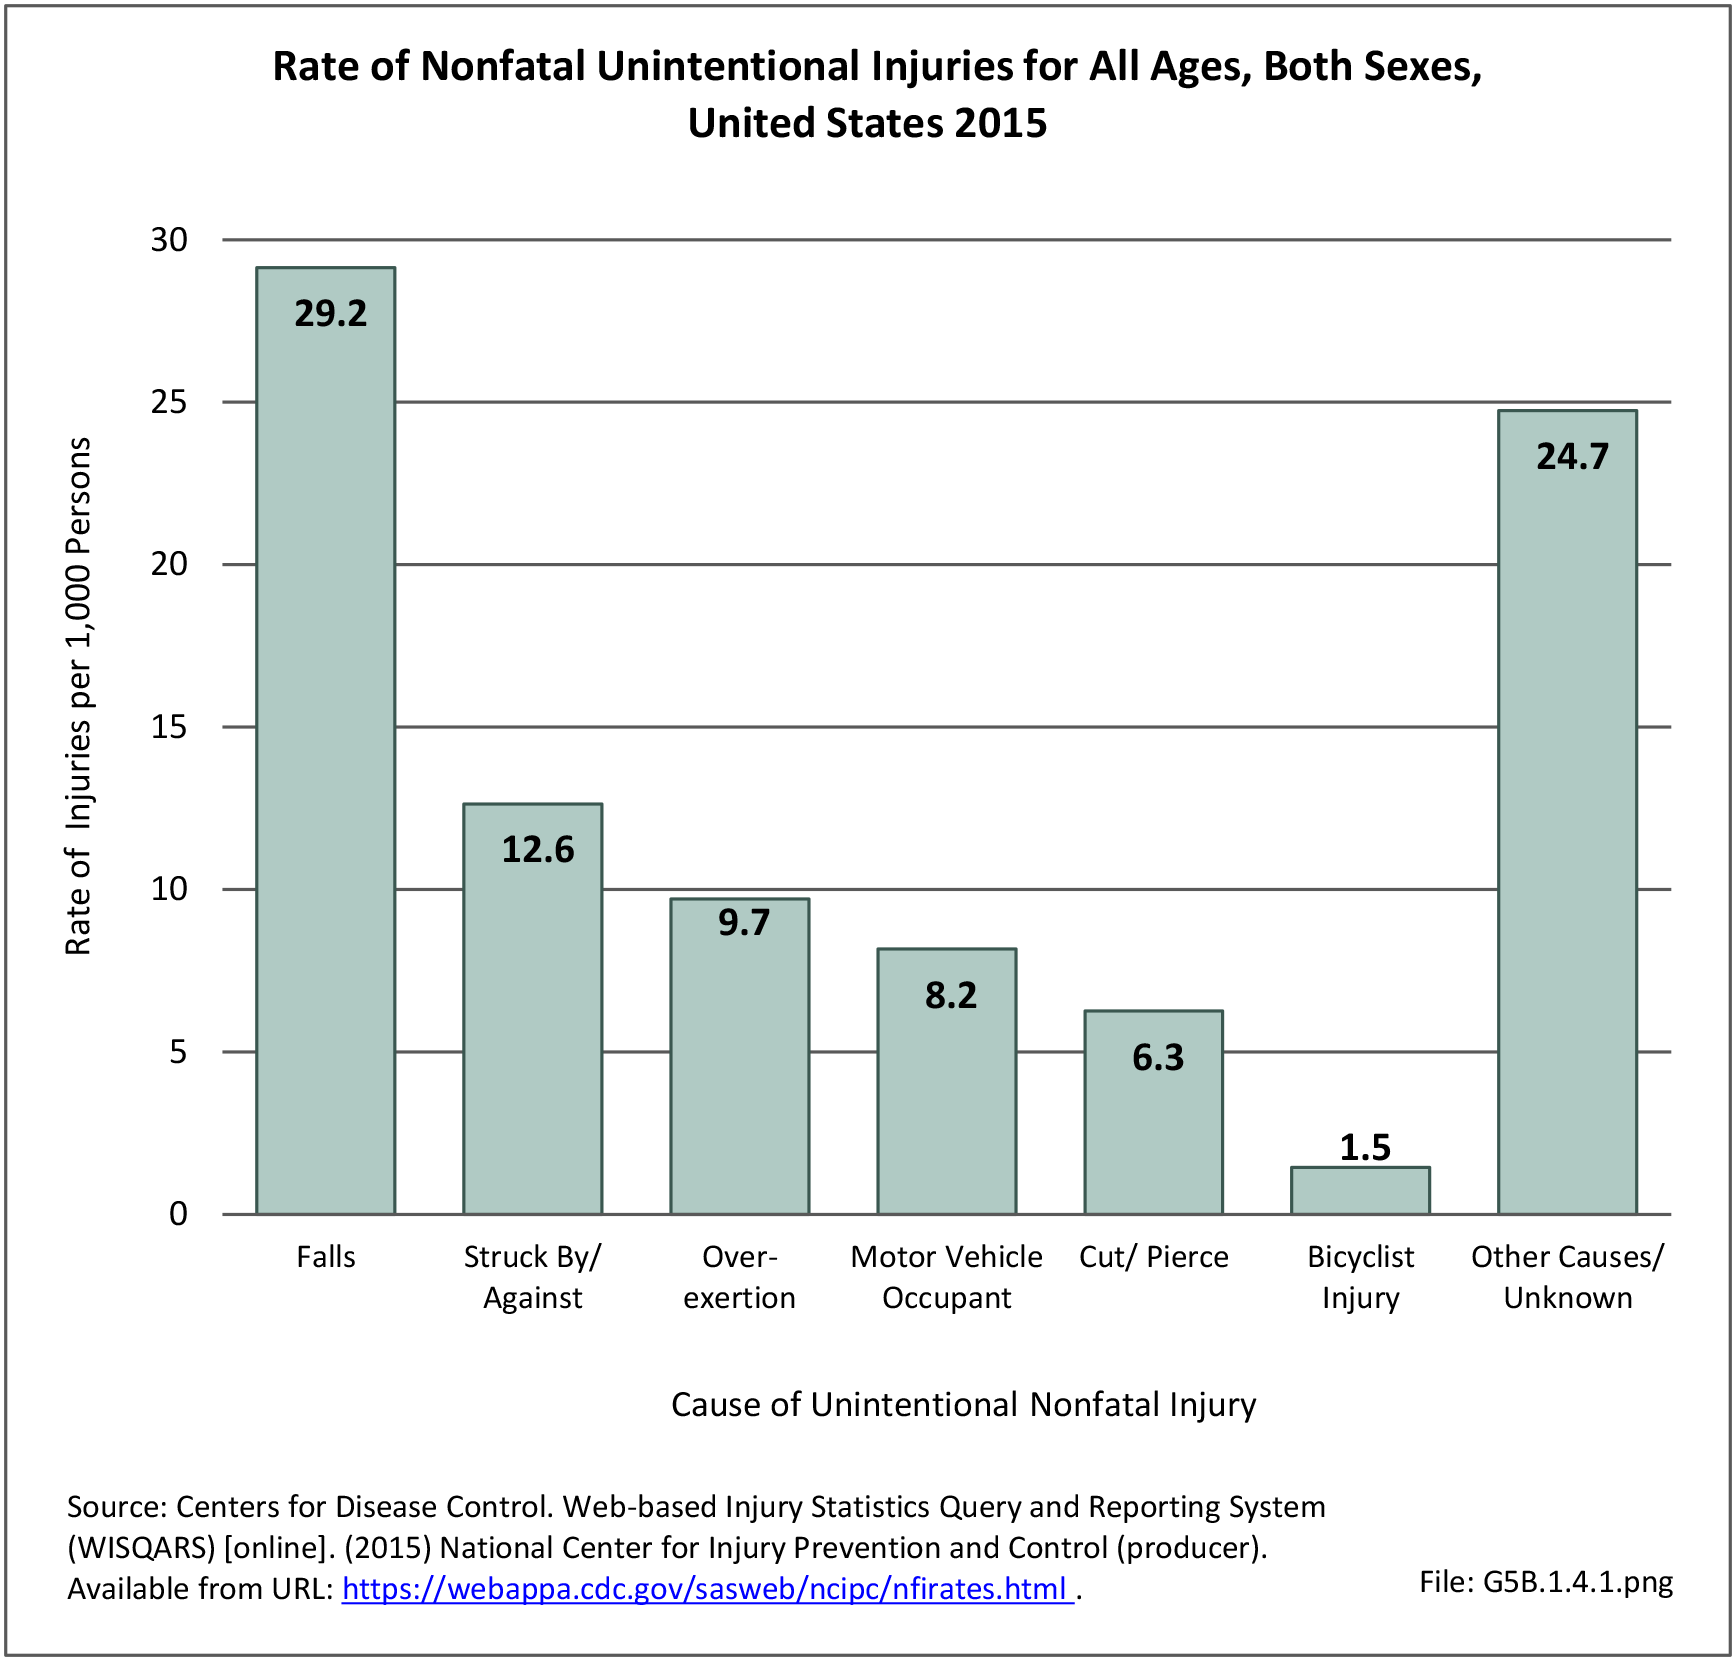
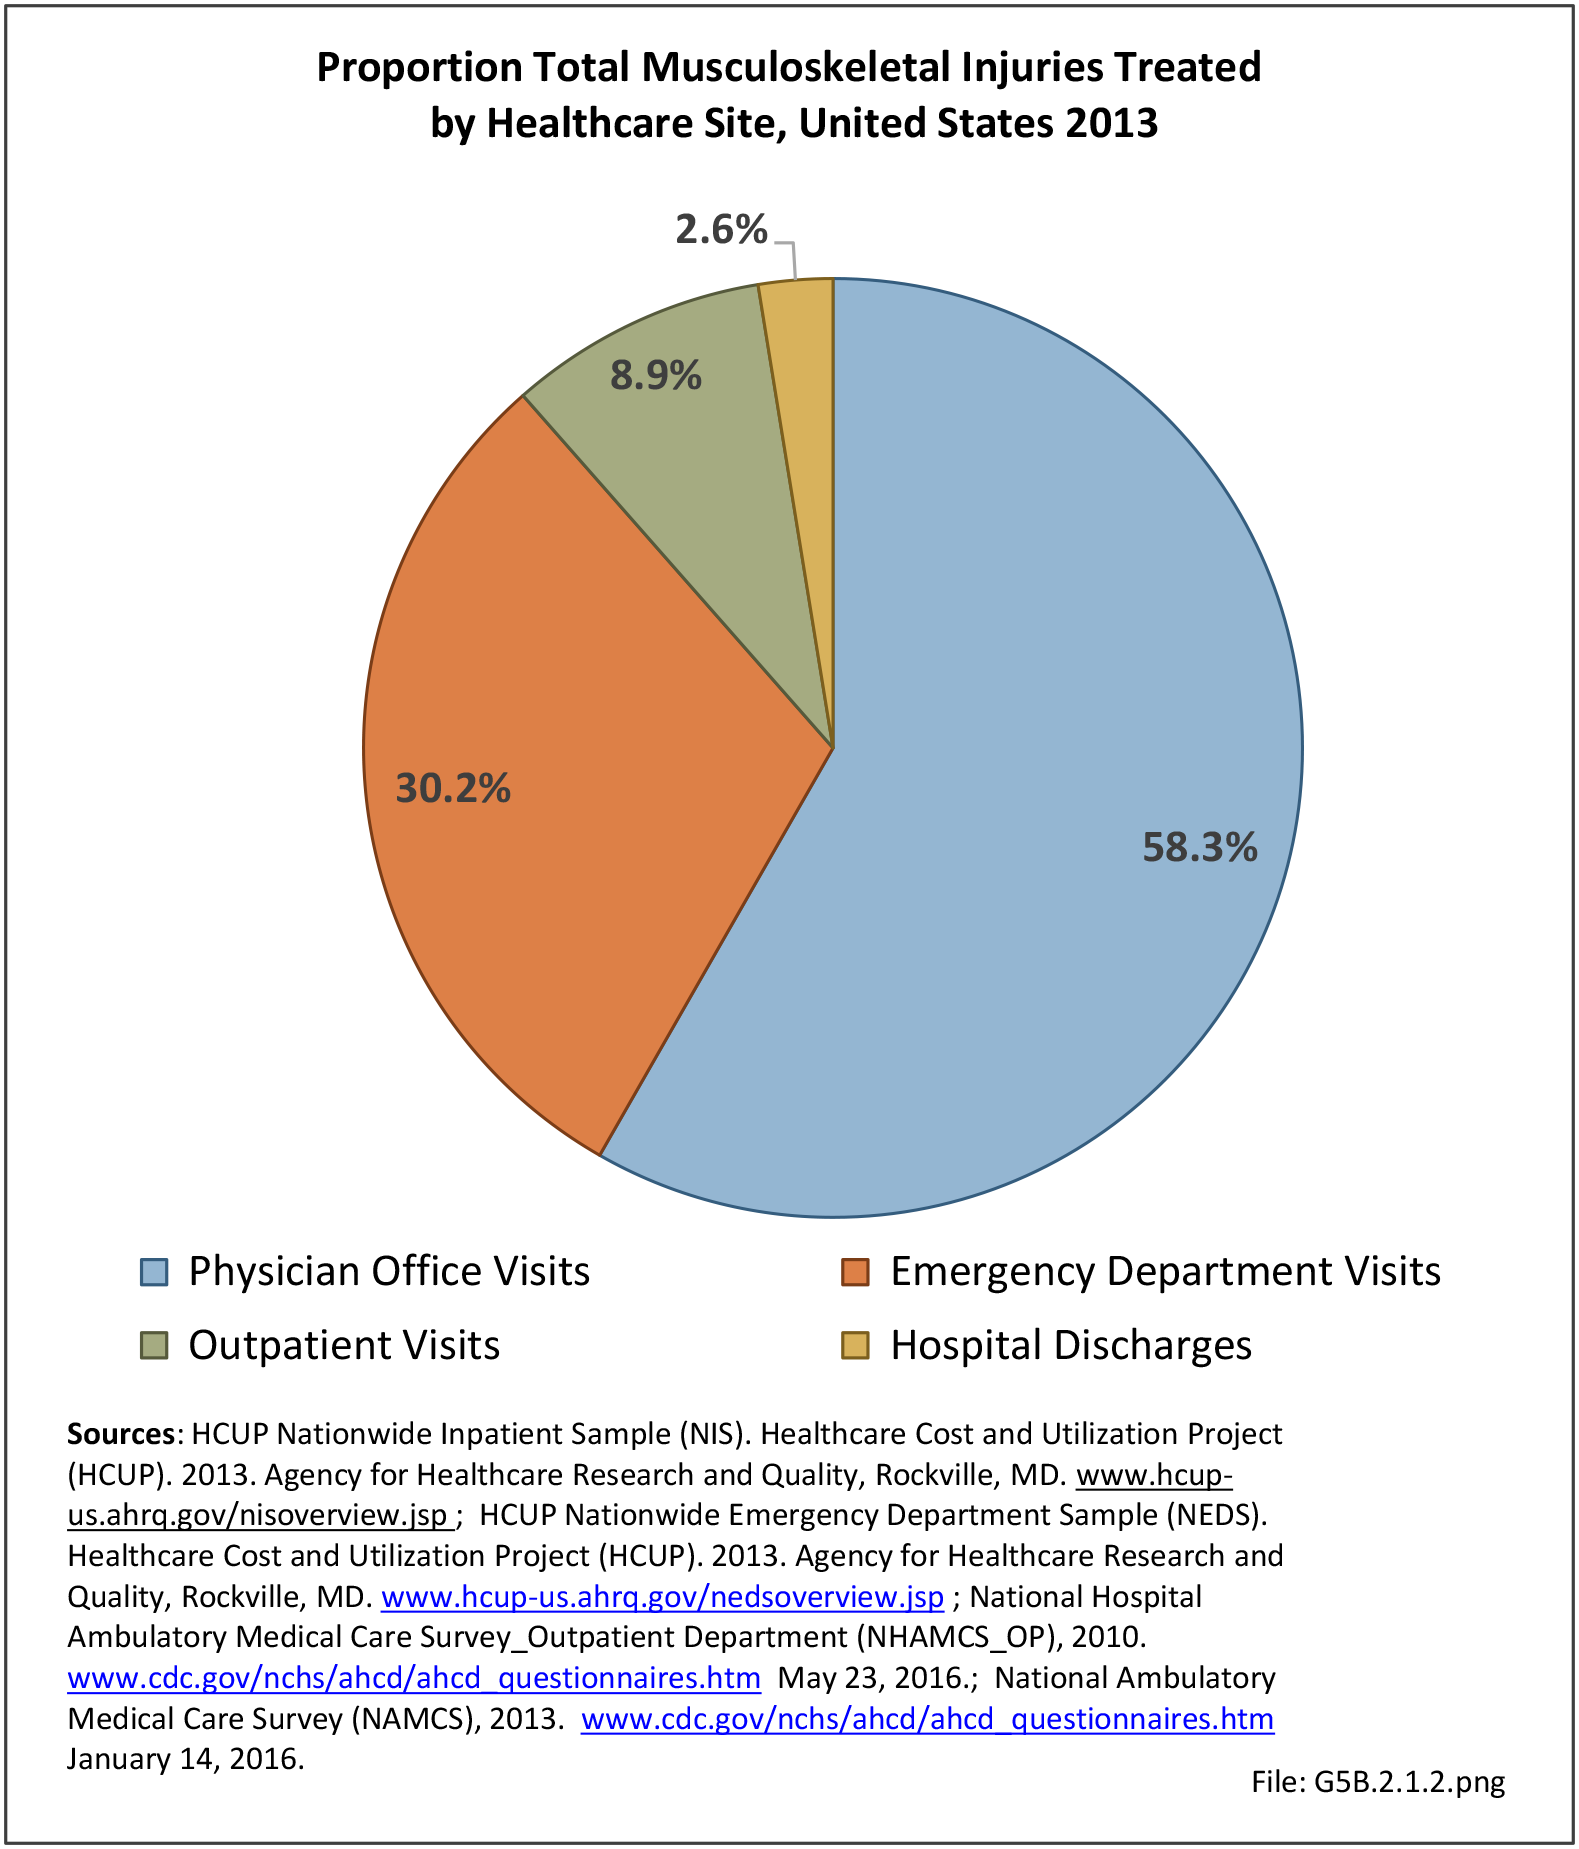
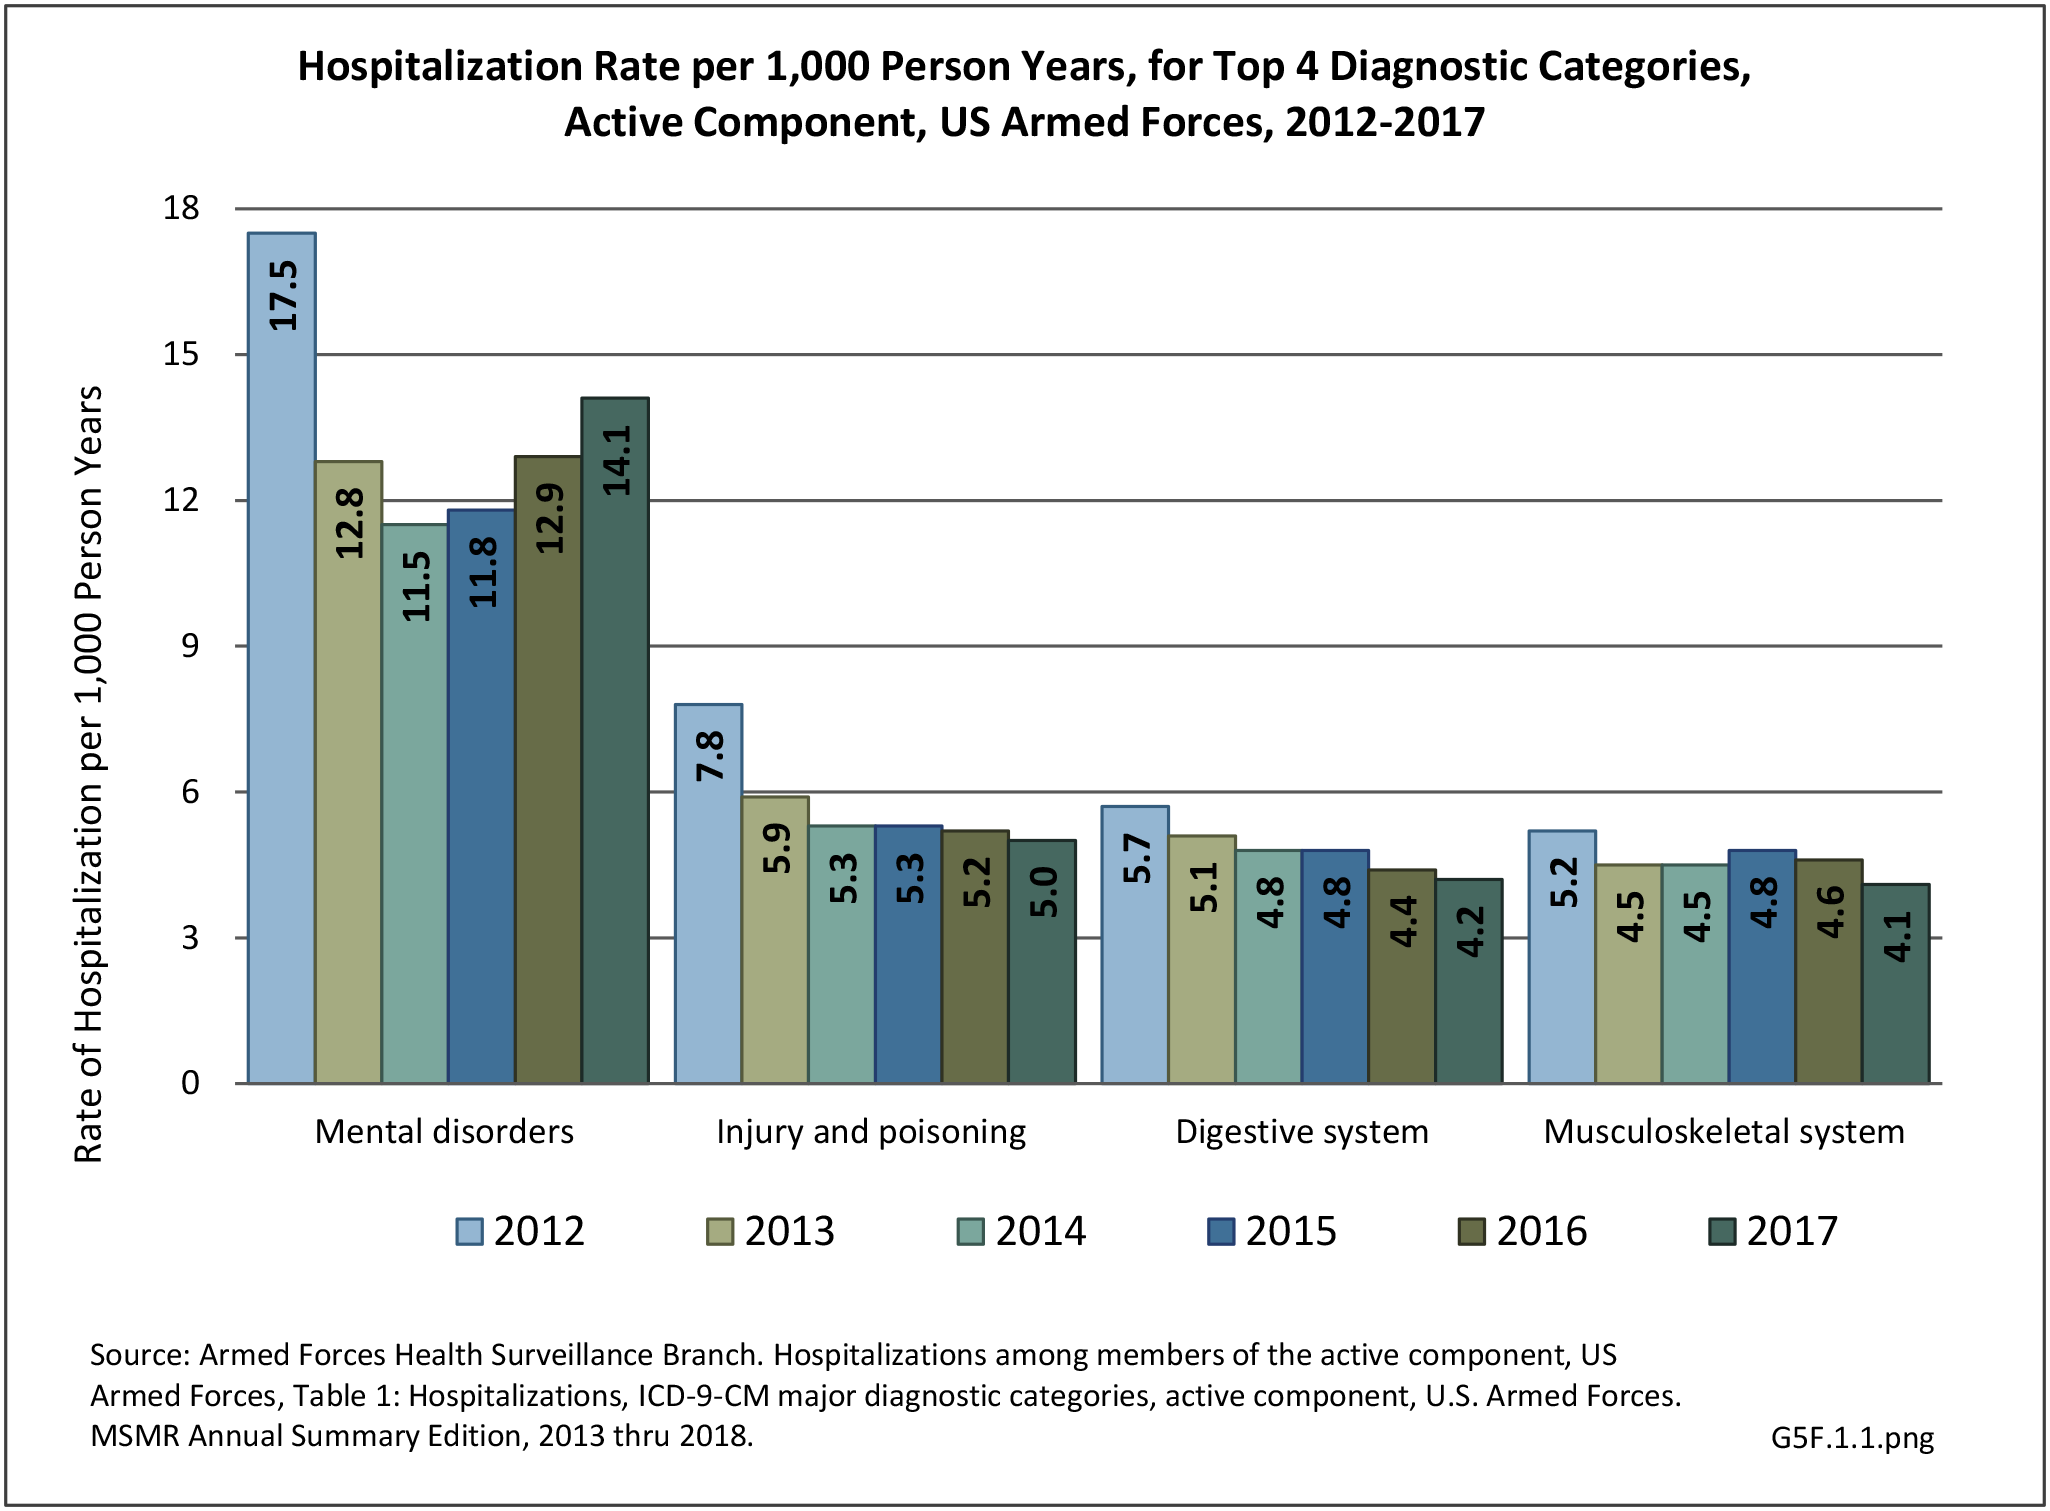
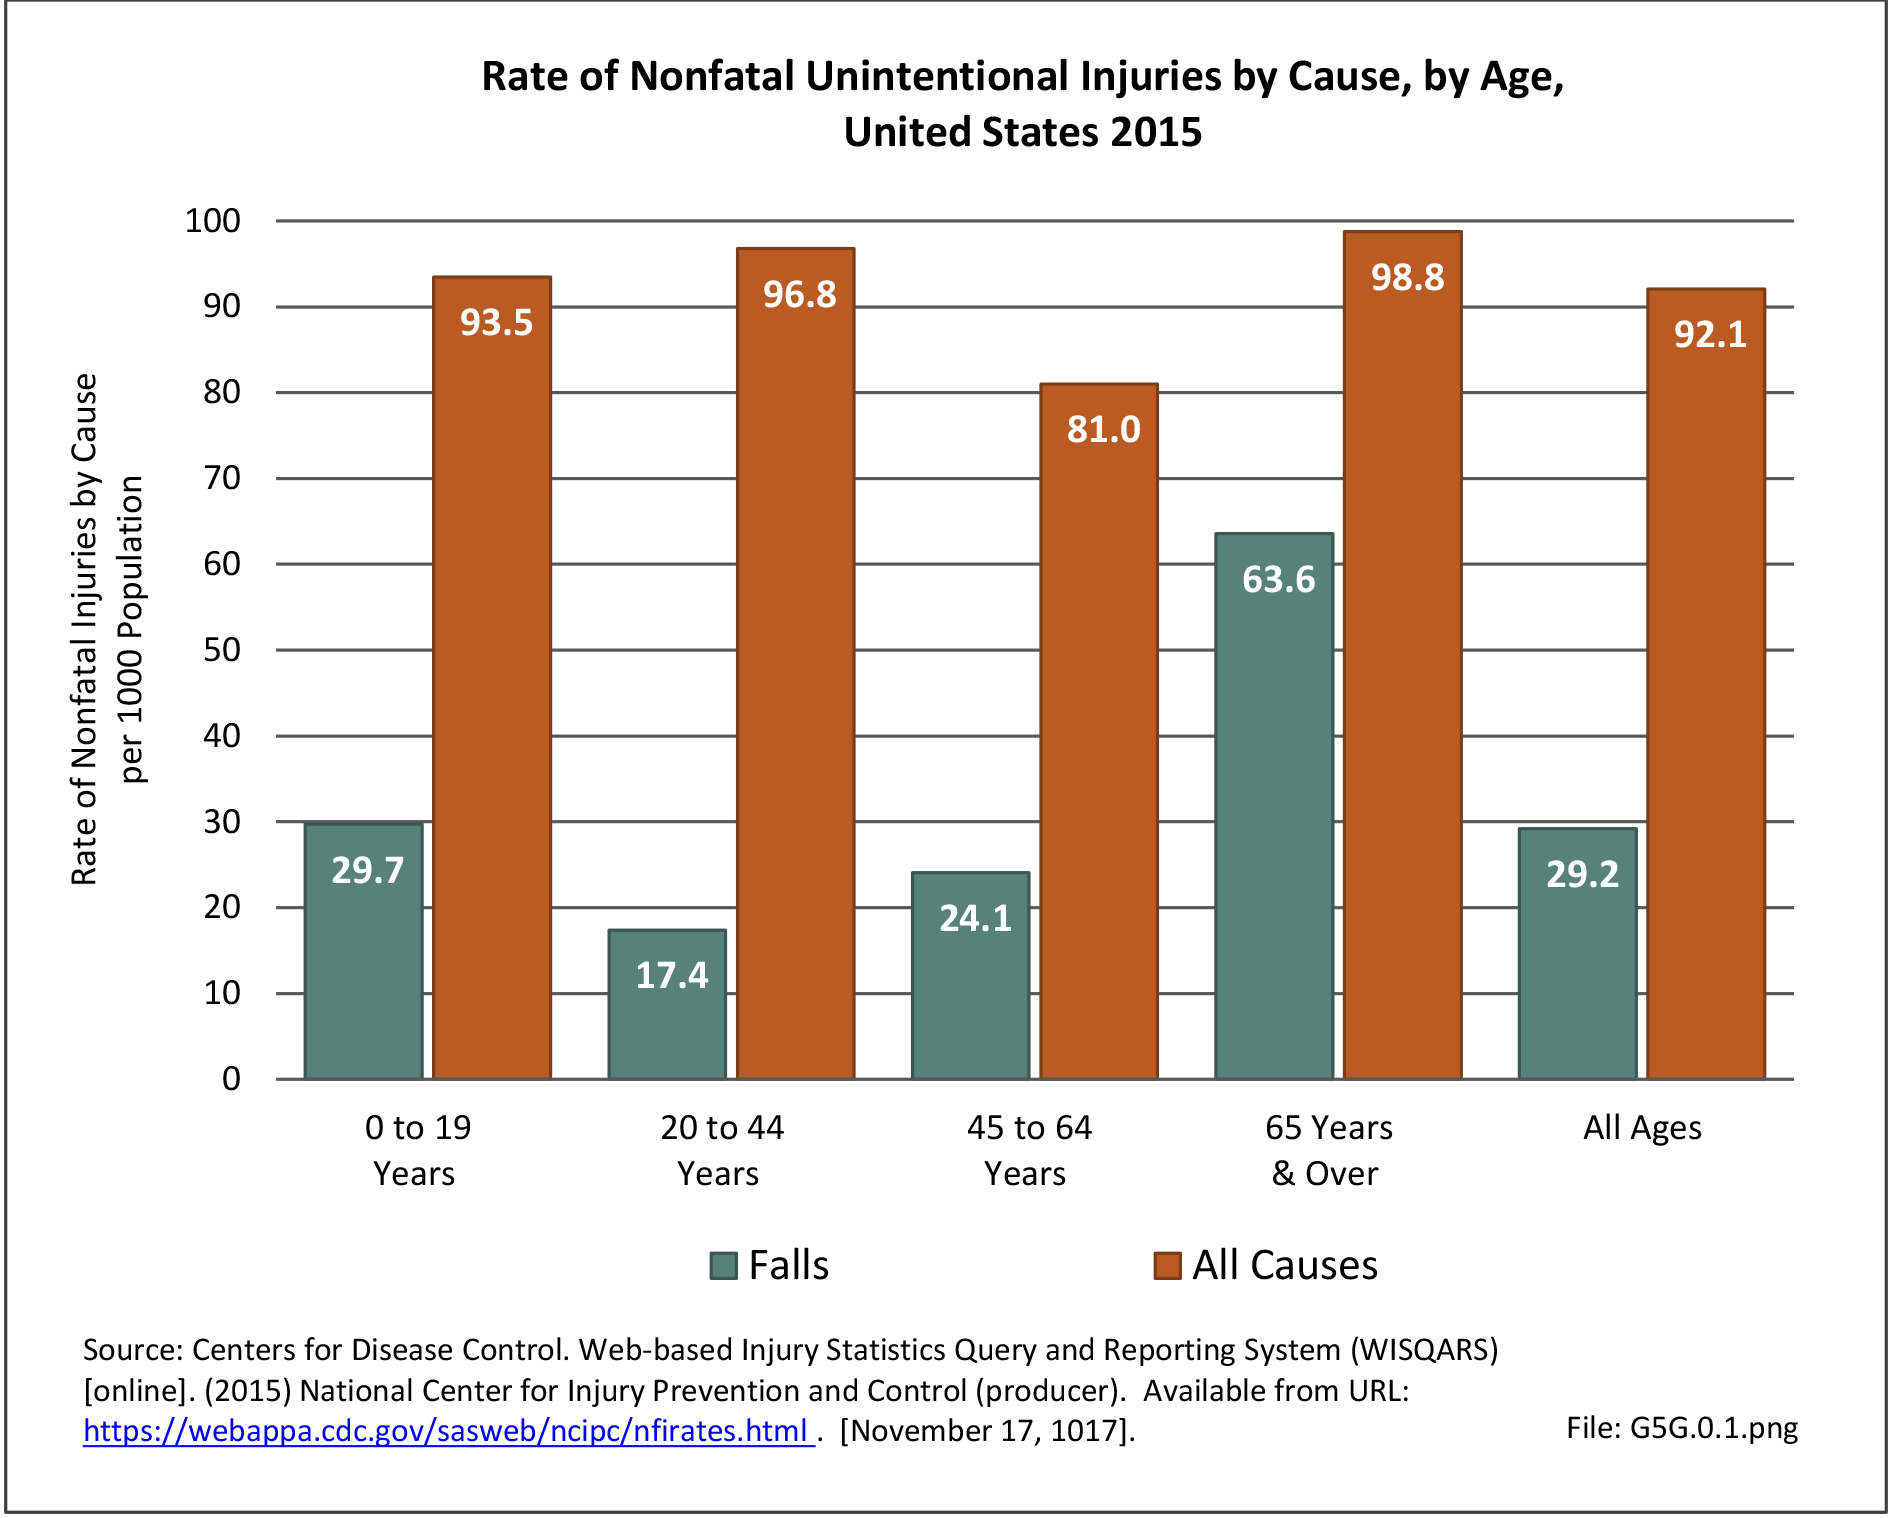
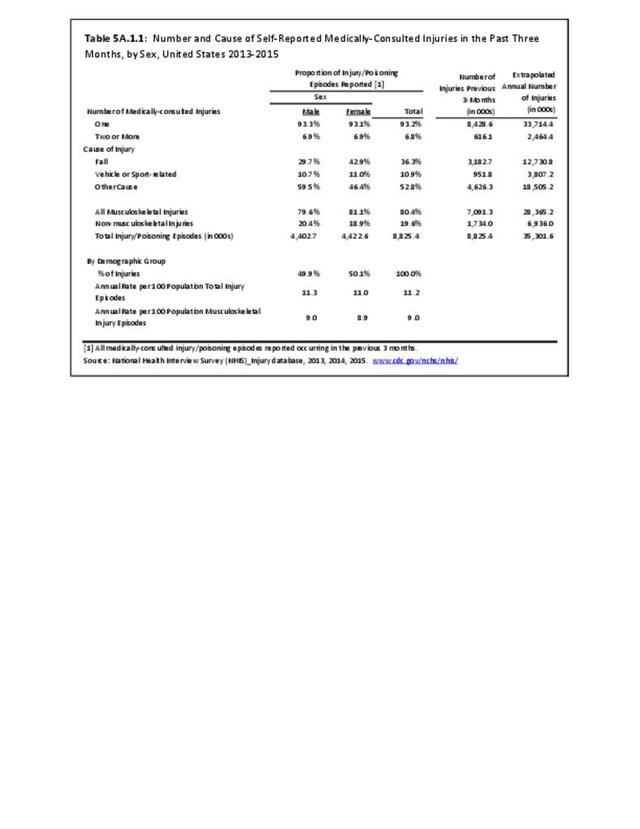
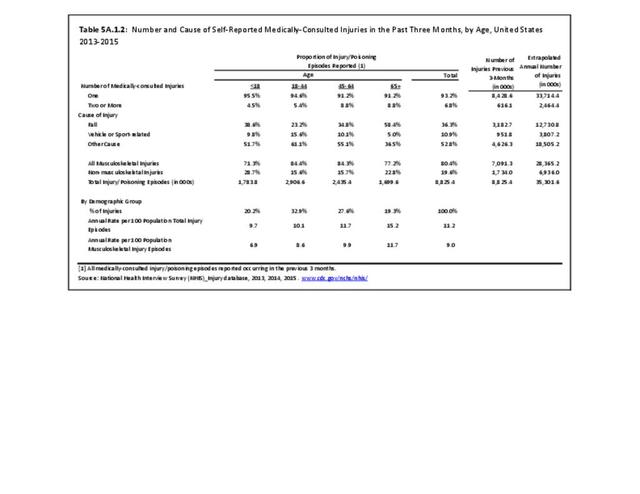
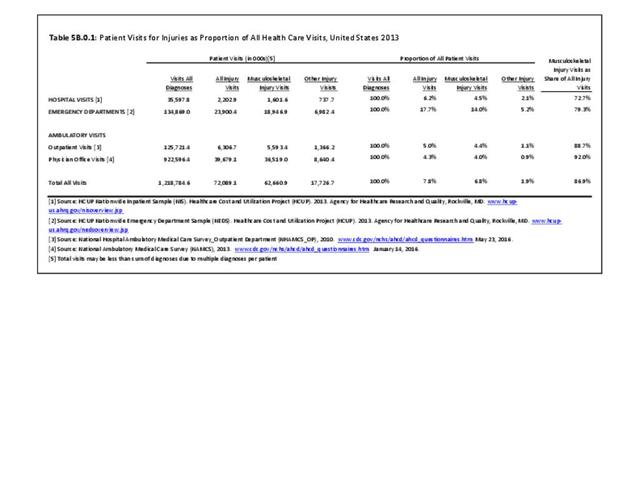
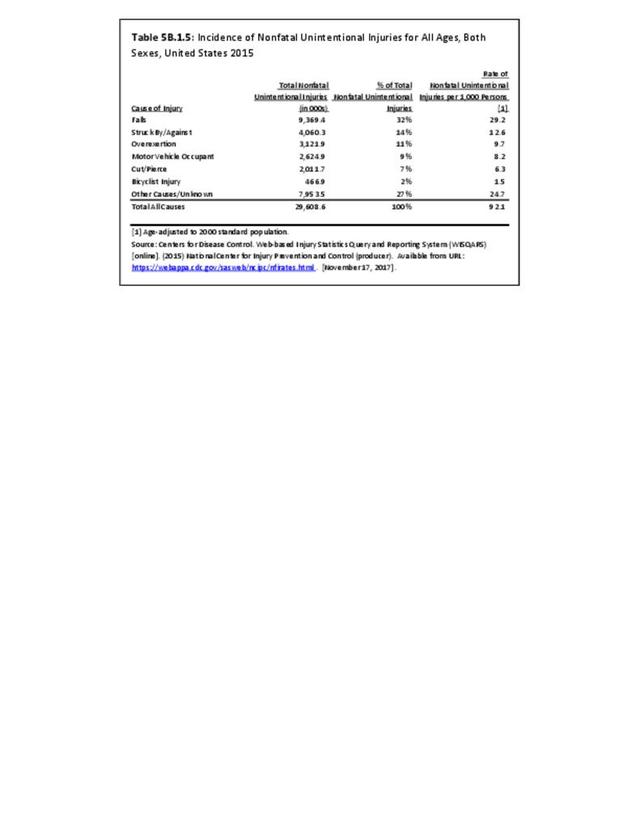
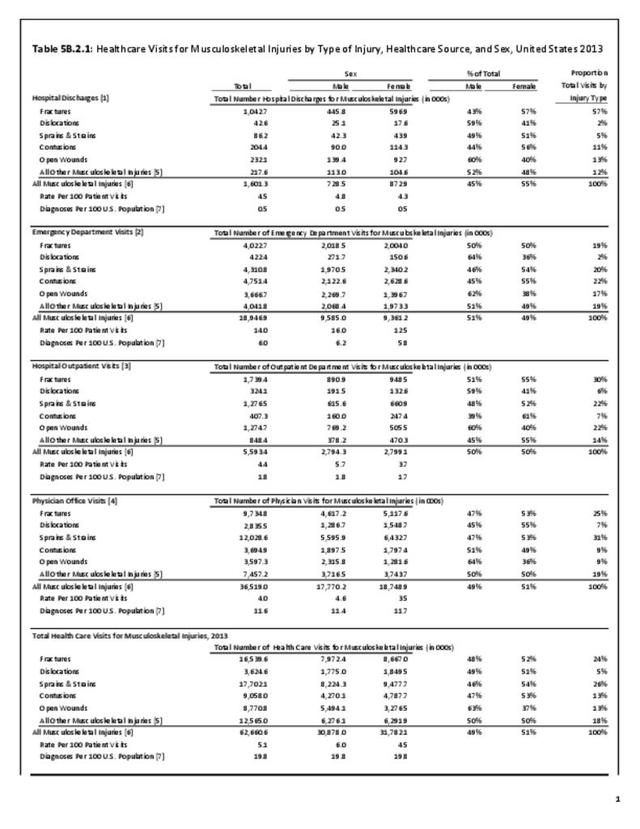
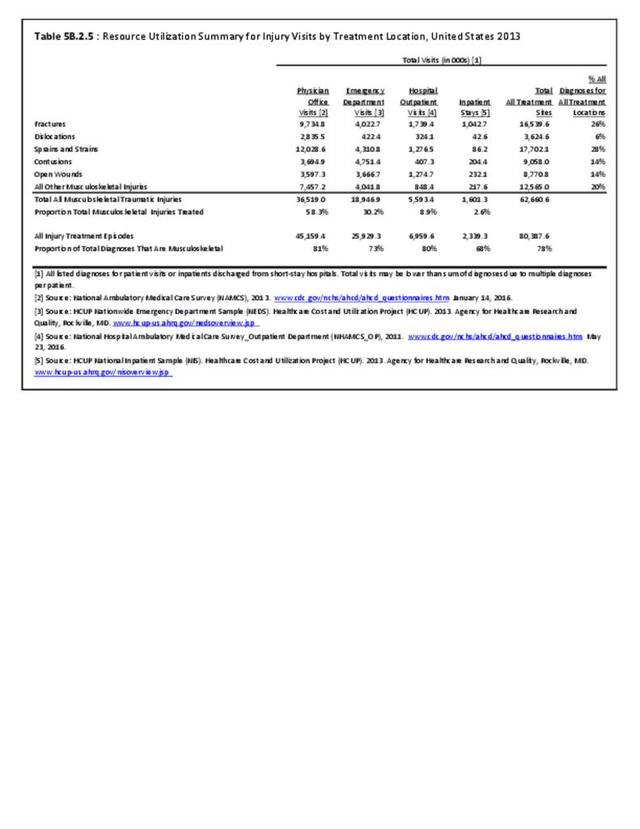
On average 2013-2015, 8.83 million persons reported seeking medical care for an injury during the prior three months, a number that extrapolates to 35.3 million per year (Reference Table 5A.1.1 PDF CSV), a number slightly higher than reported by the Centers for Disease Control (CDC) for nonfatal unintentional injuries. Even so, the number of self-reported annual injuries is much lower than the number of healthcare visits to physicians, emergency departments, outpatient clinics, and hospitals reported during the course of a year (Reference Table 5B.2.1 PDF CSV), suggesting that self-reported injuries are under reported.
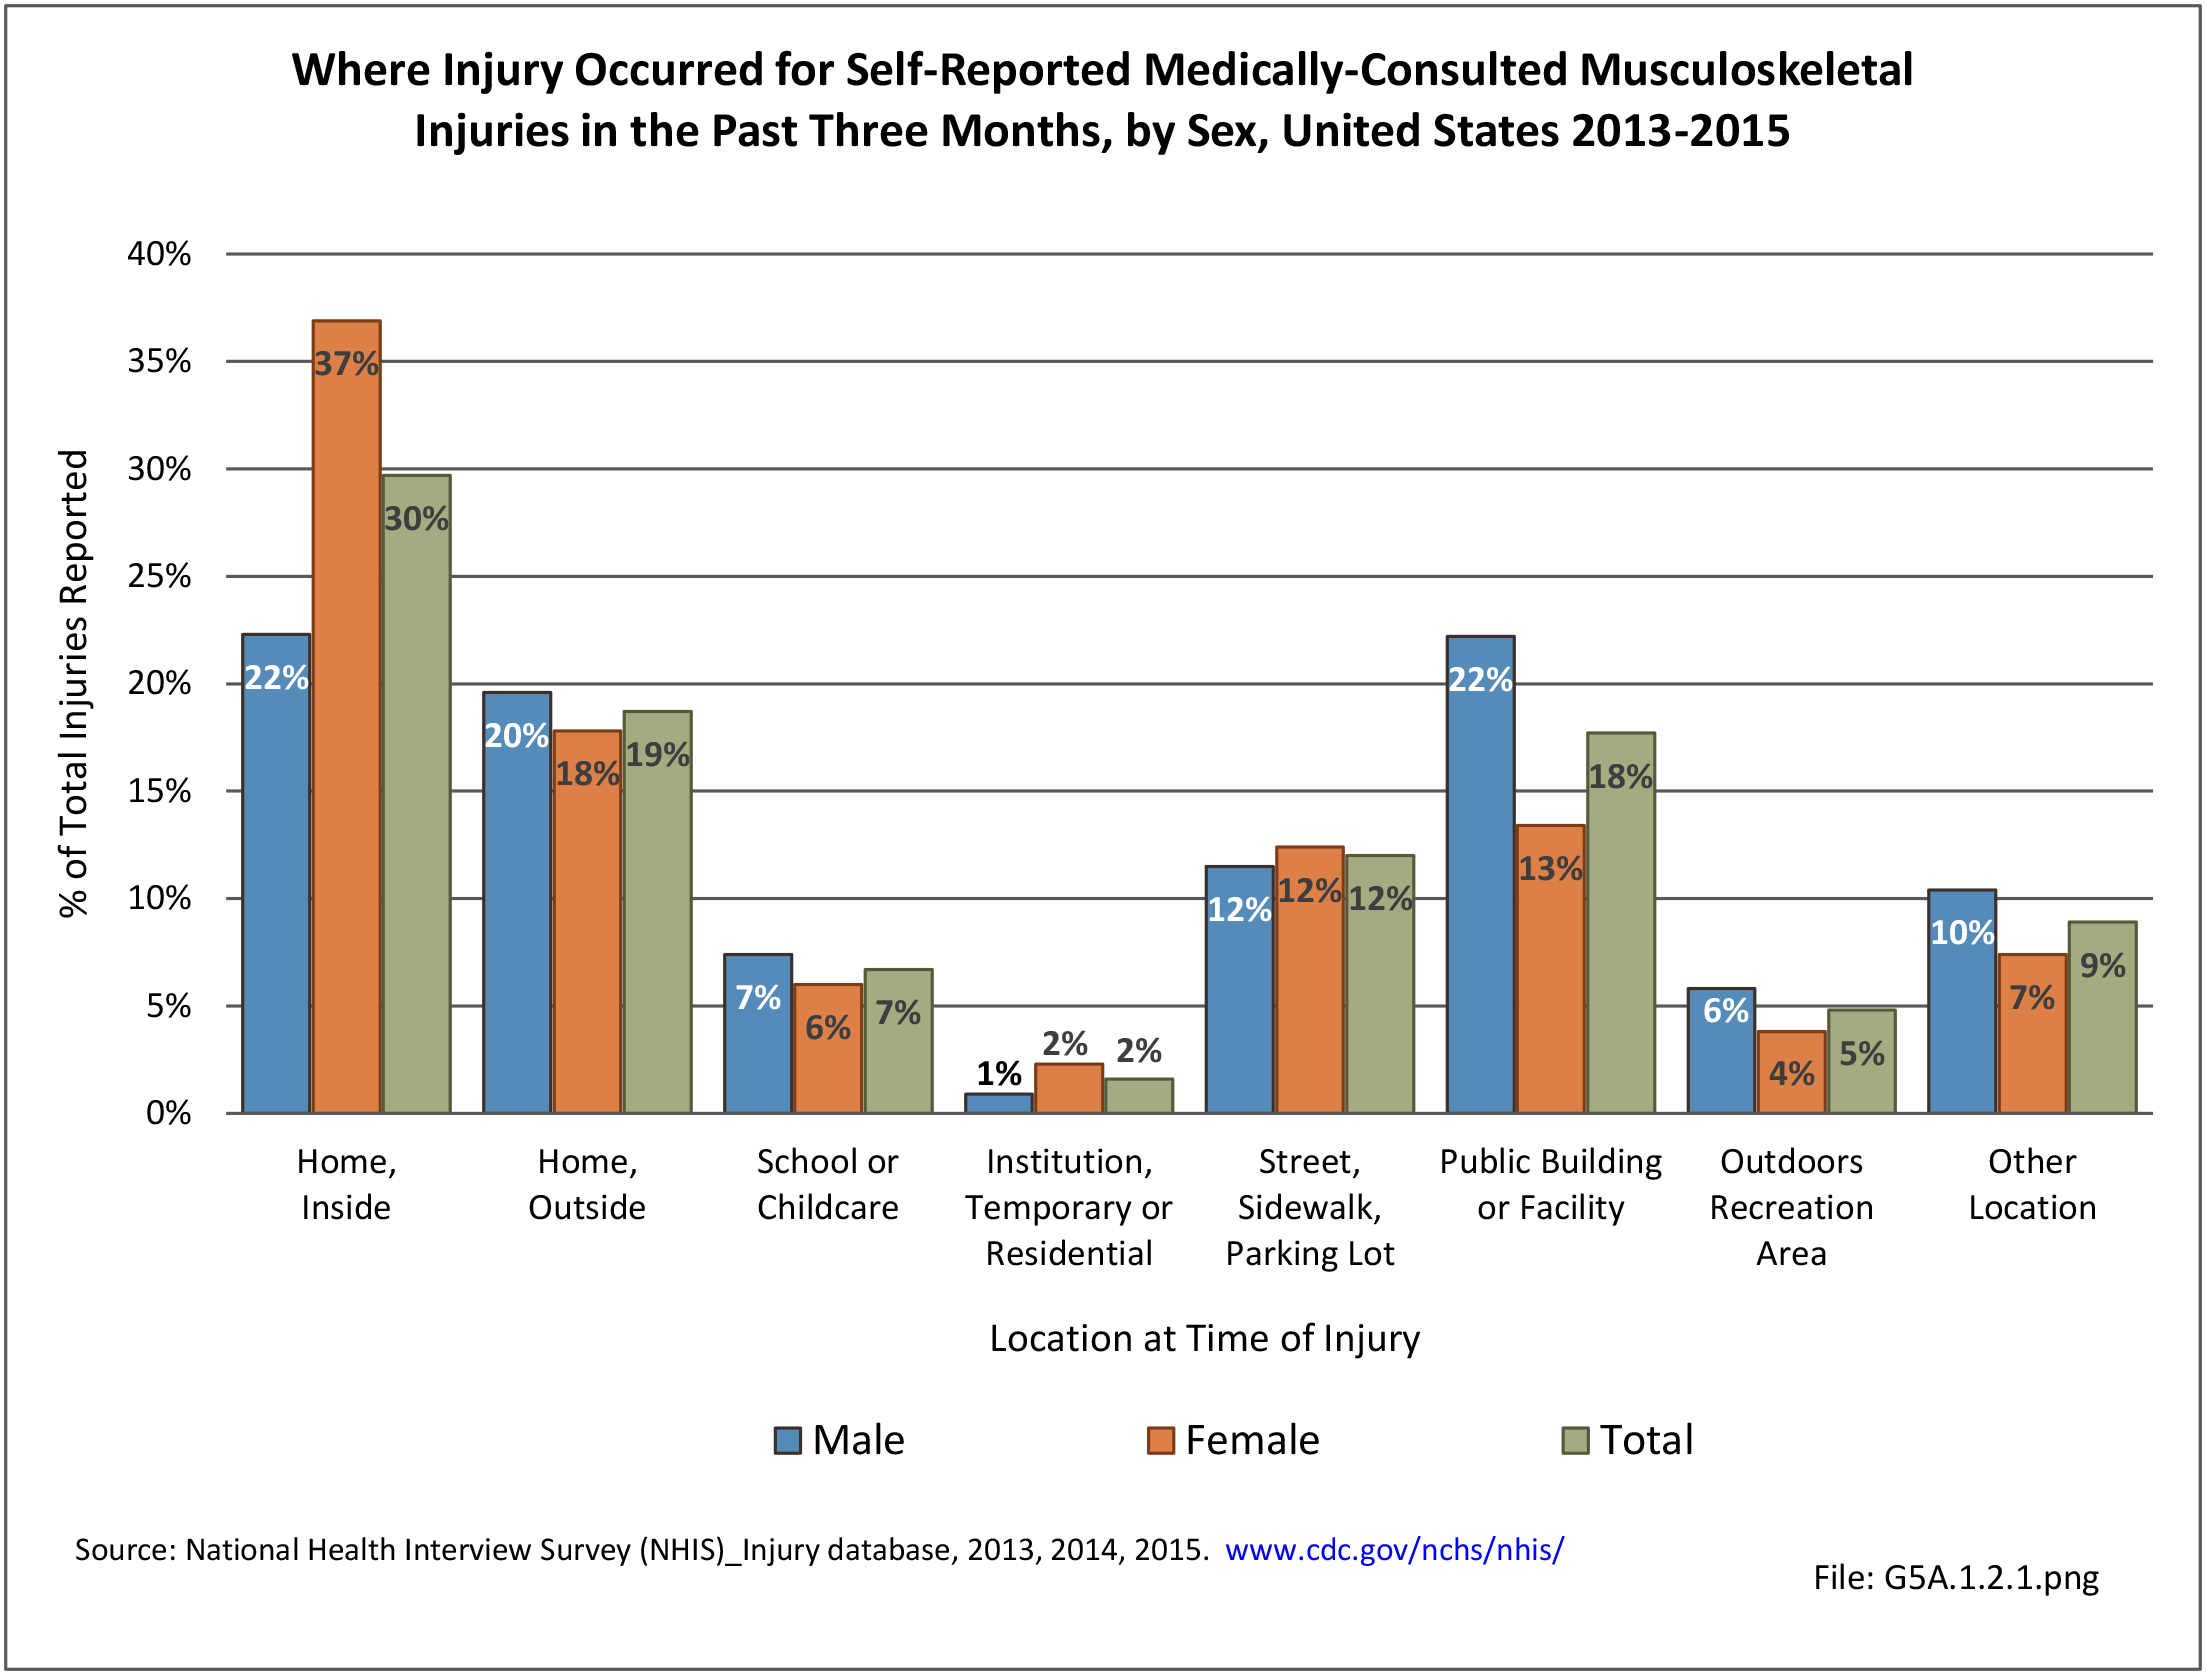
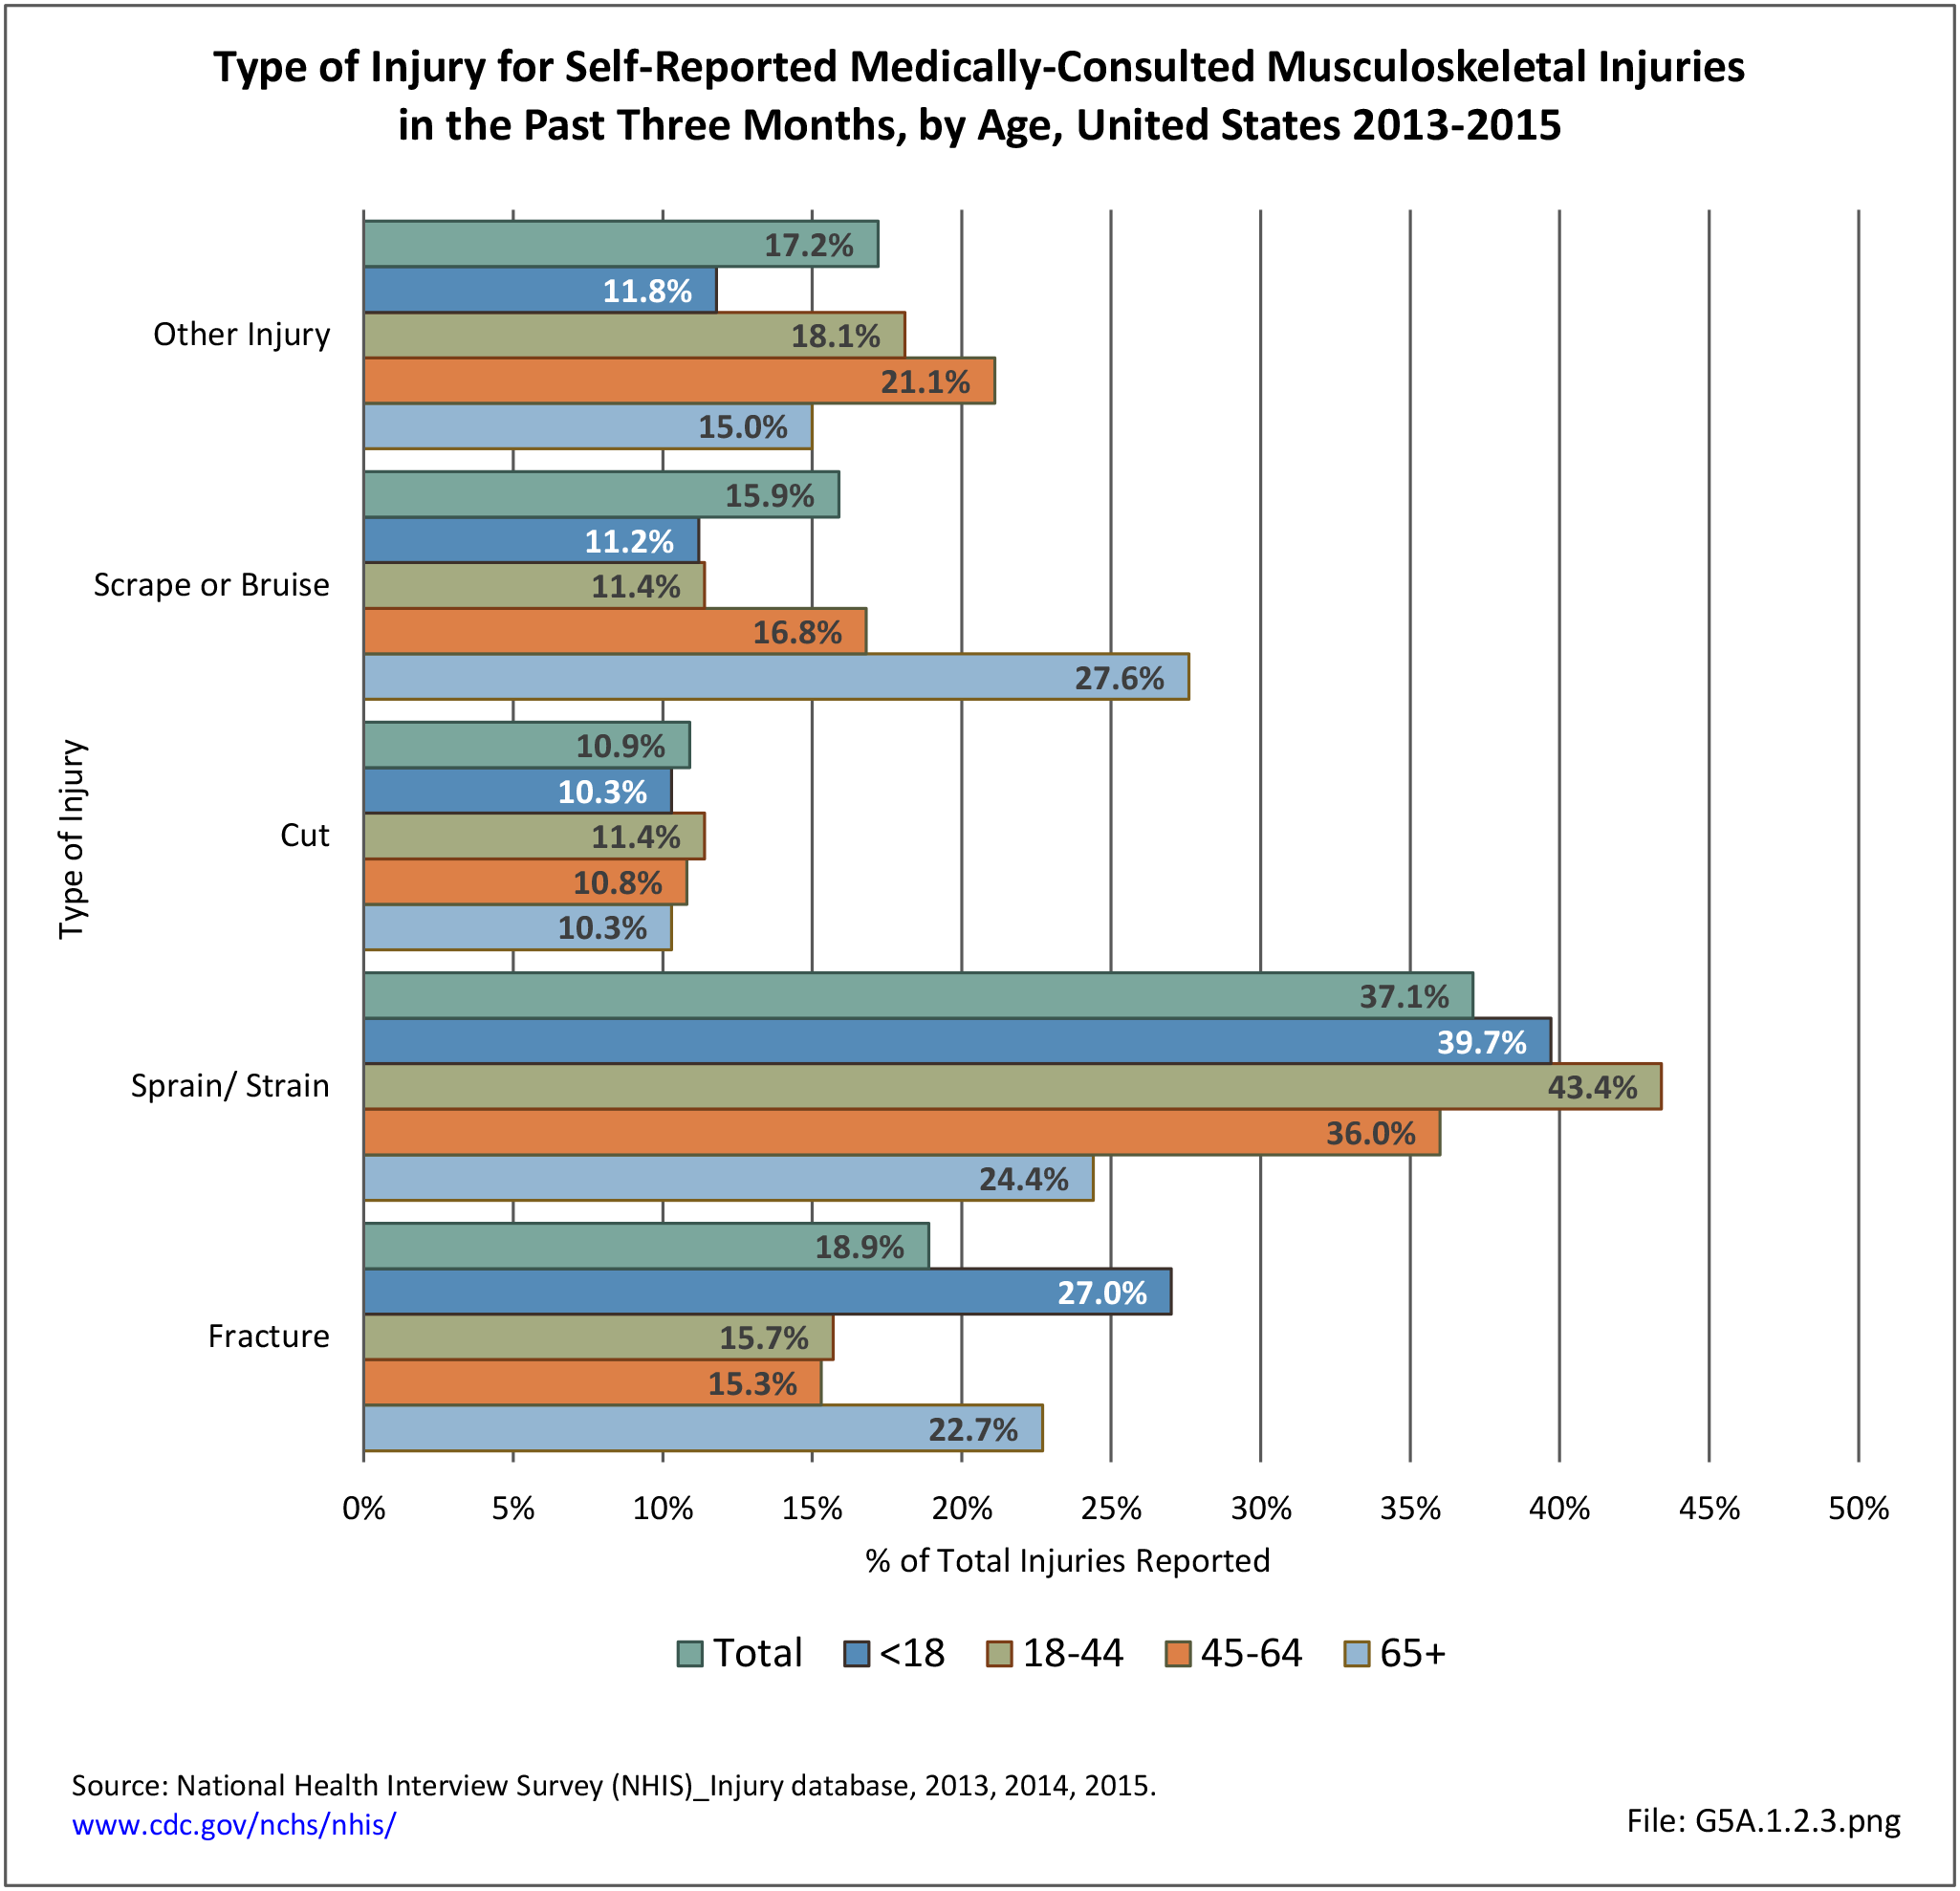
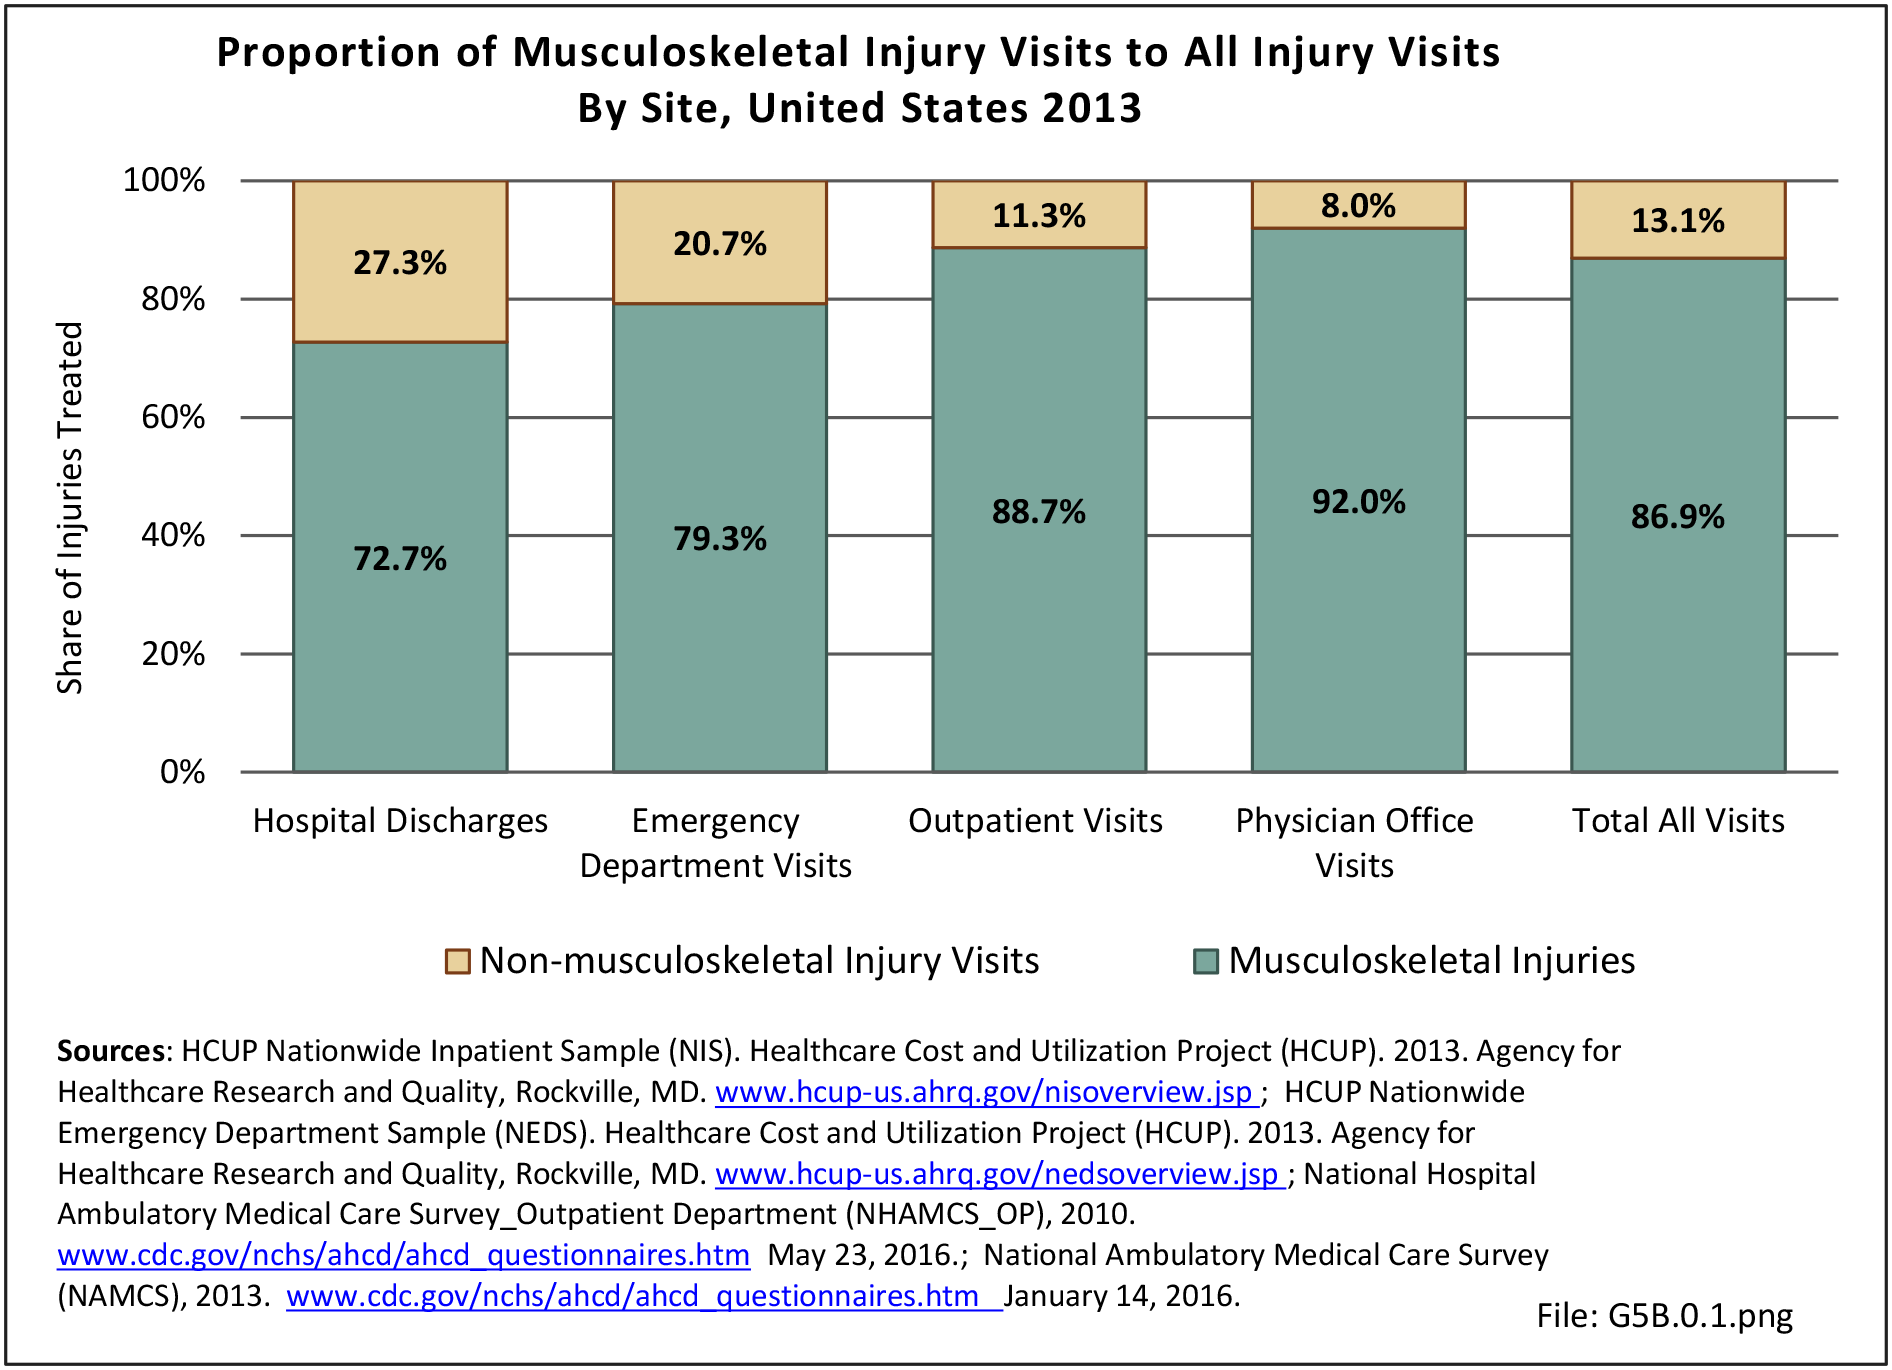
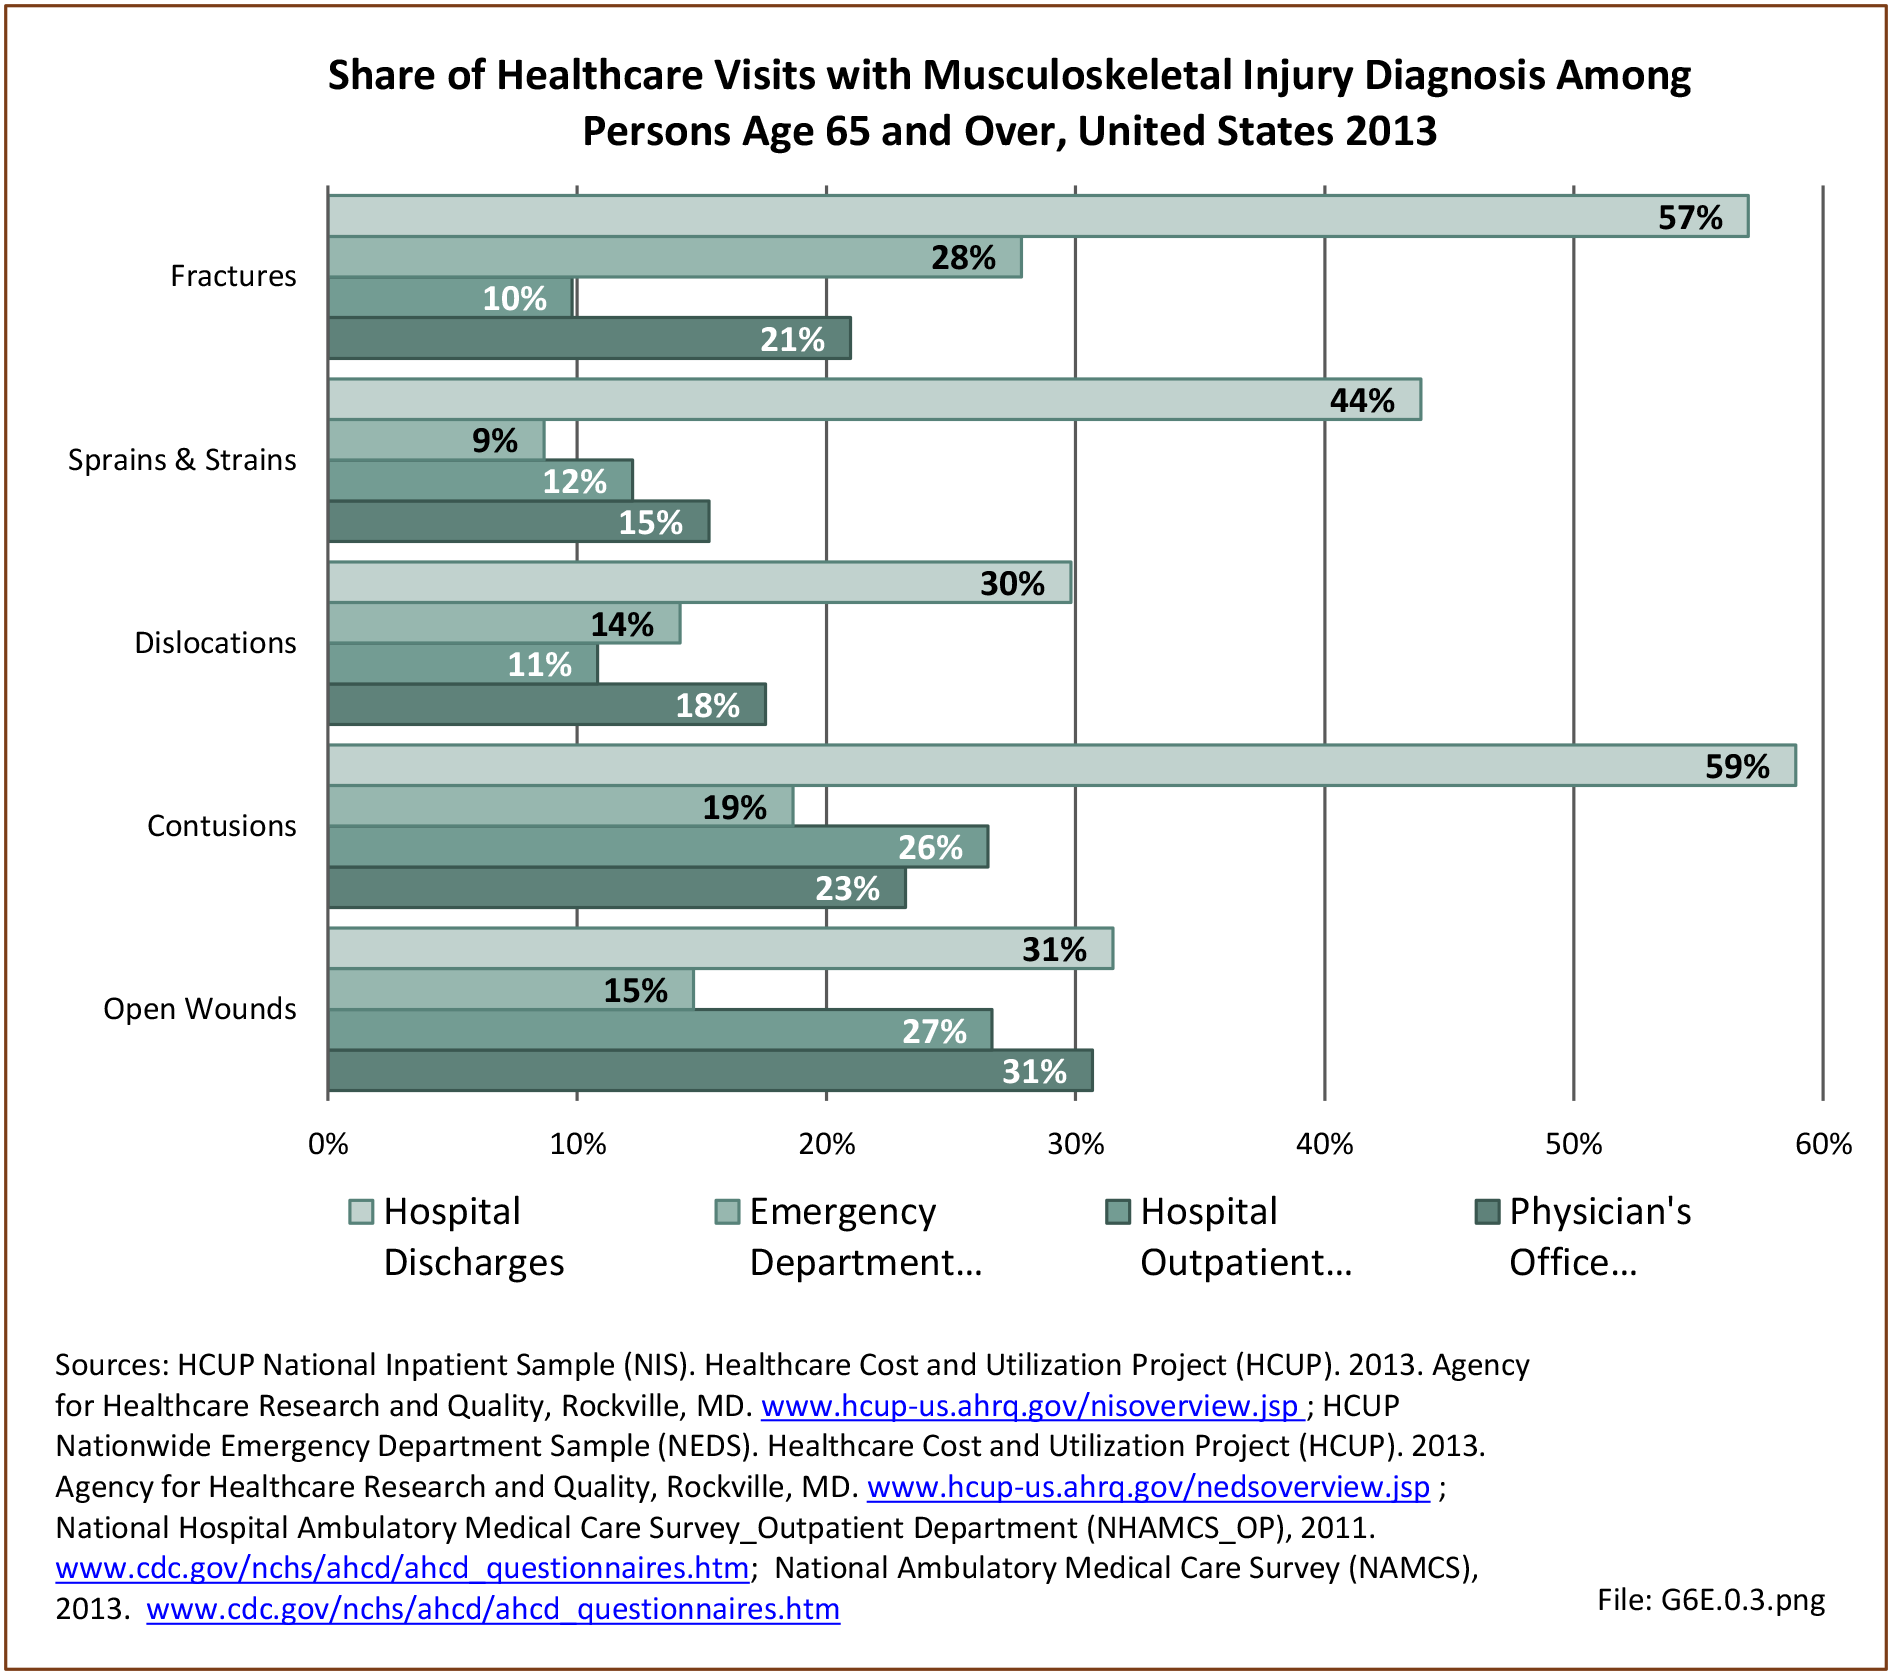
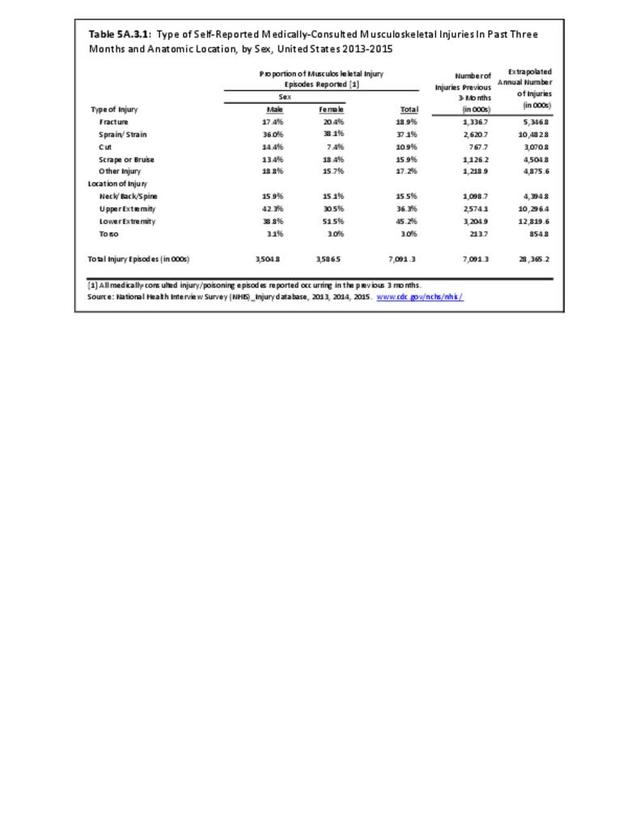
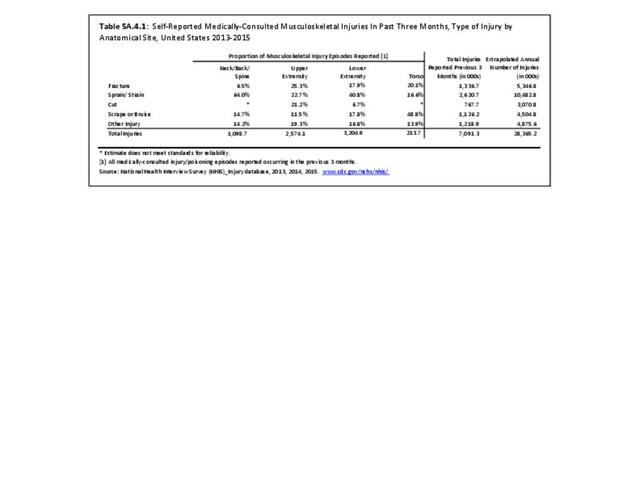
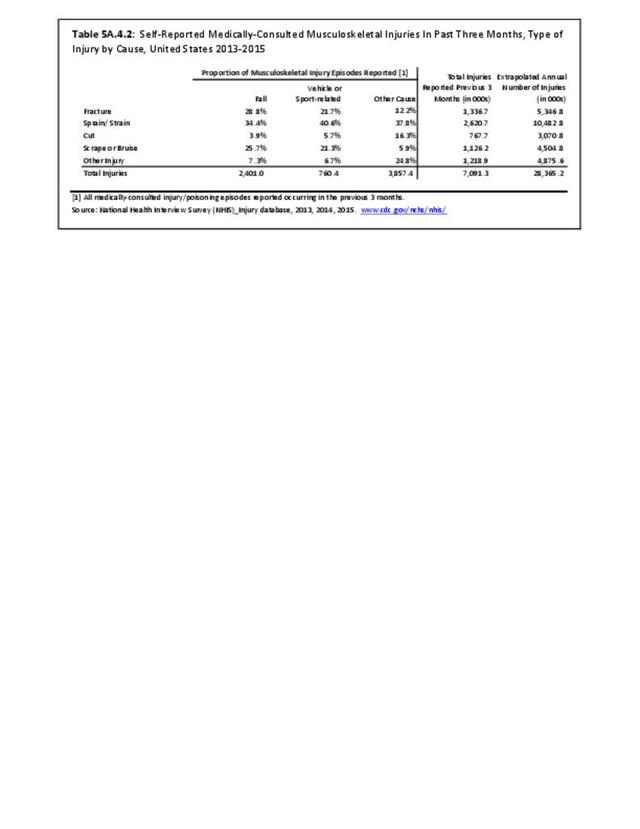
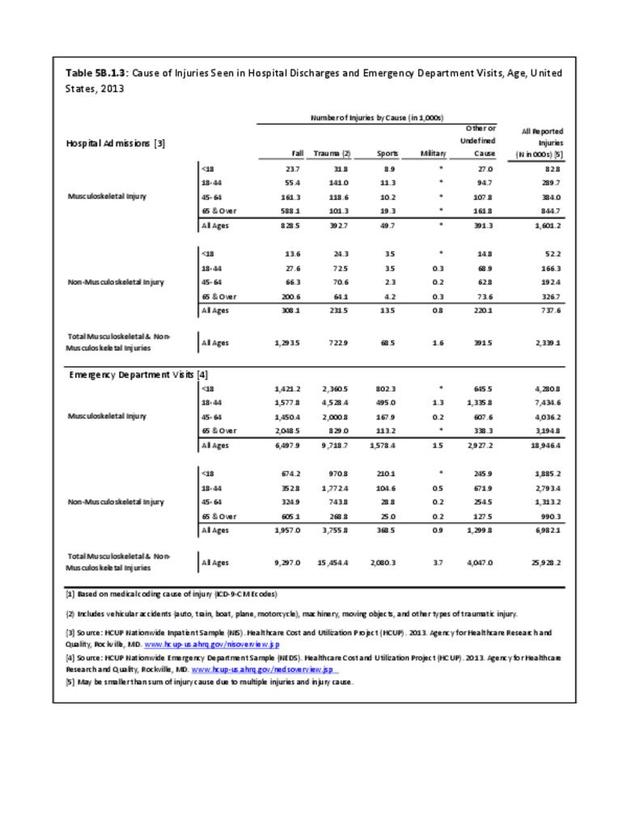
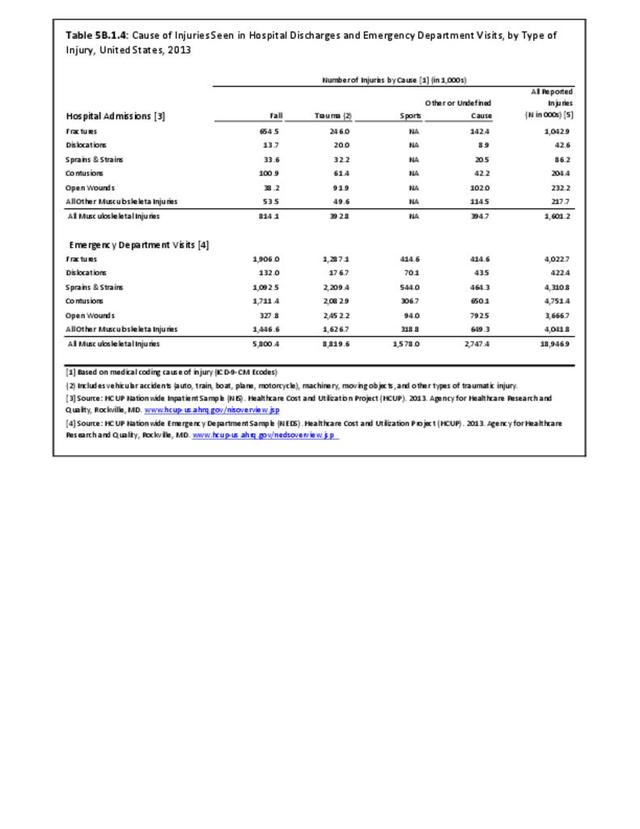
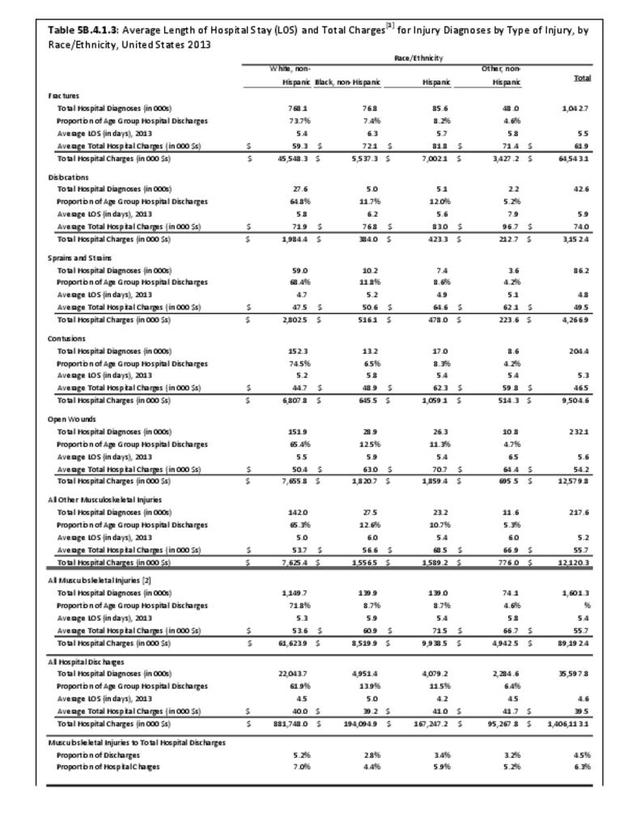
The proportion of self-reported total injuries that were musculoskeletal was similar to that reported by the national healthcare databases for injury-related healthcare visits, 80% and 87% respectively. (Reference Table 5A.1.1 PDF CSV; Table 5B.2.1 PDF CSV)
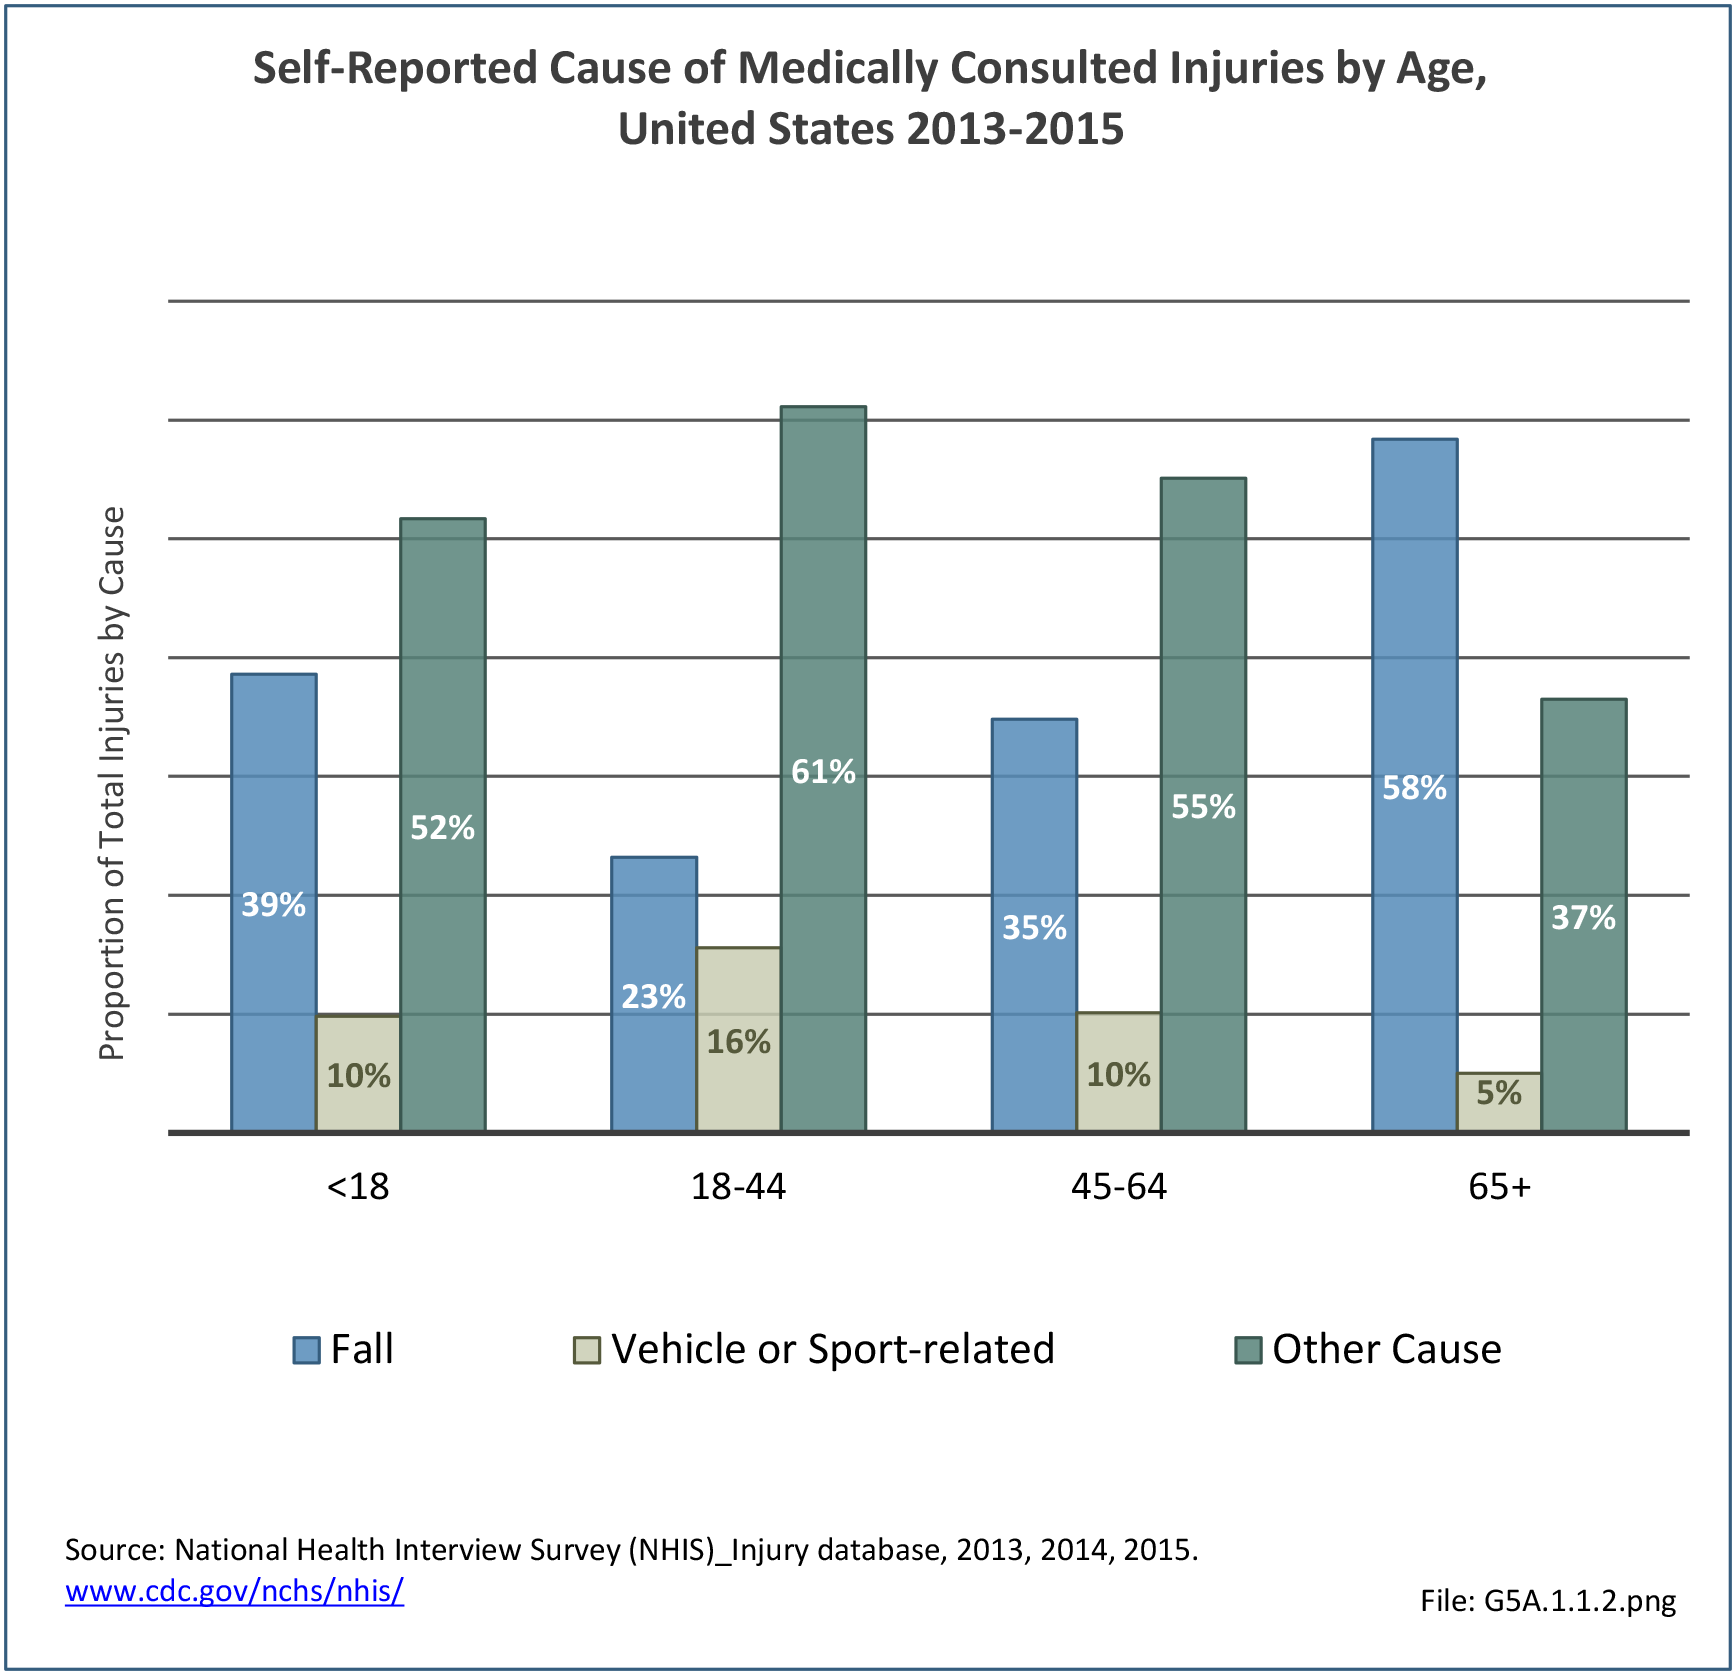
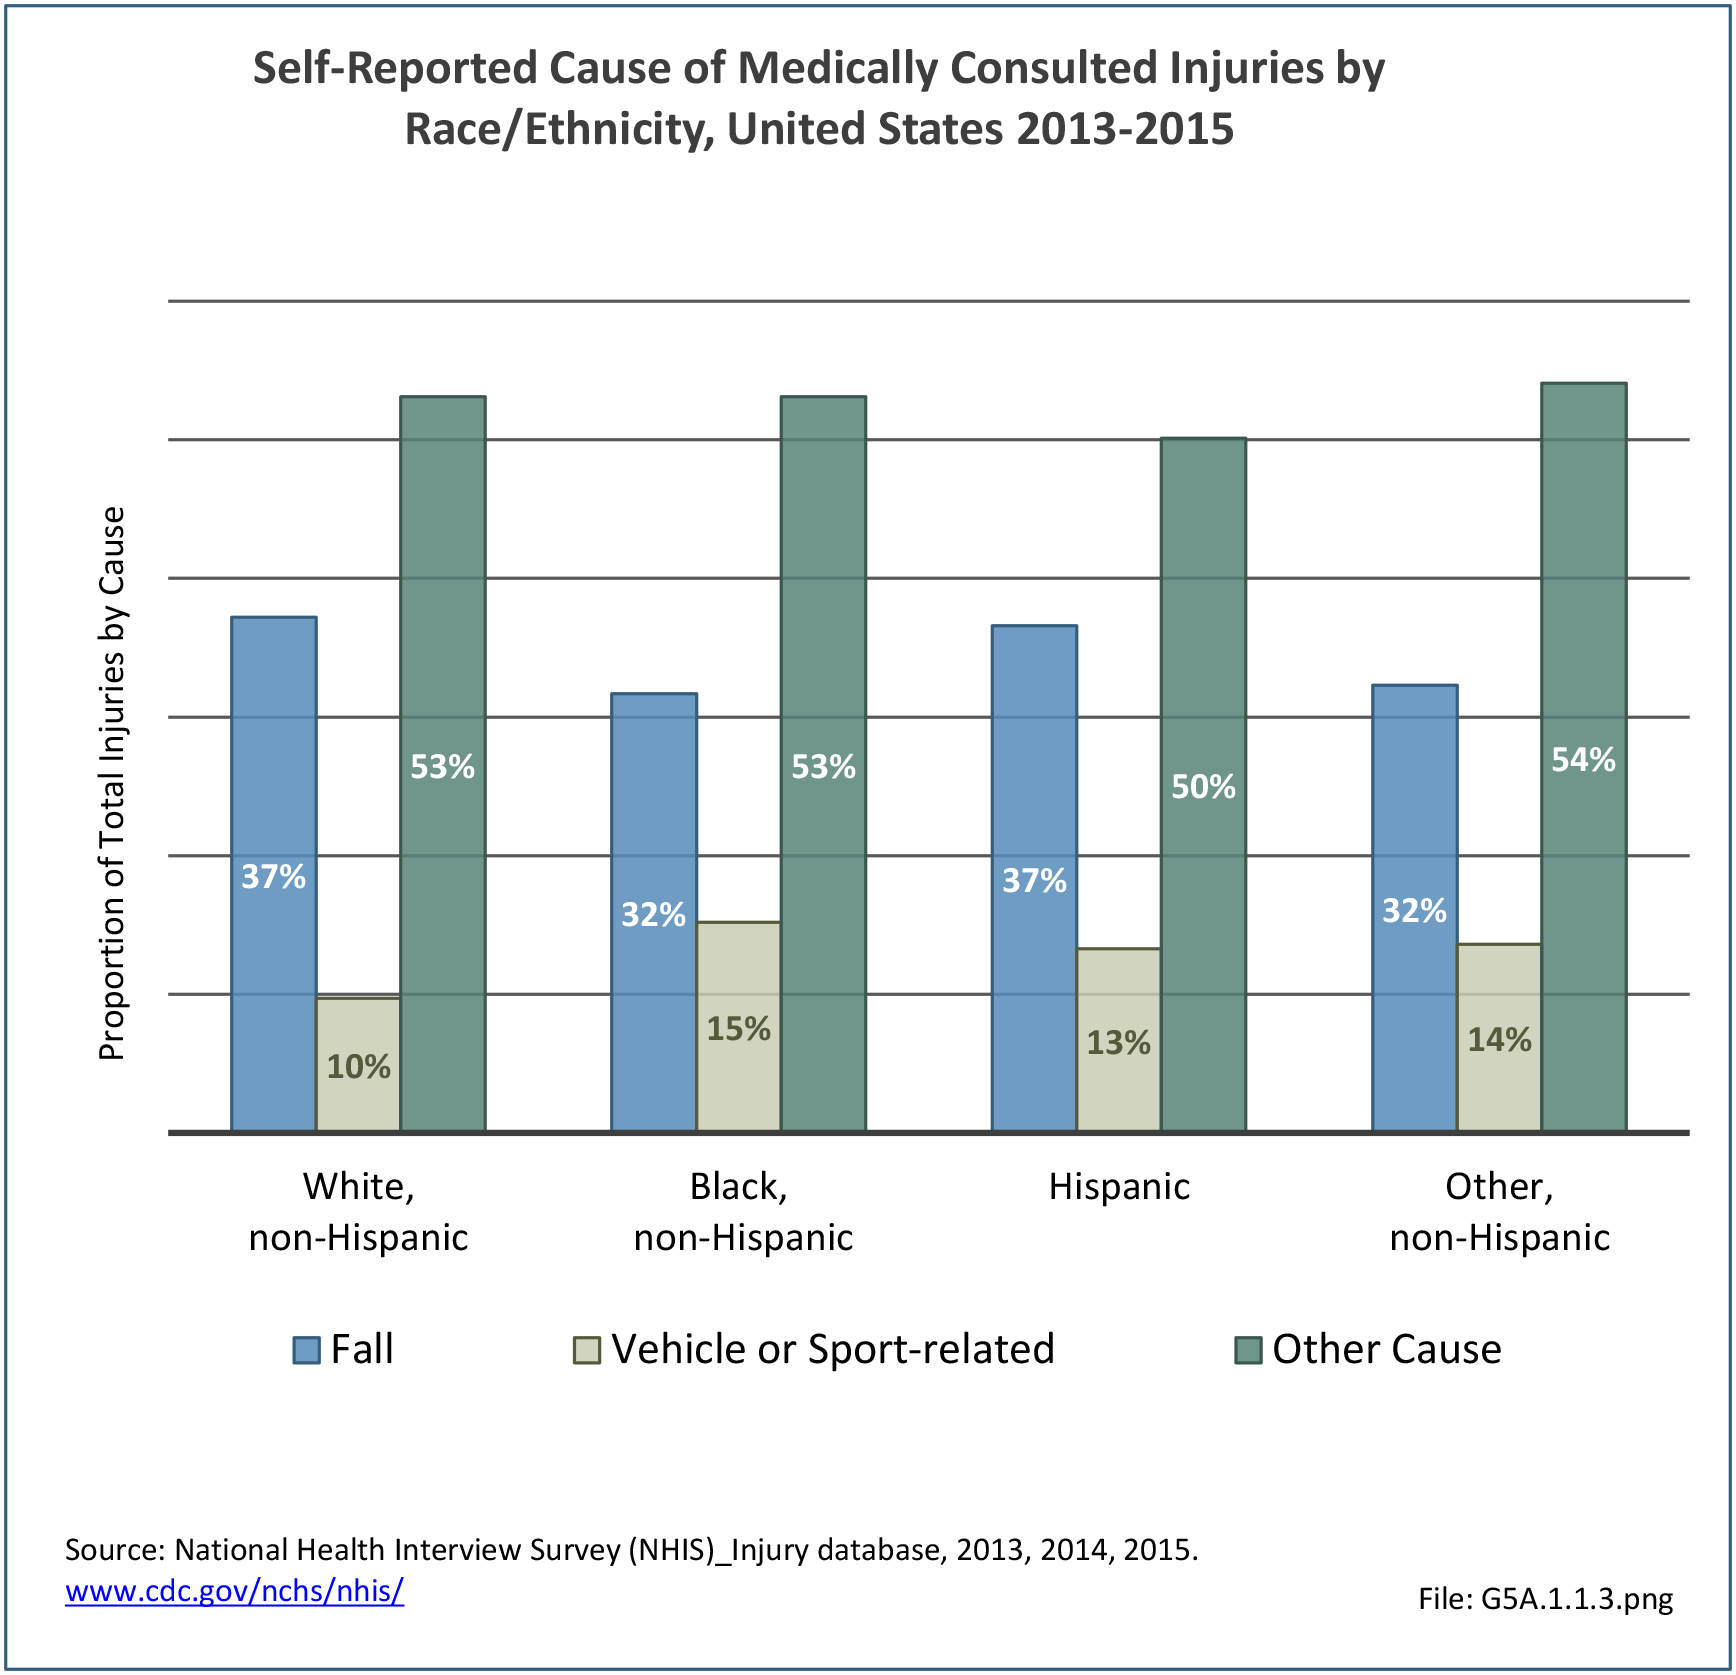
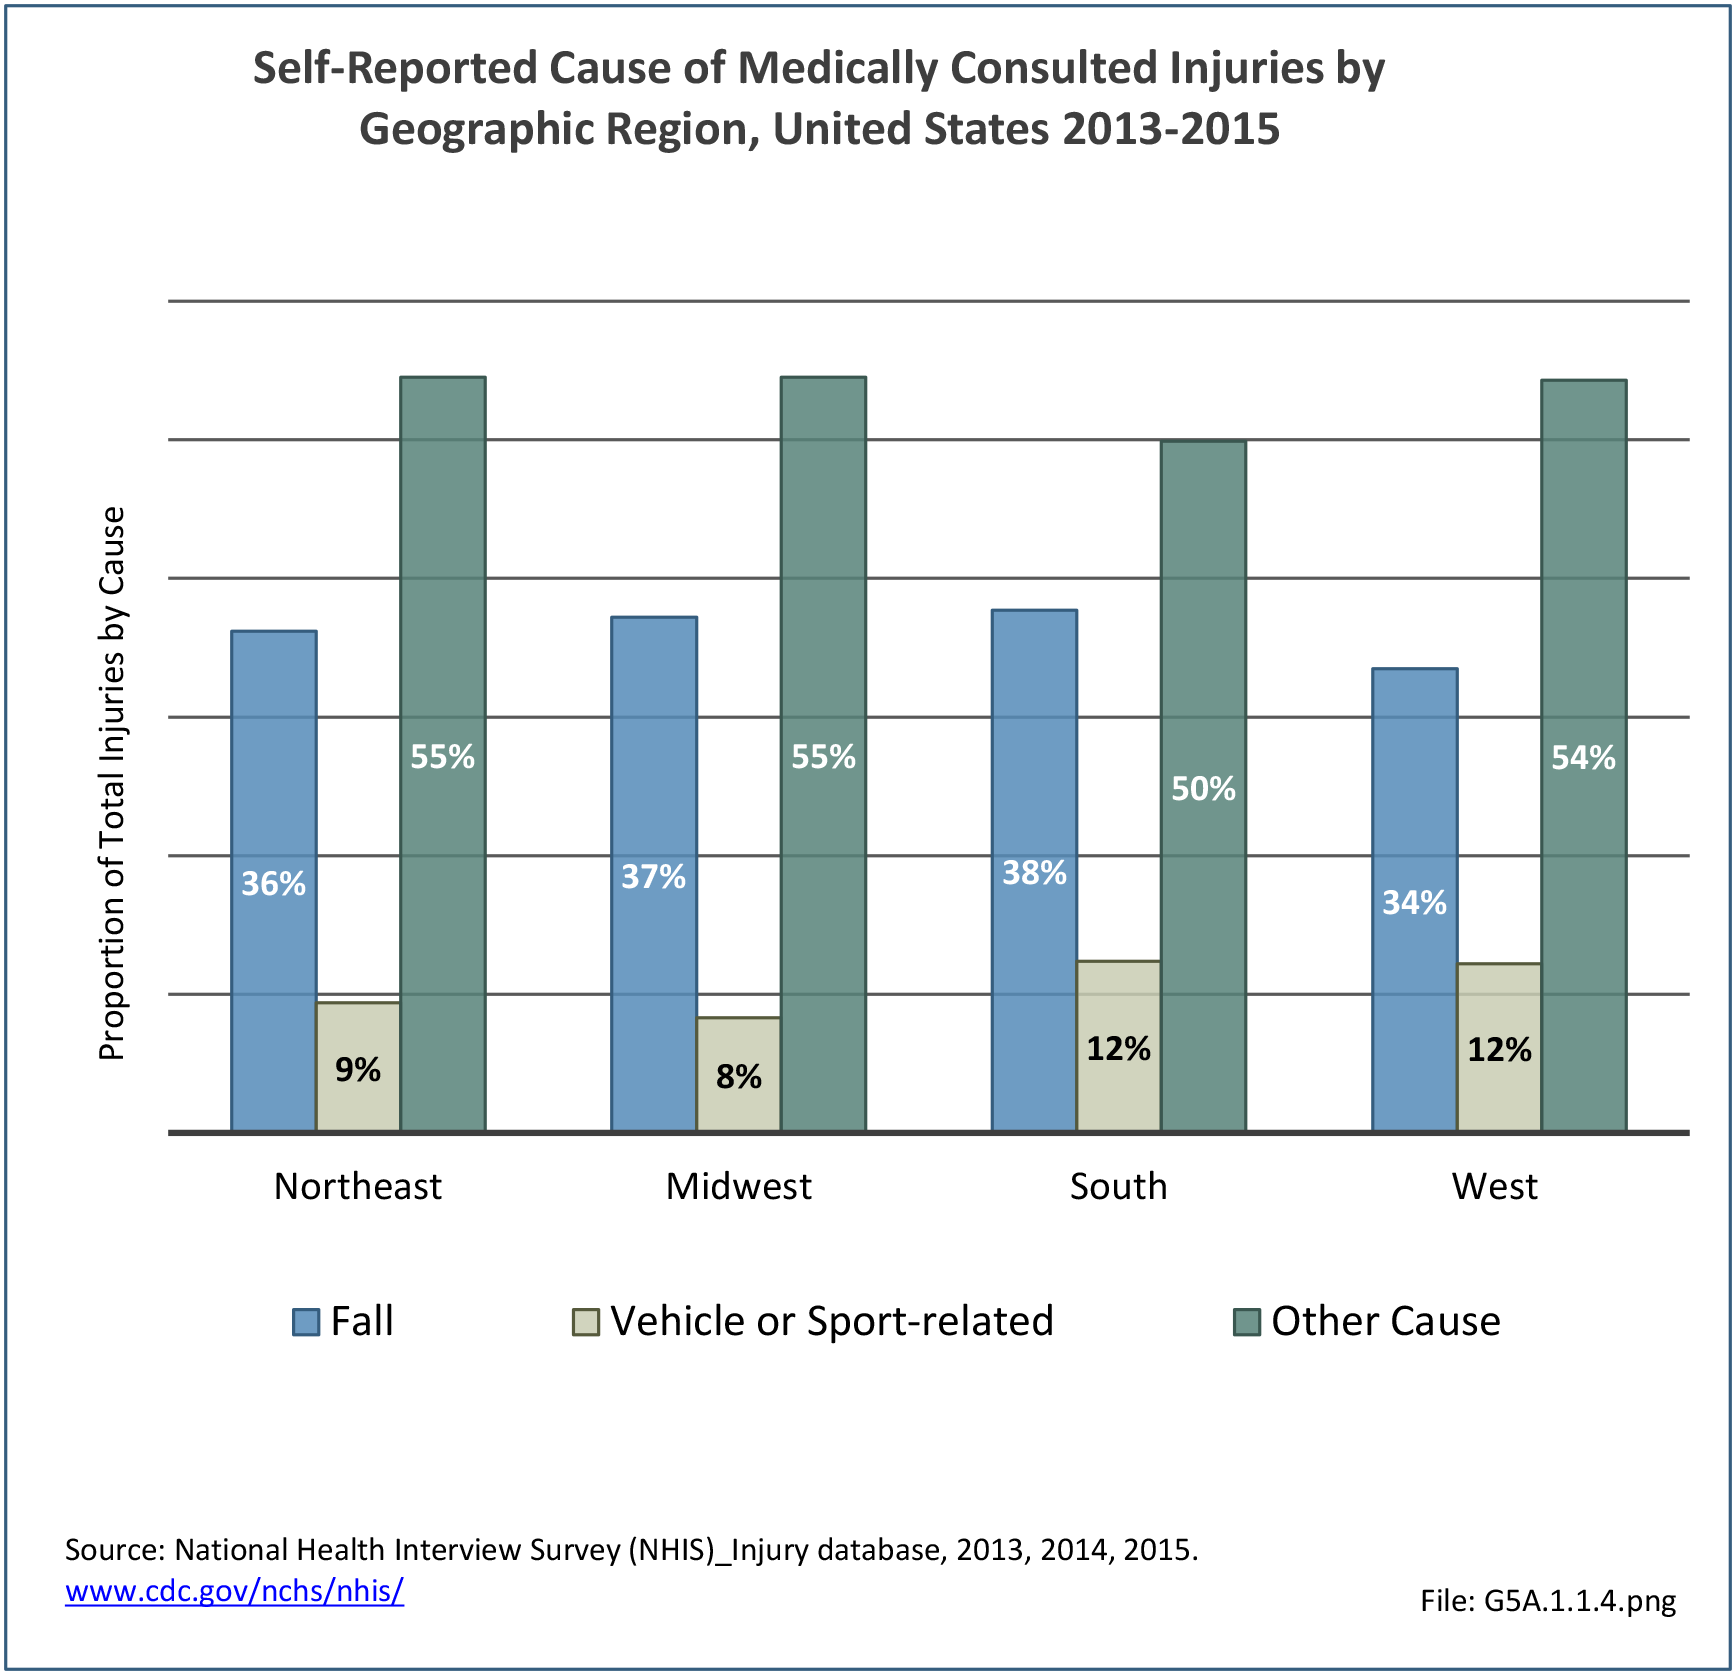
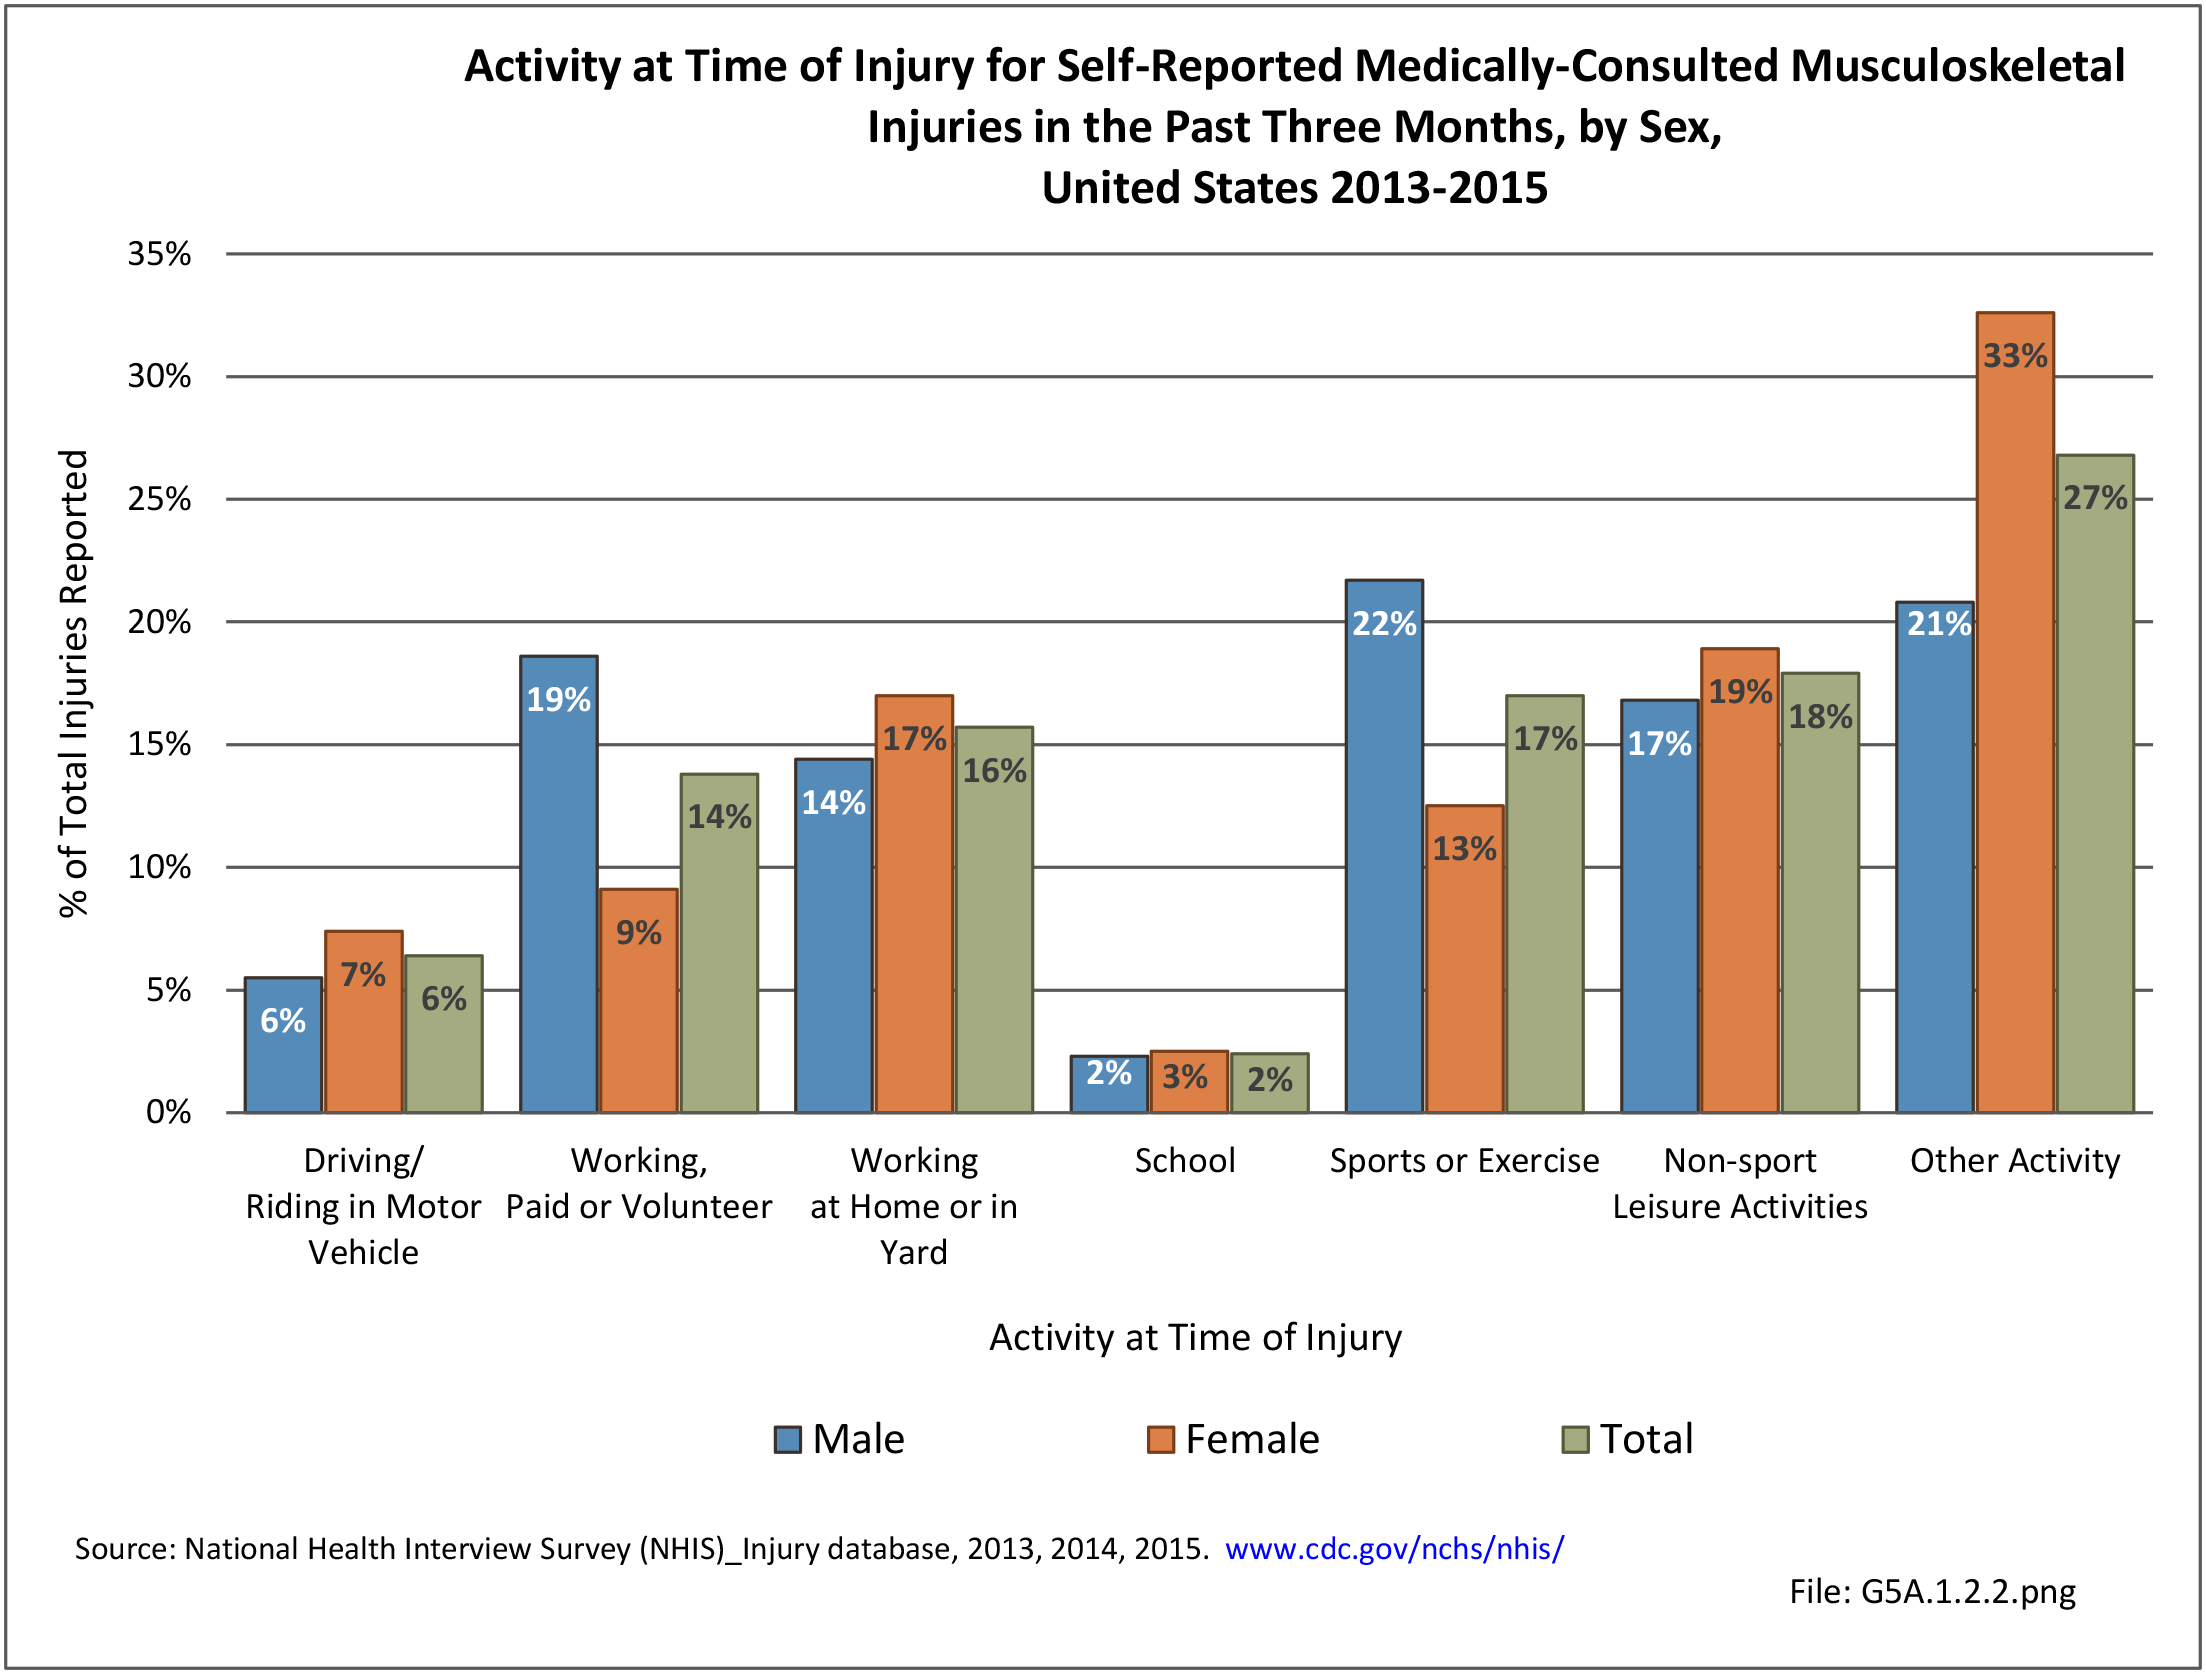
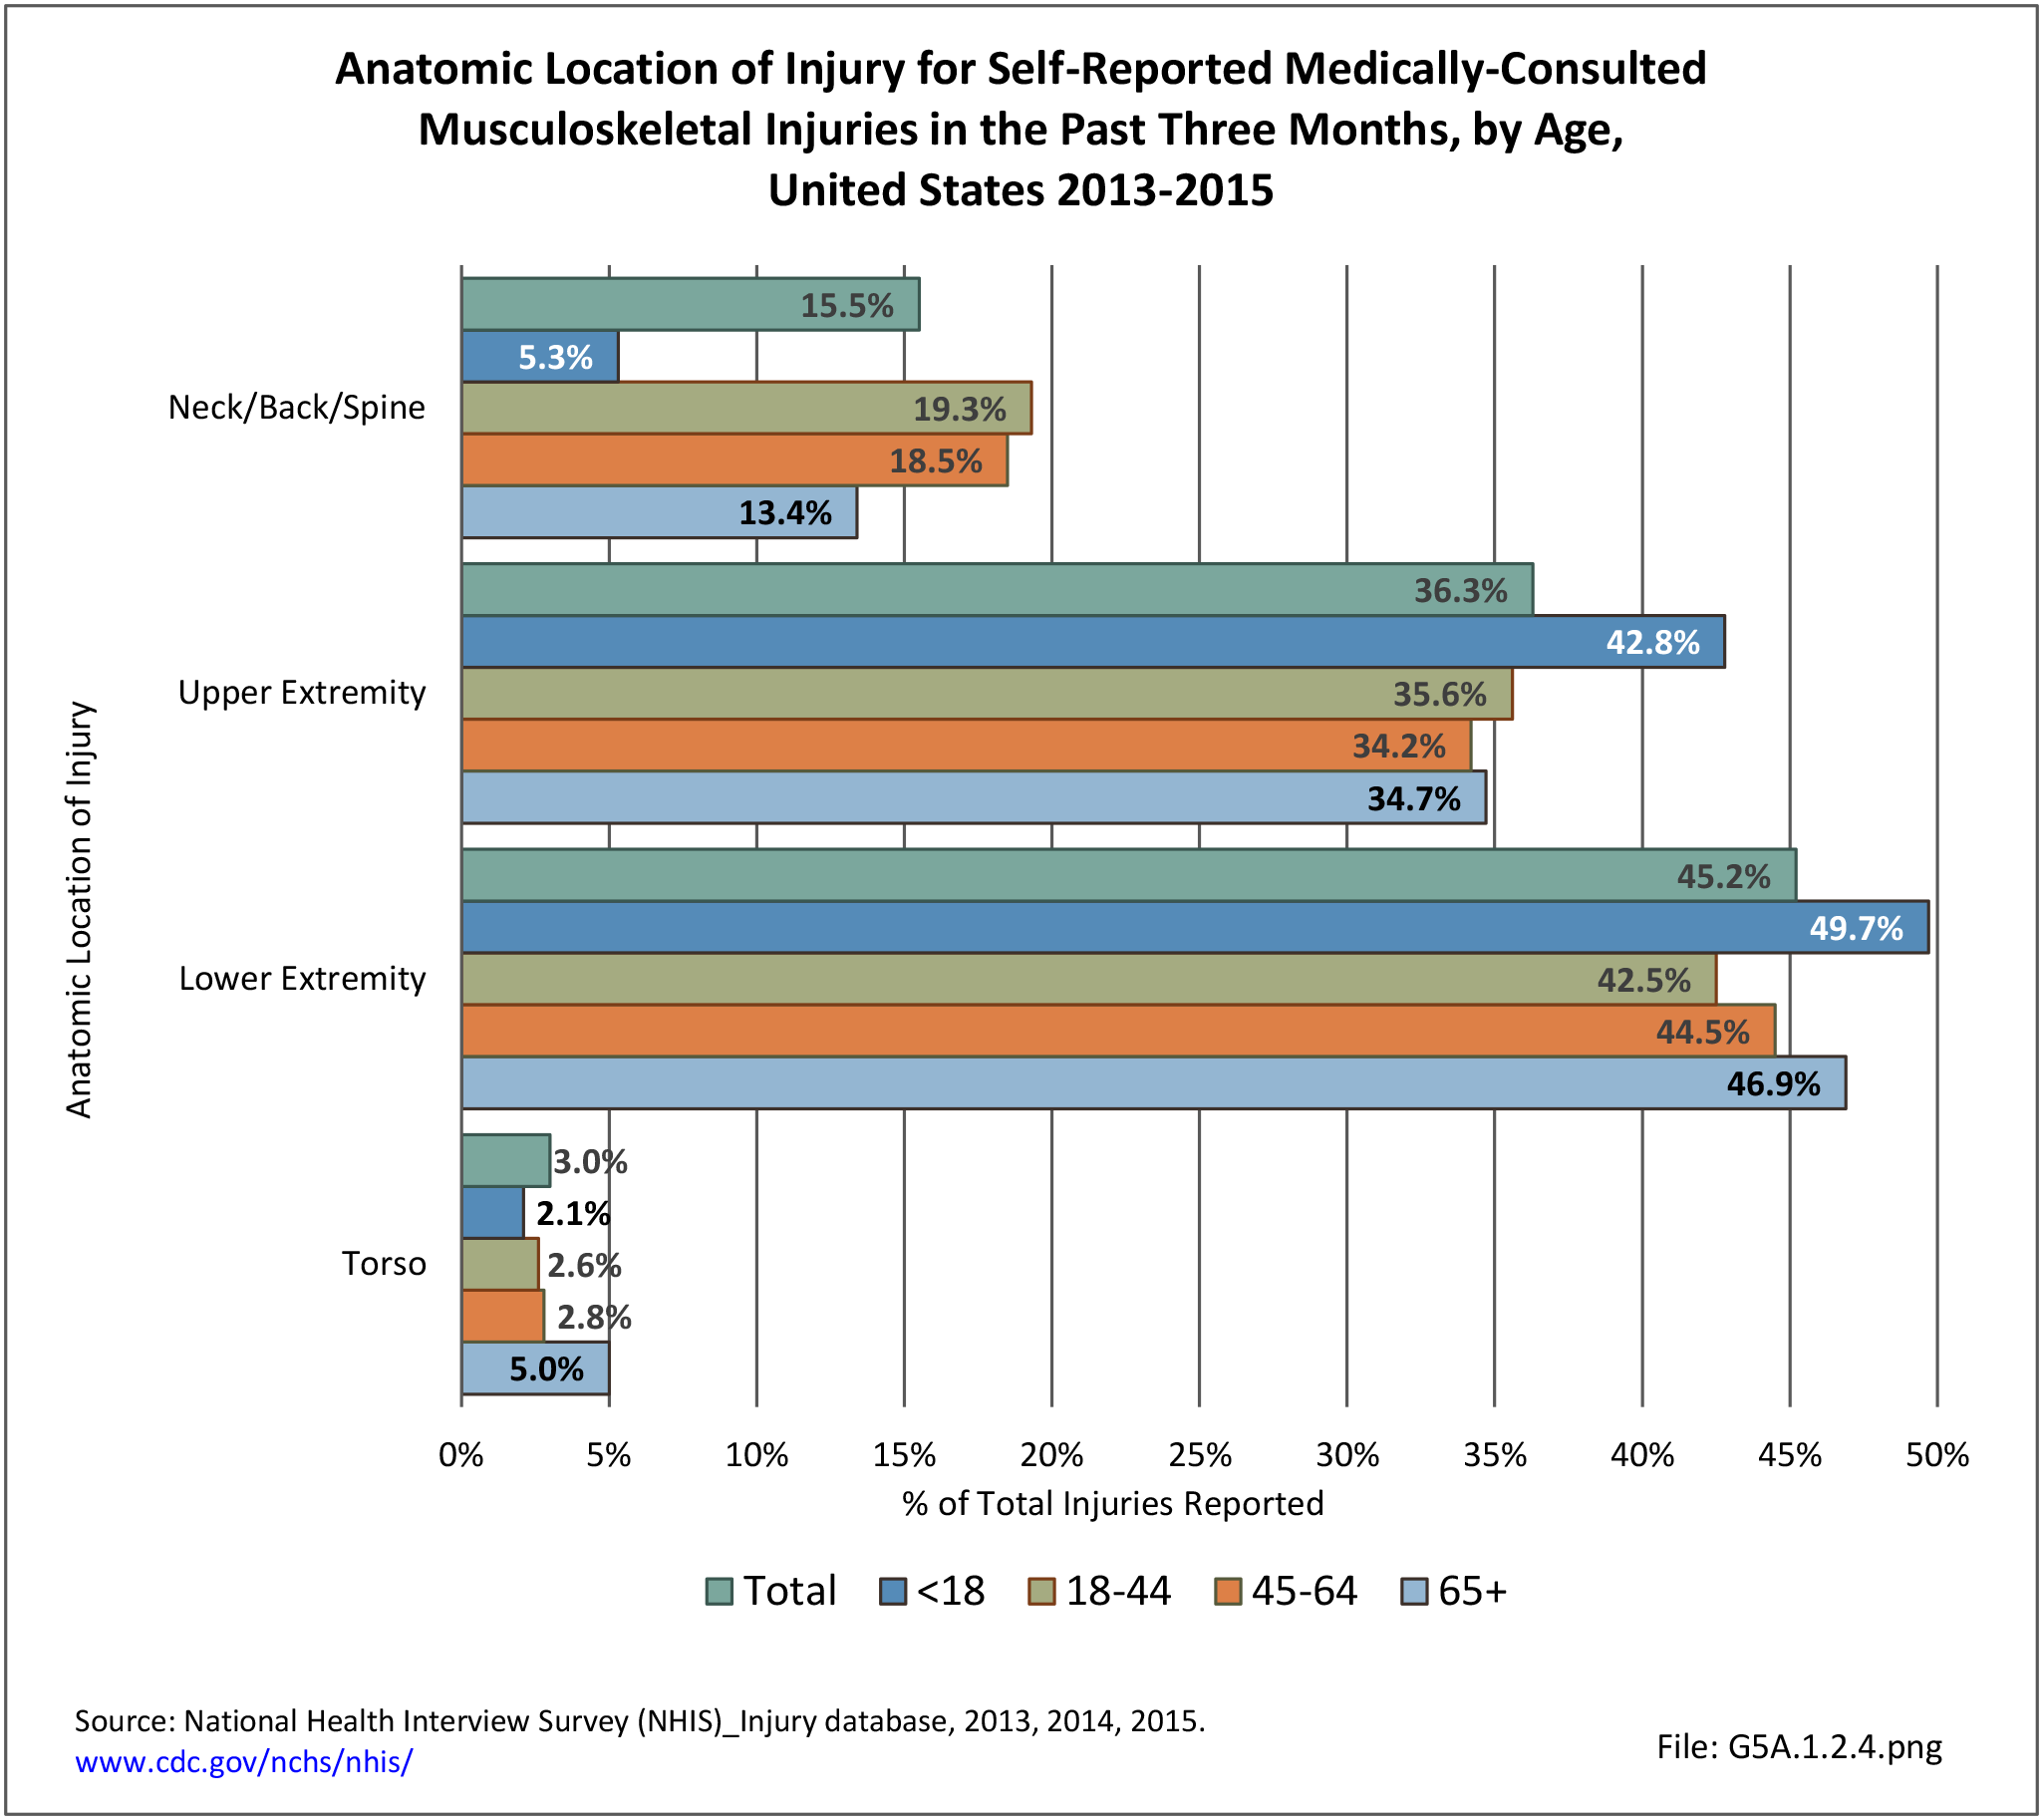
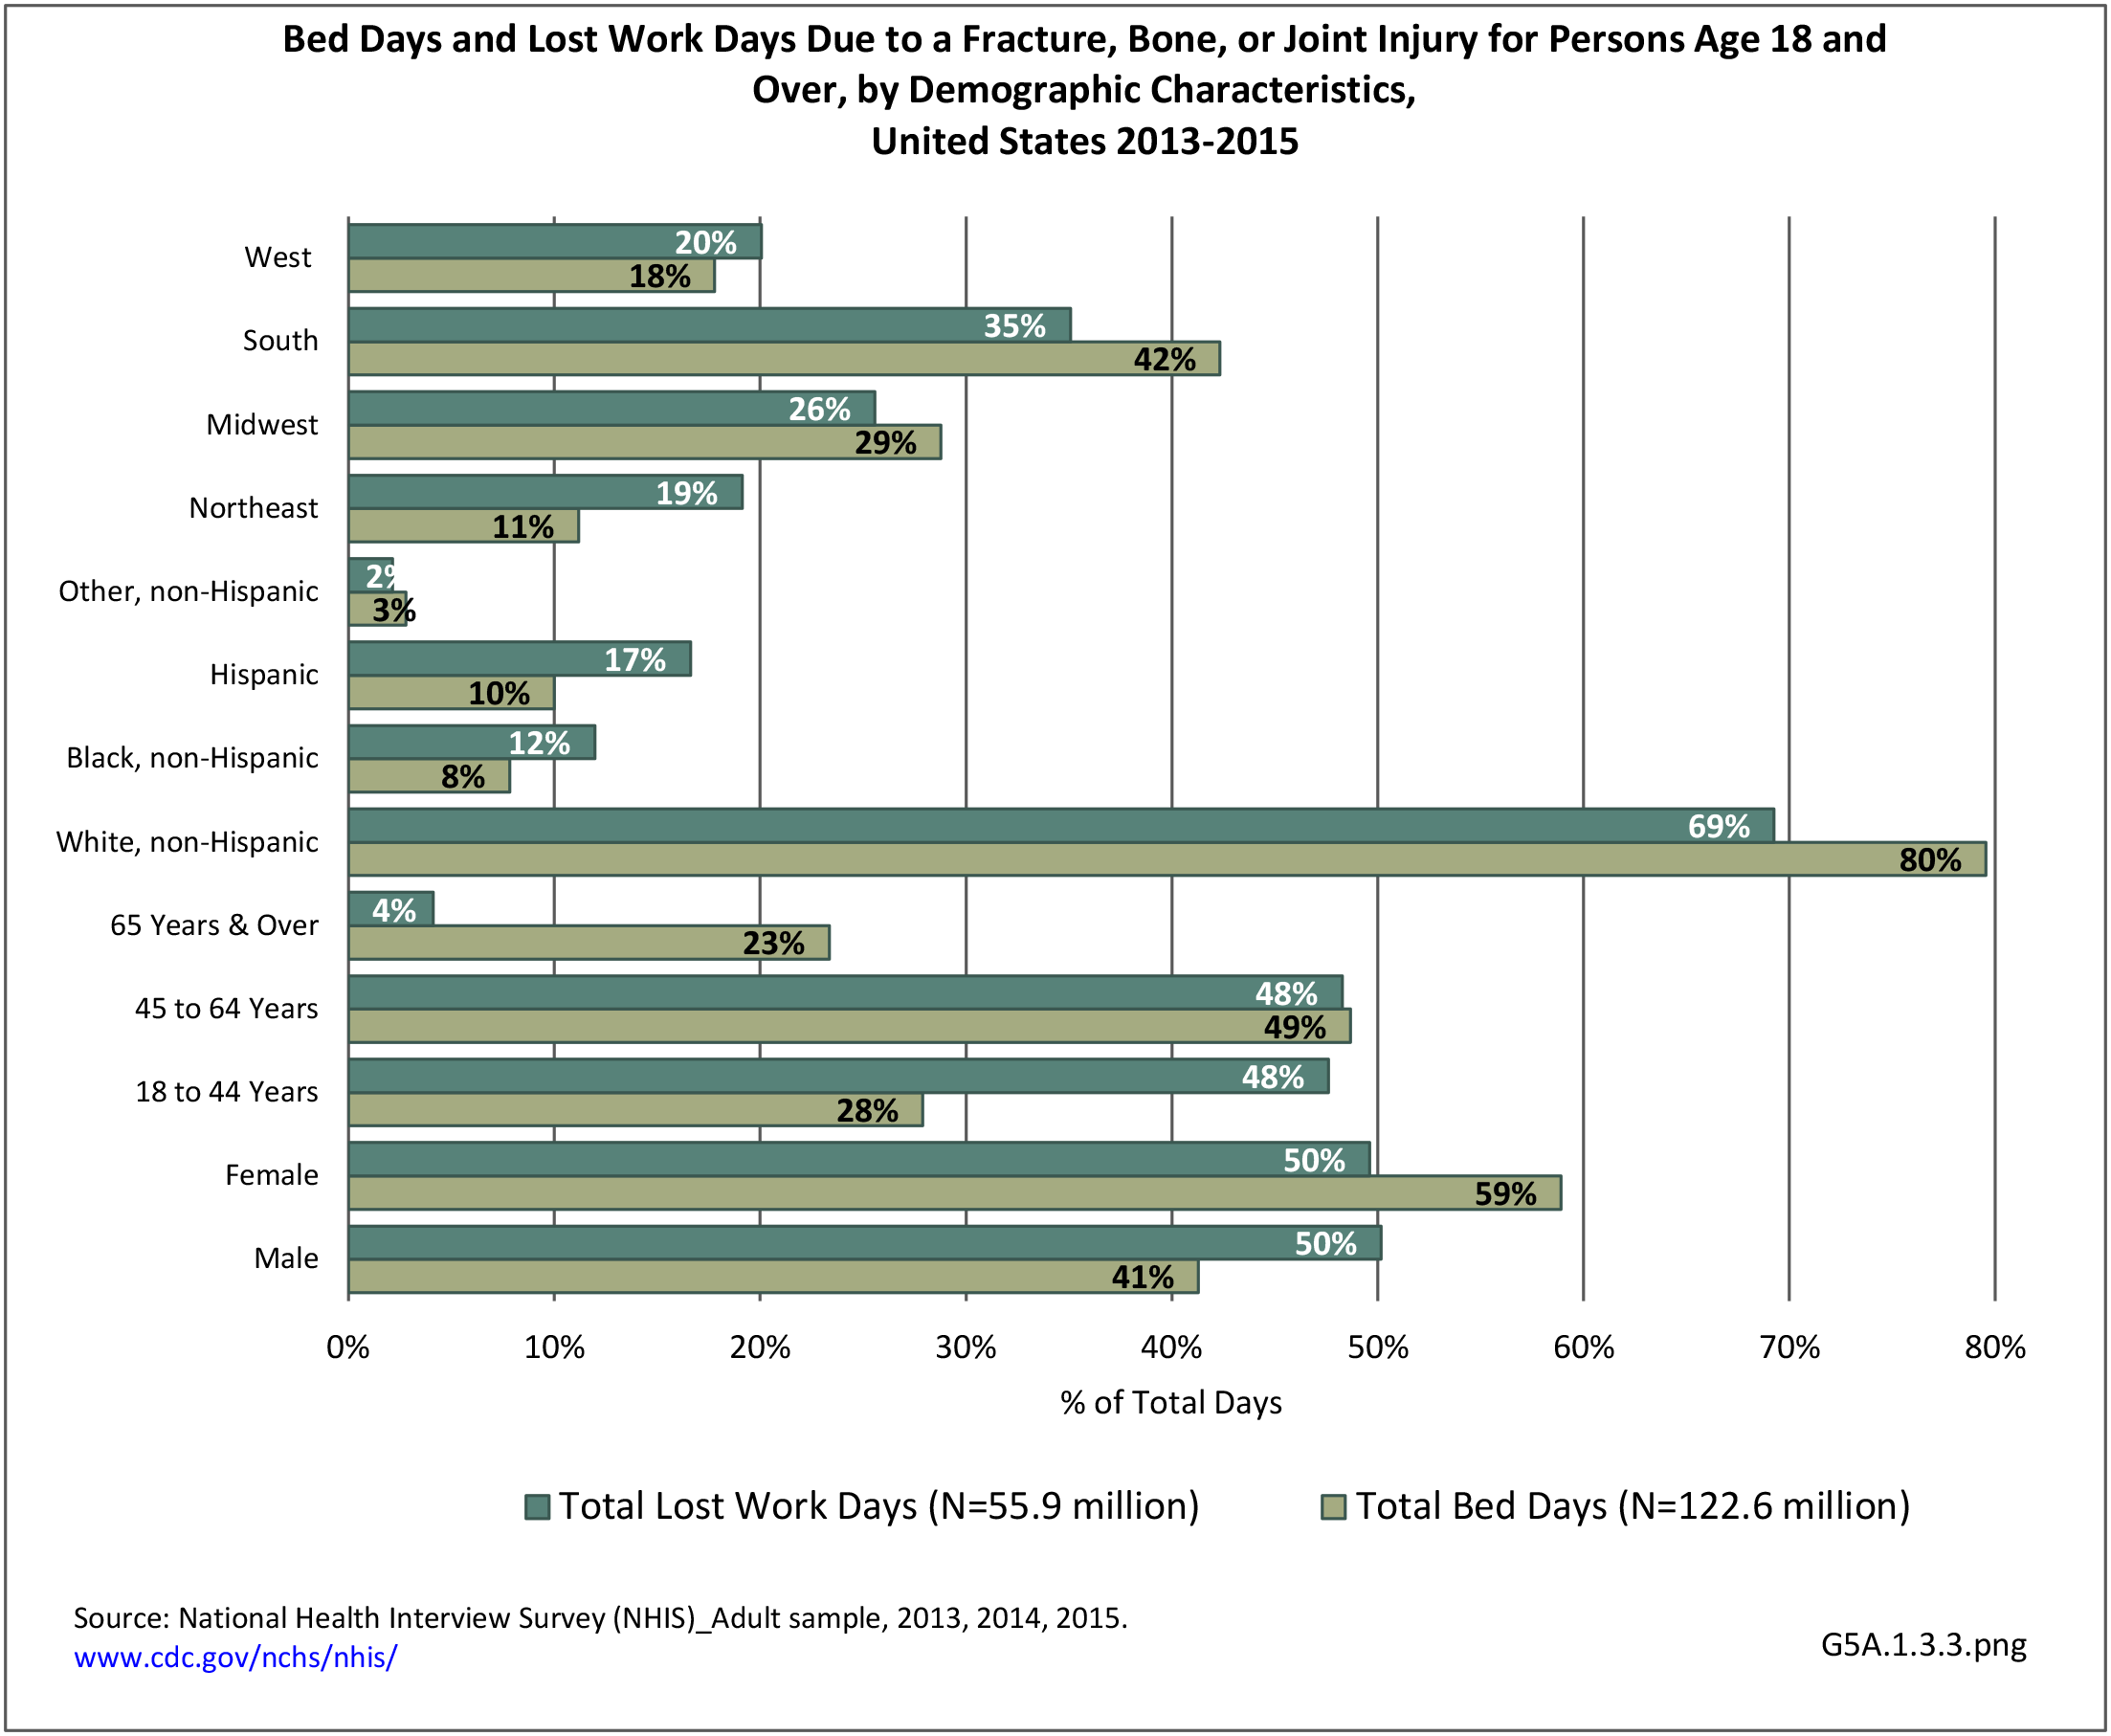
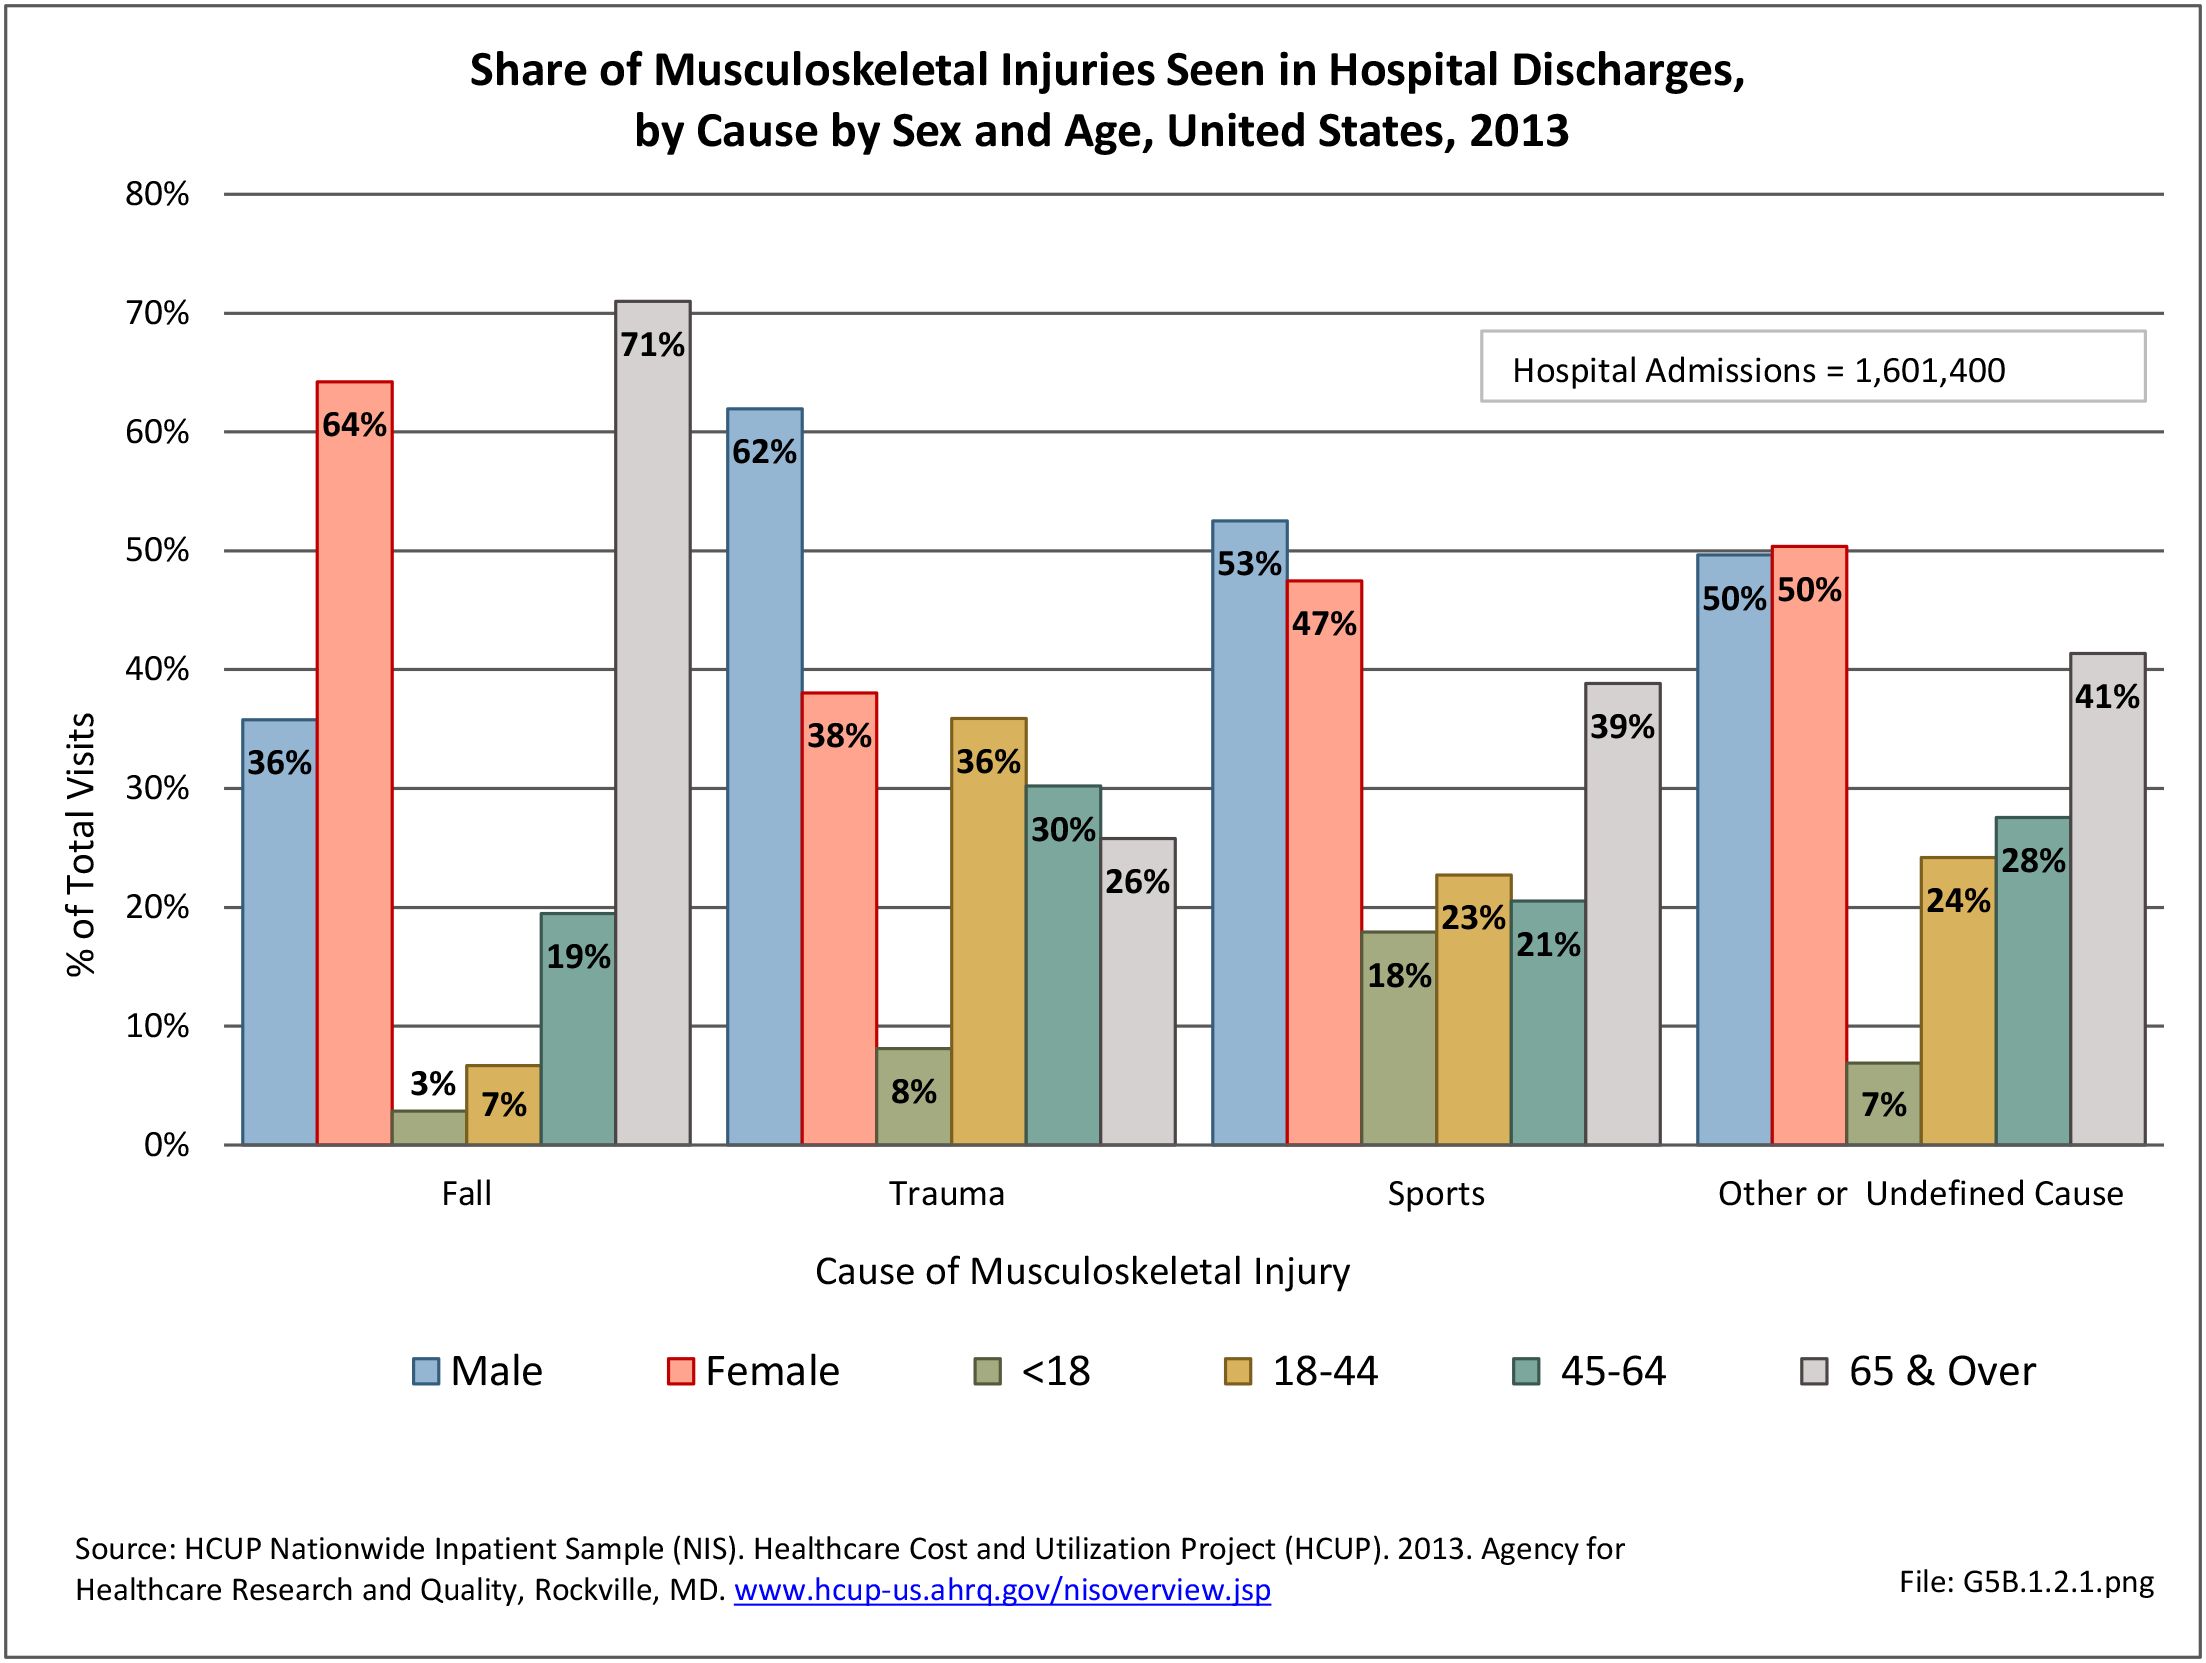
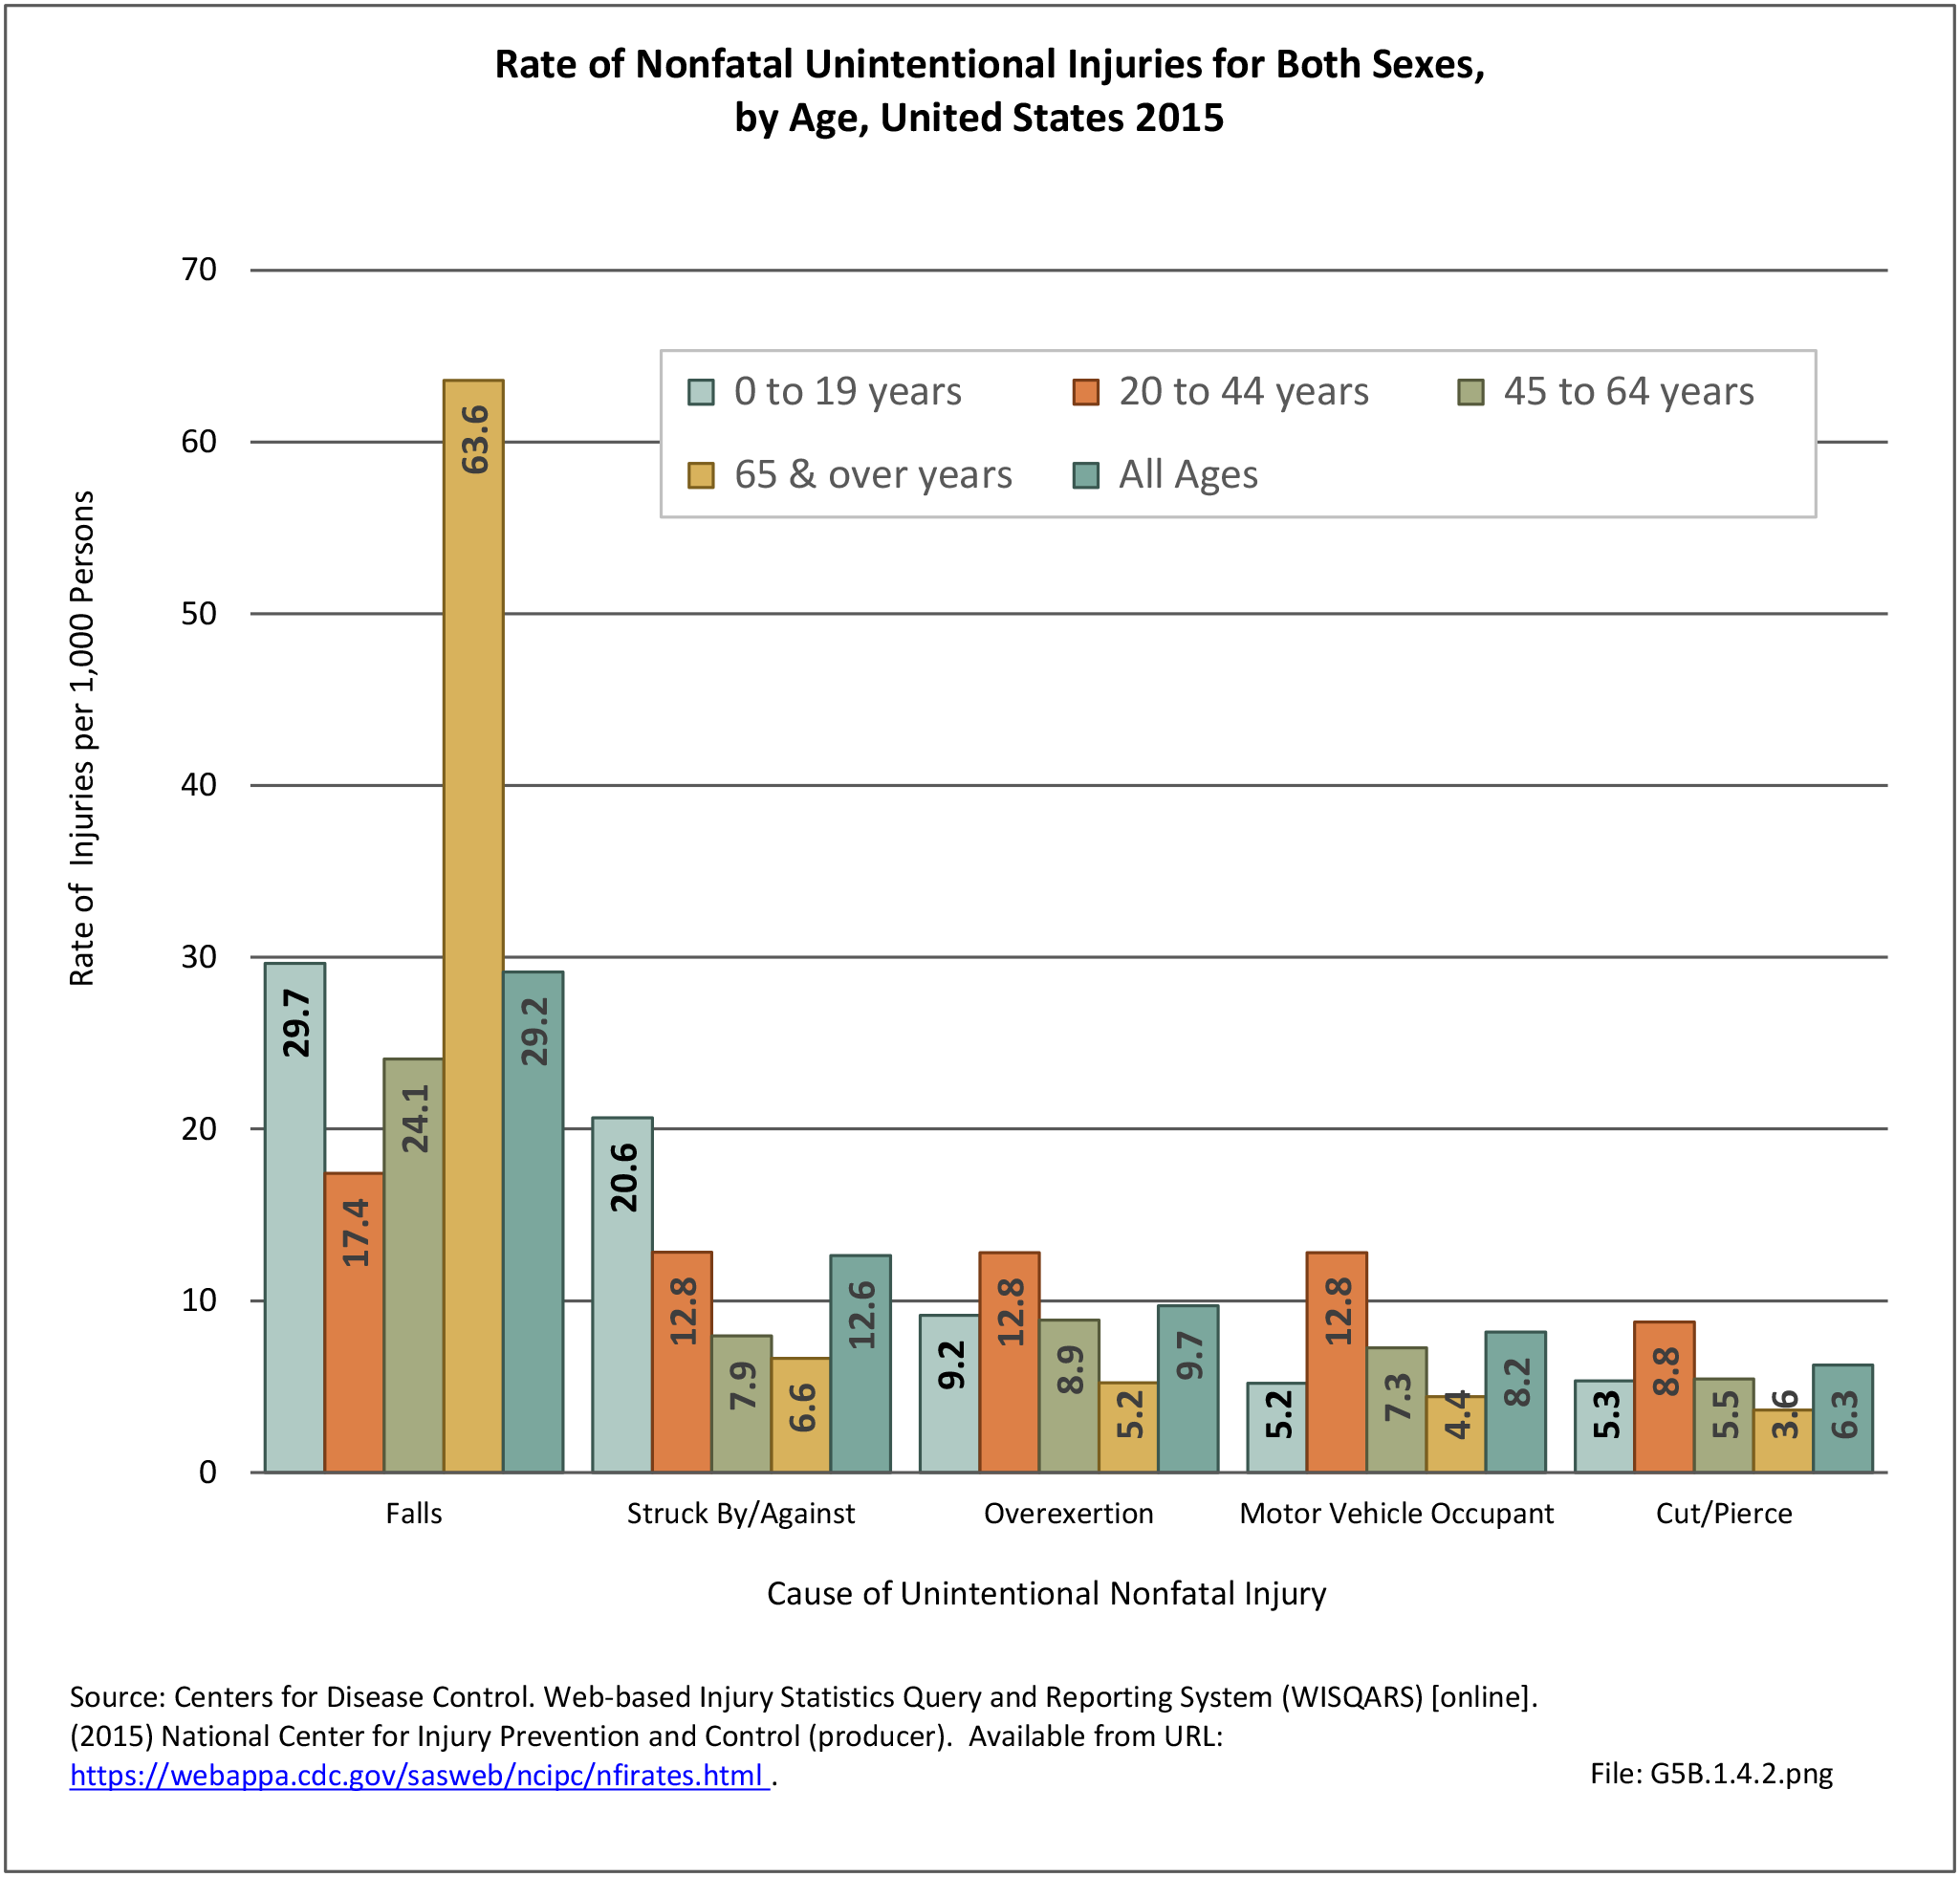
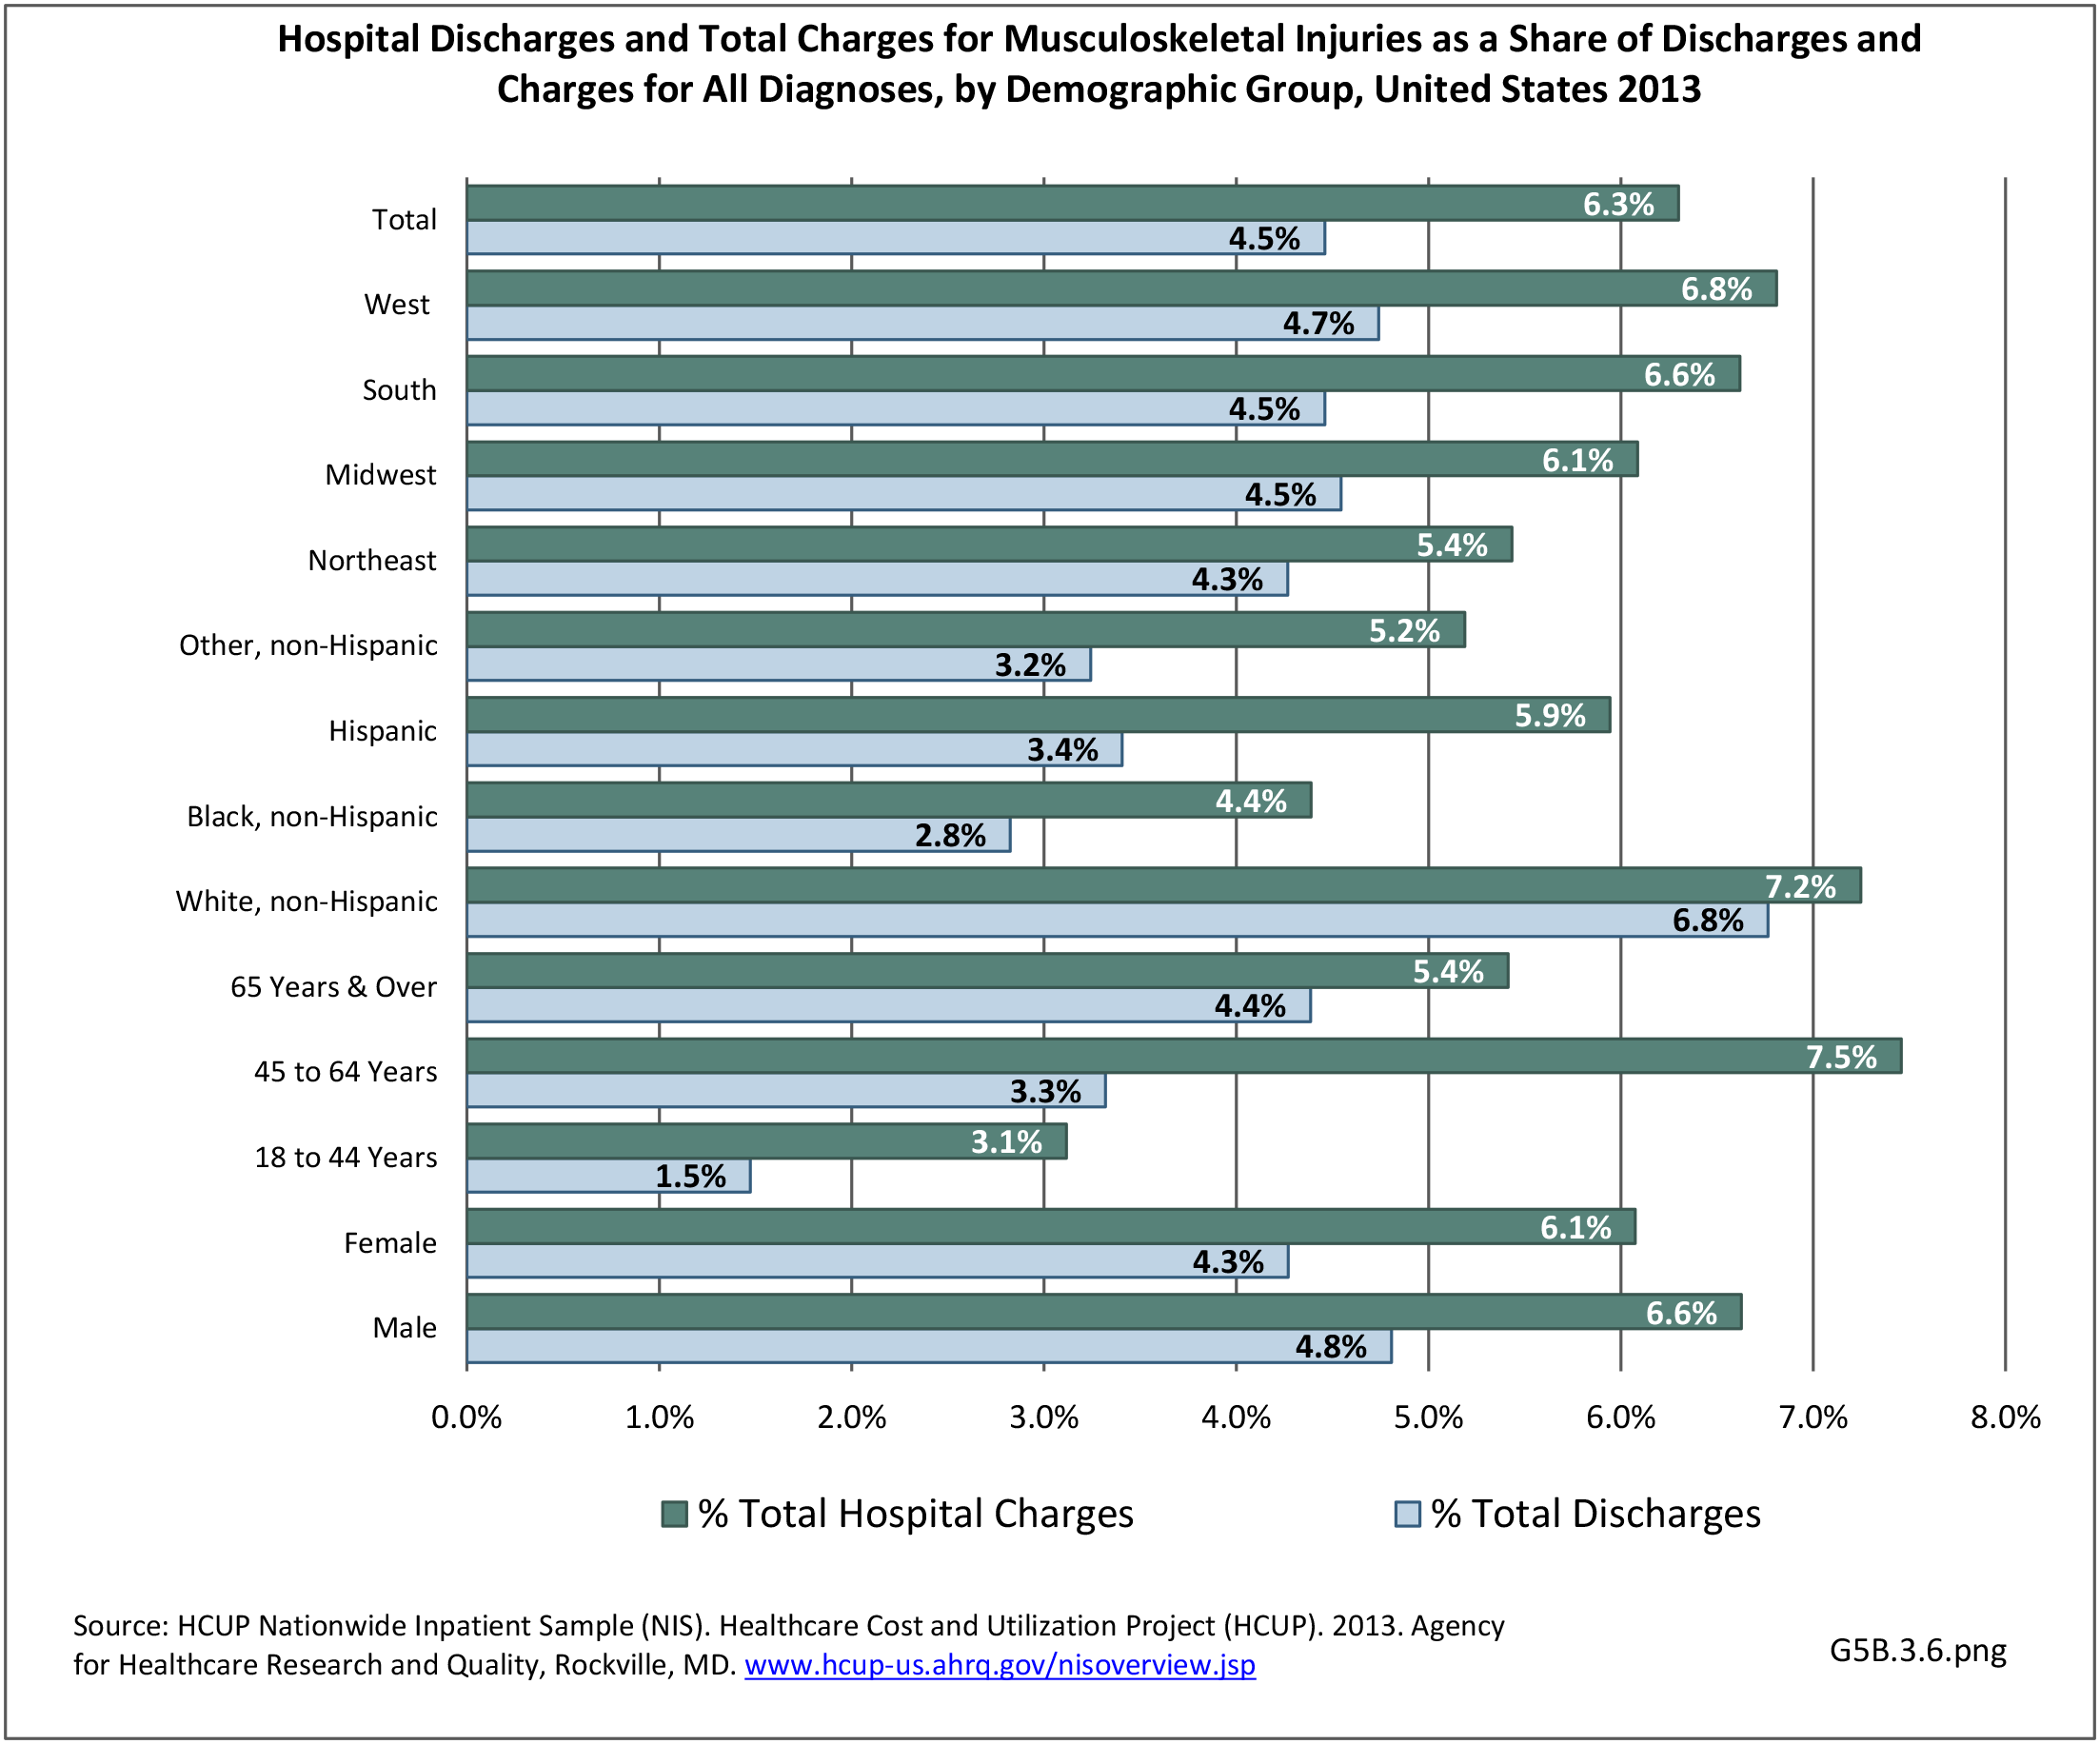
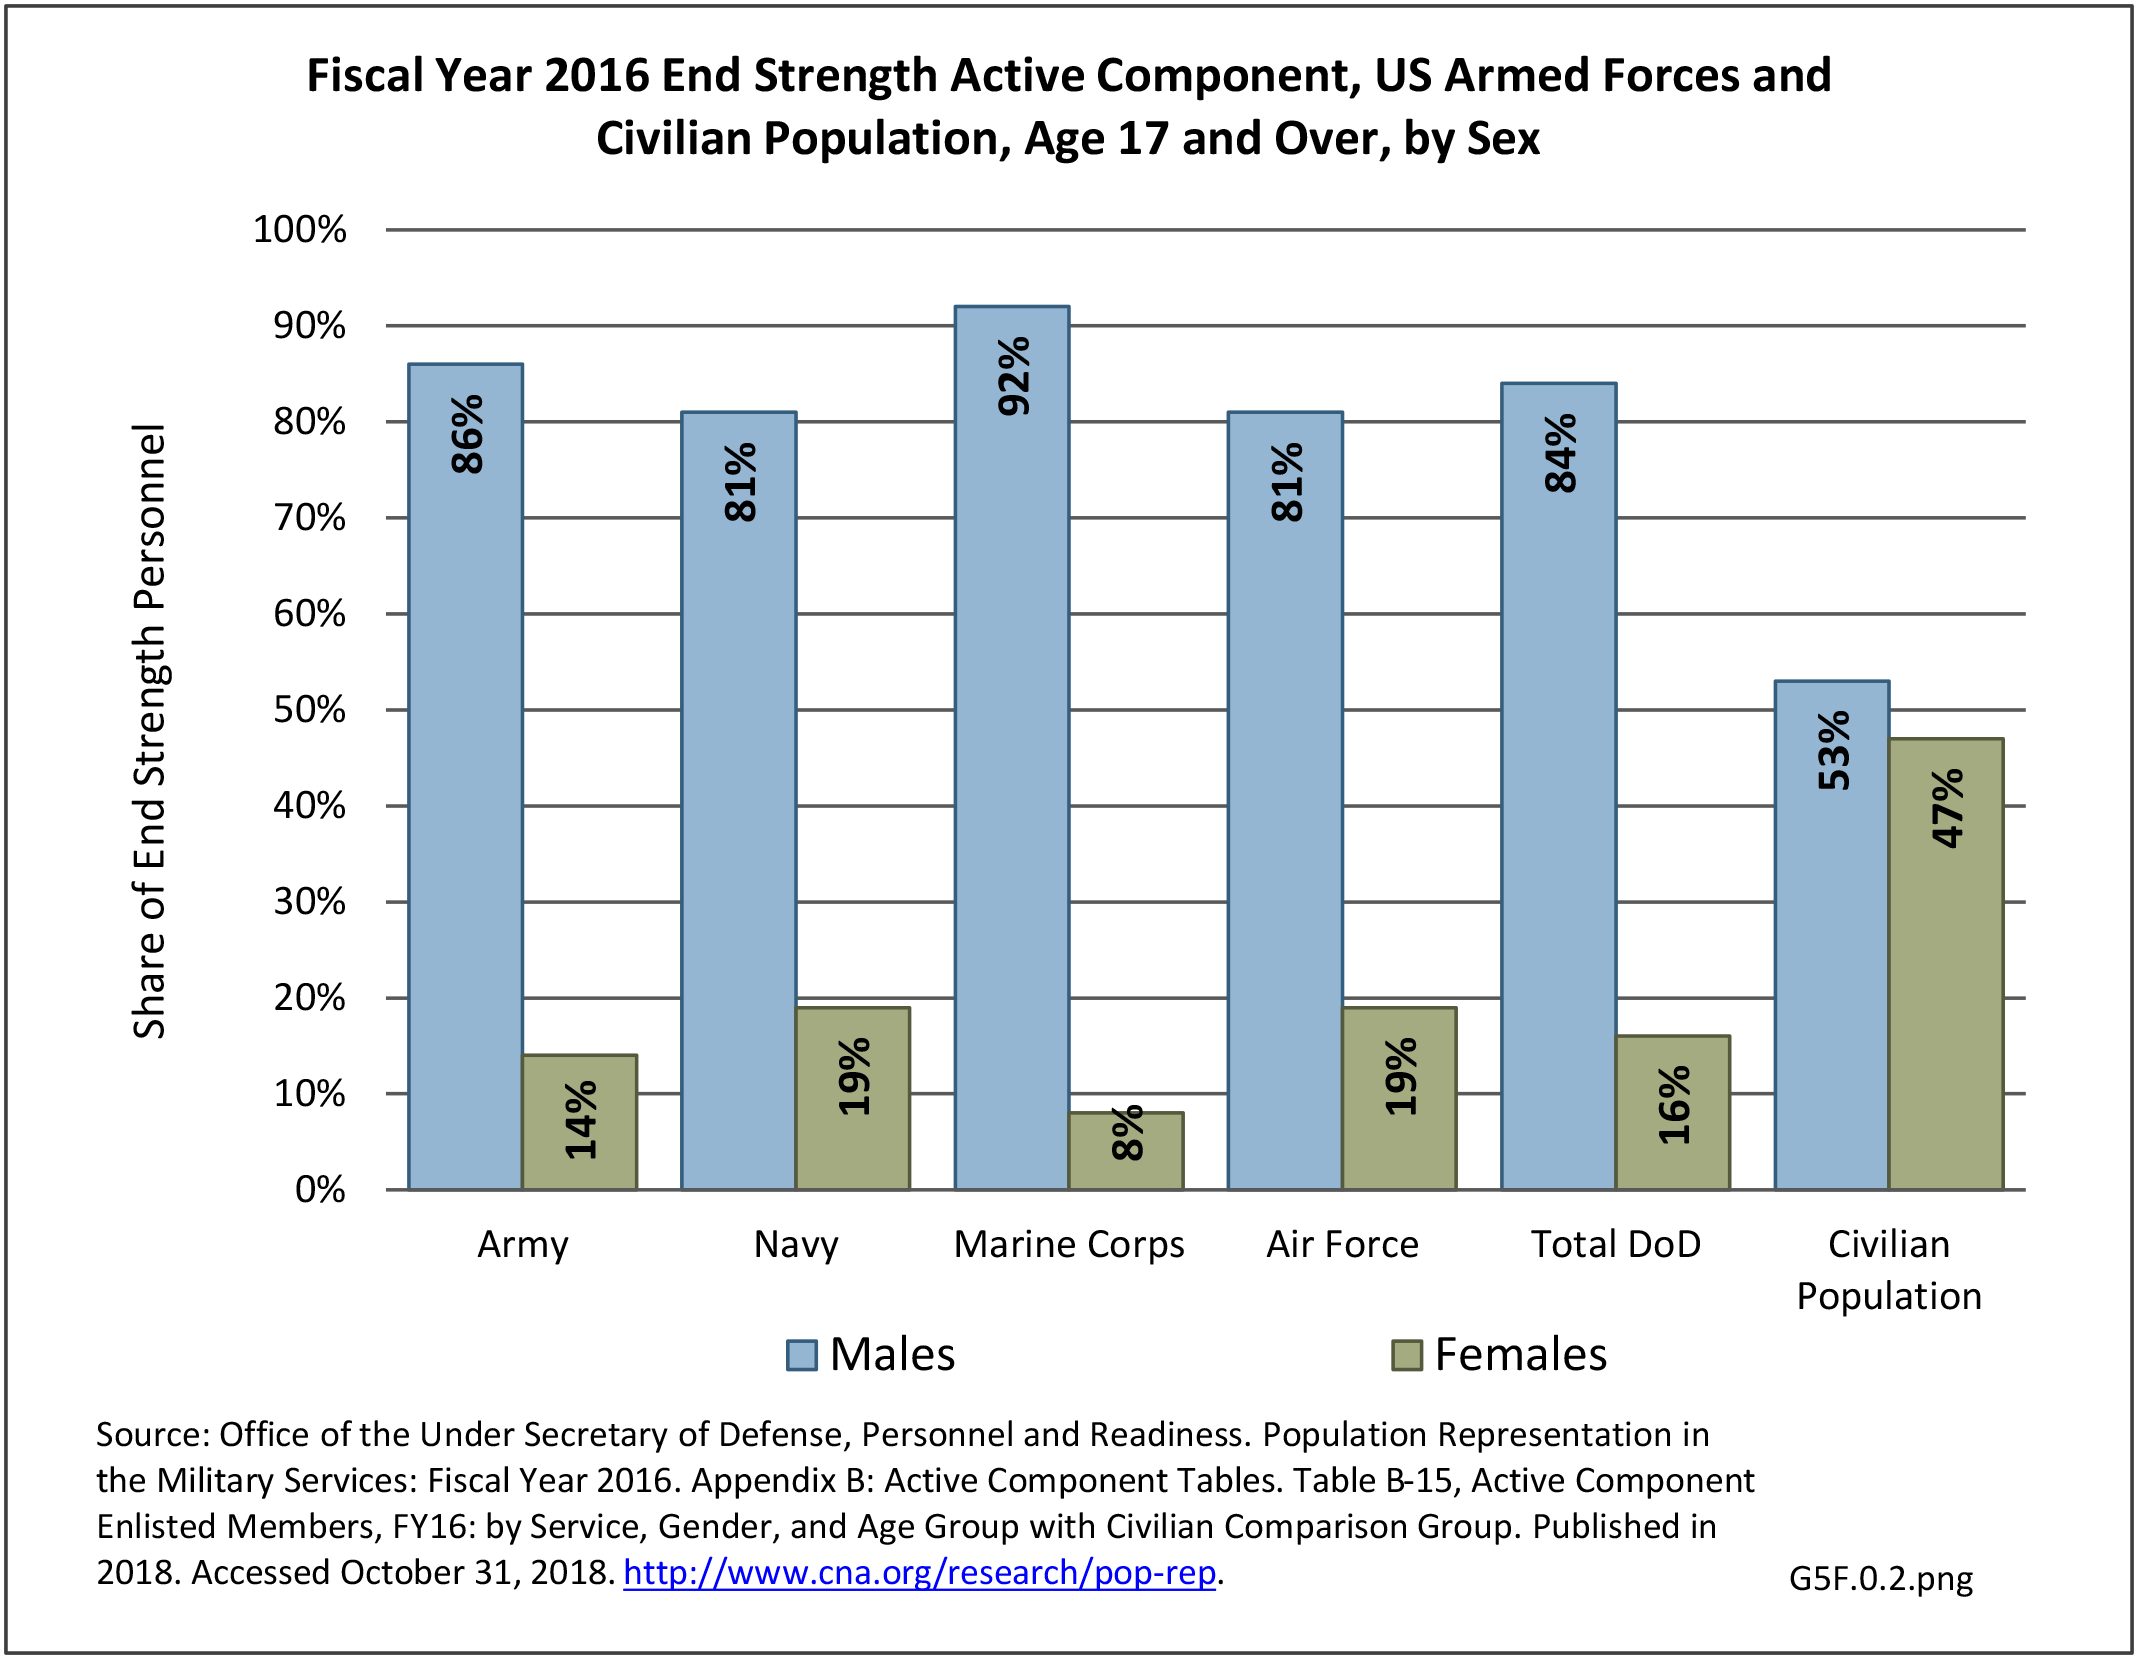
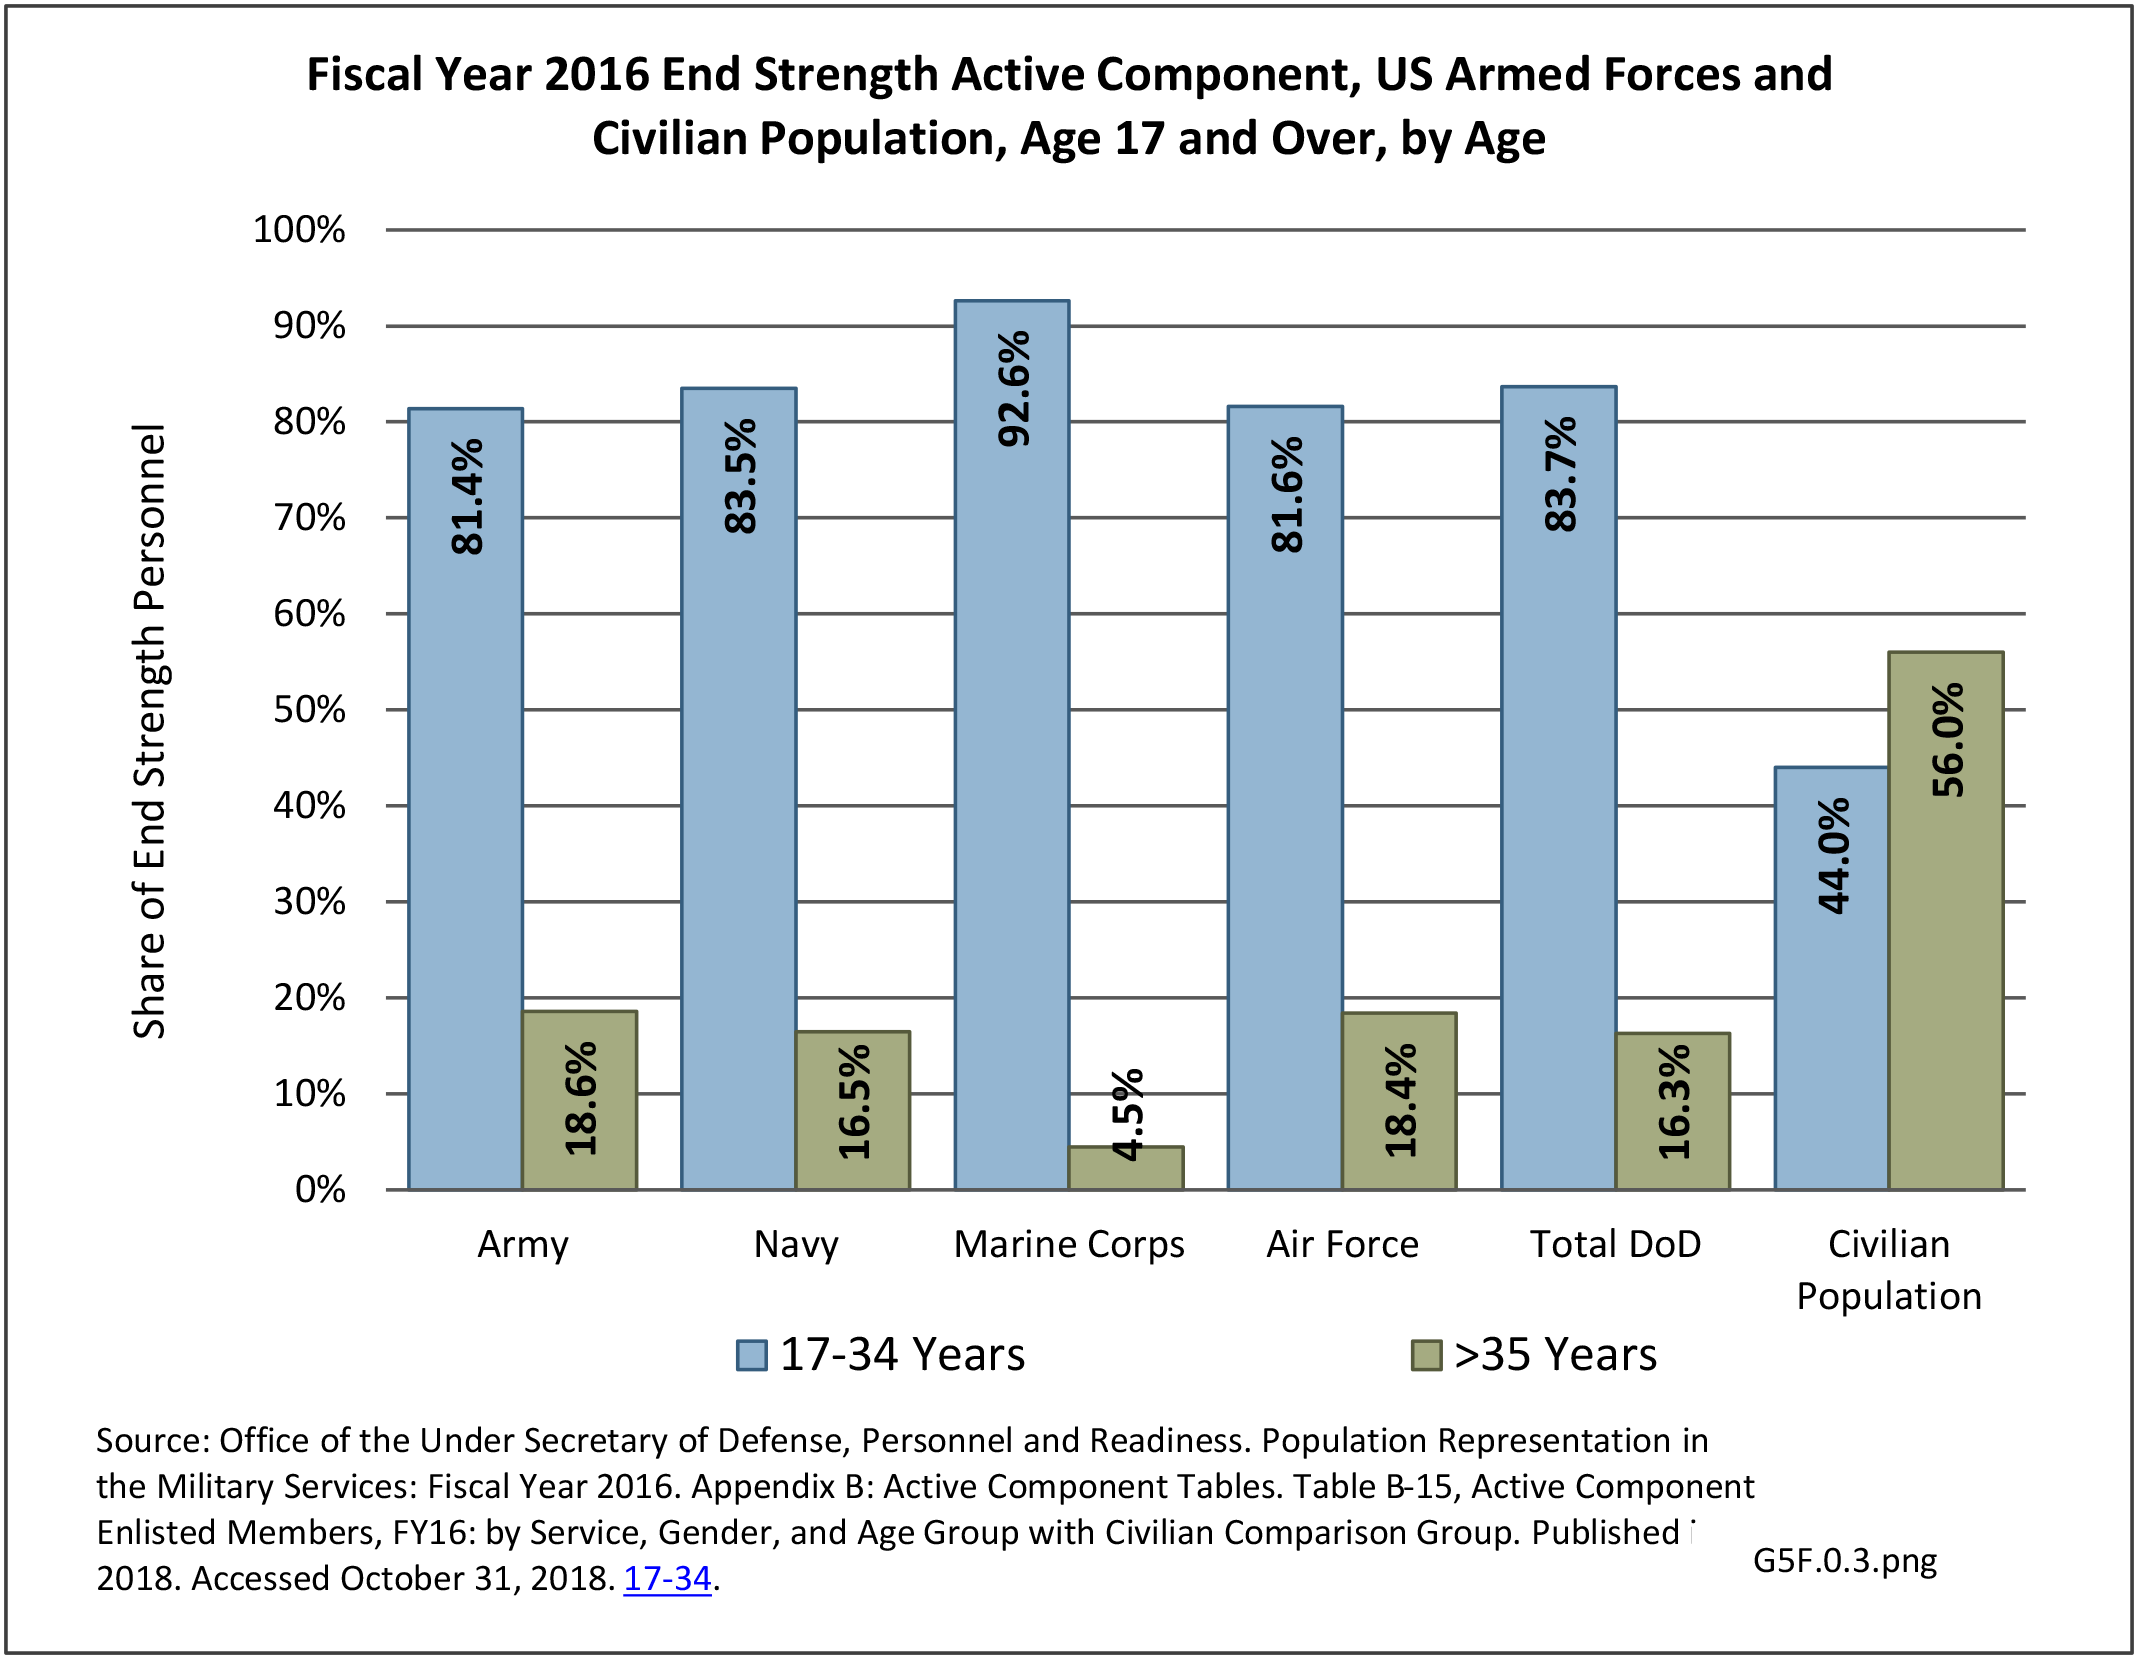
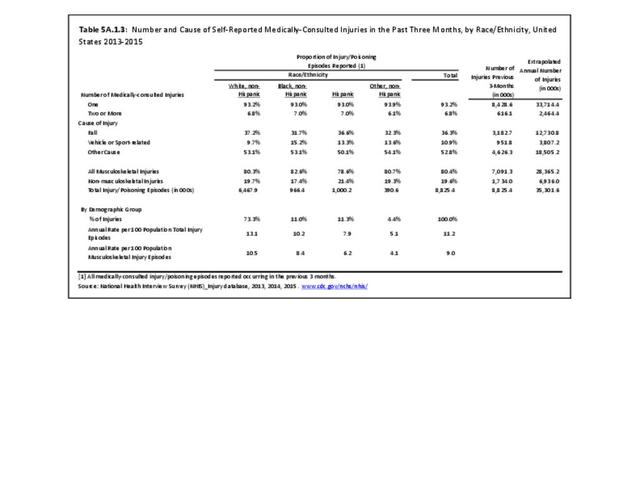
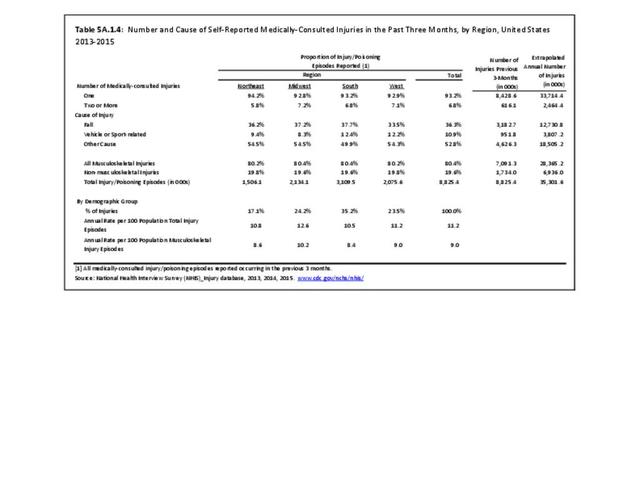
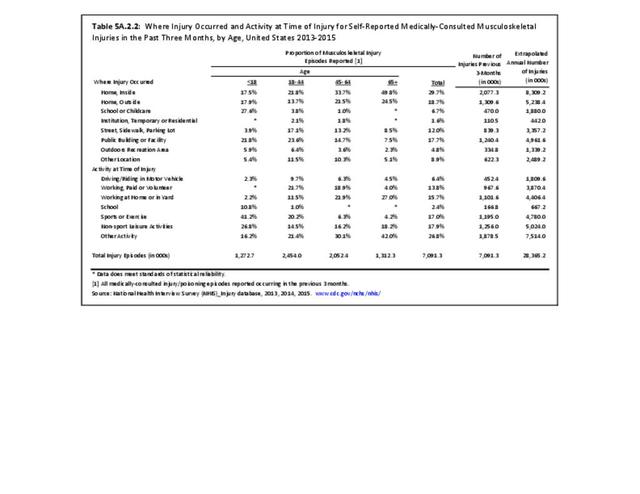
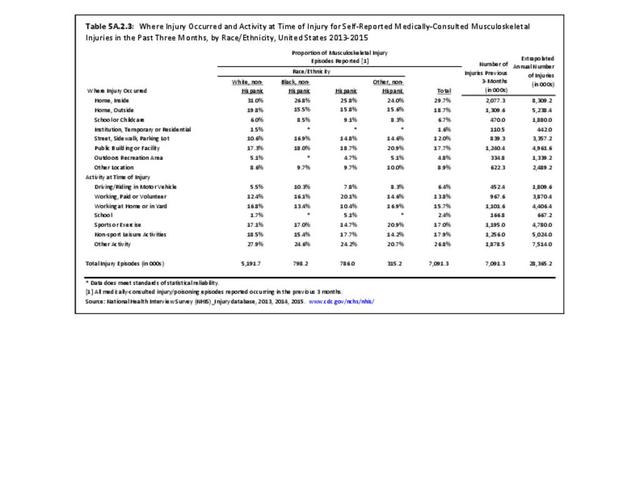
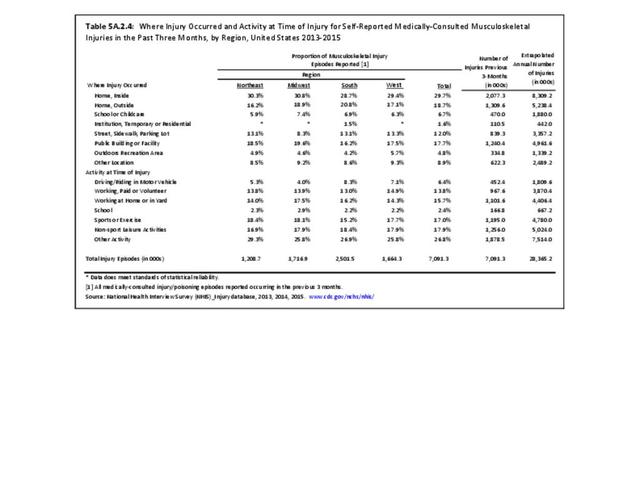
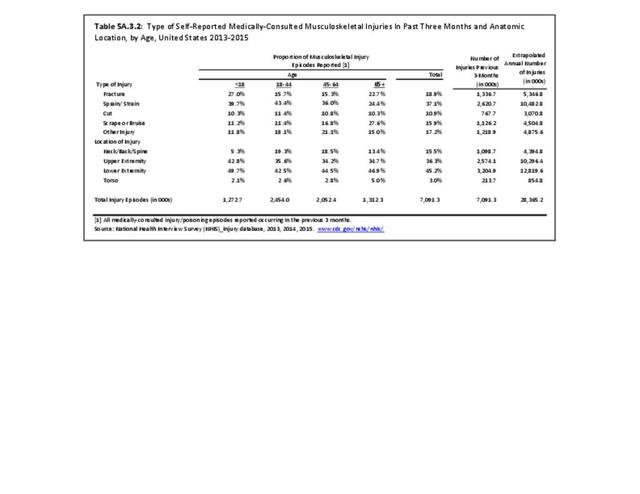
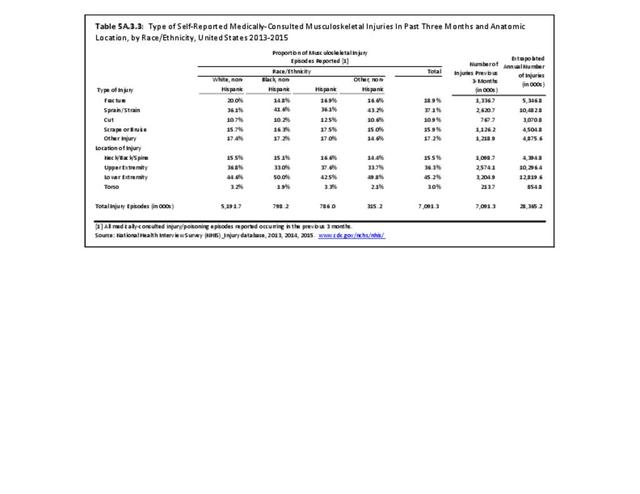
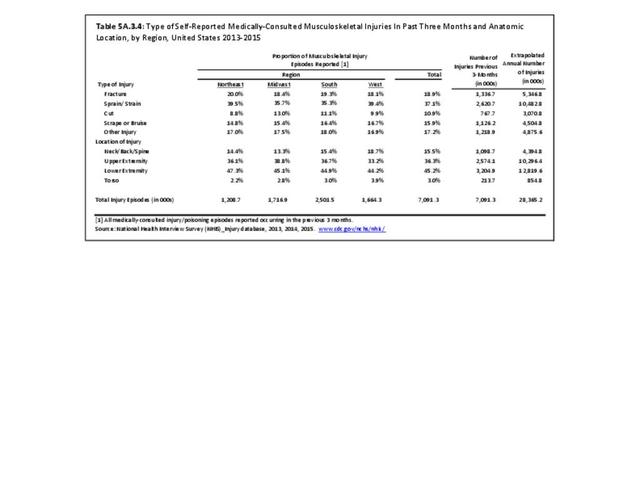
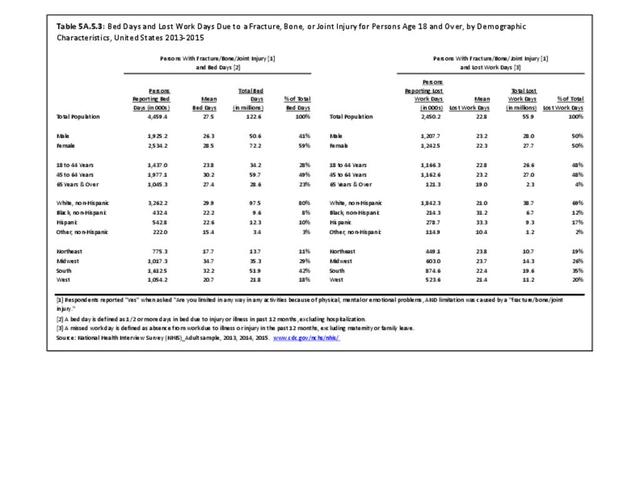
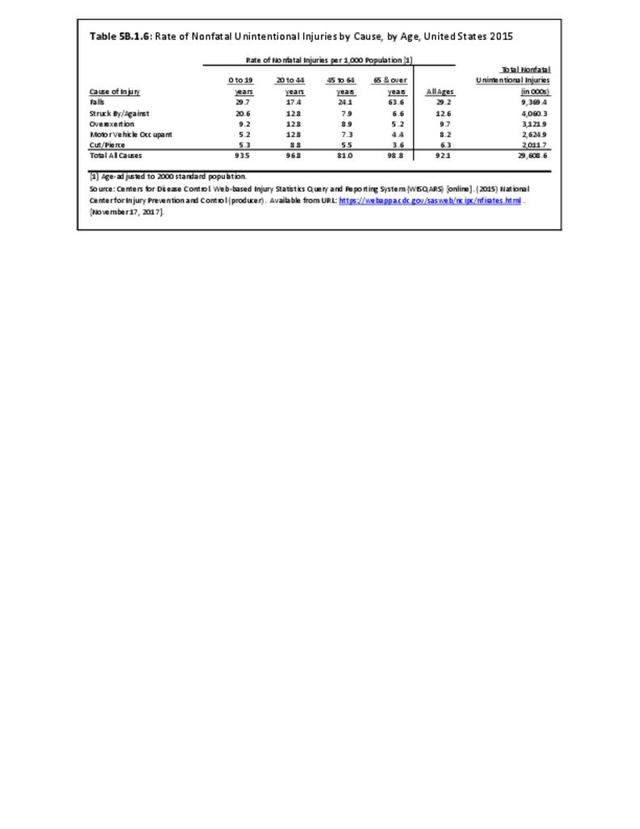
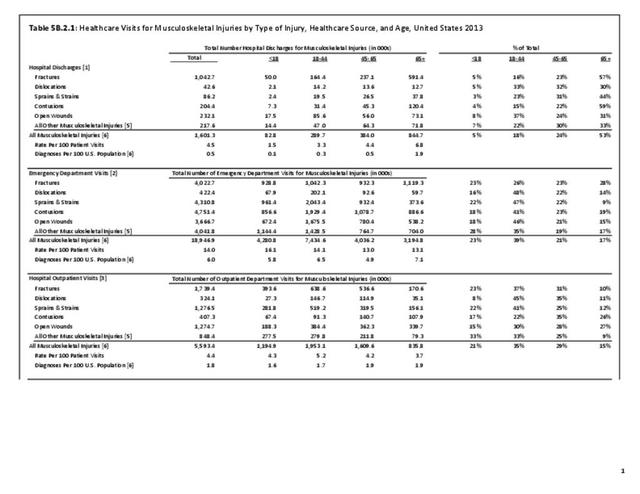
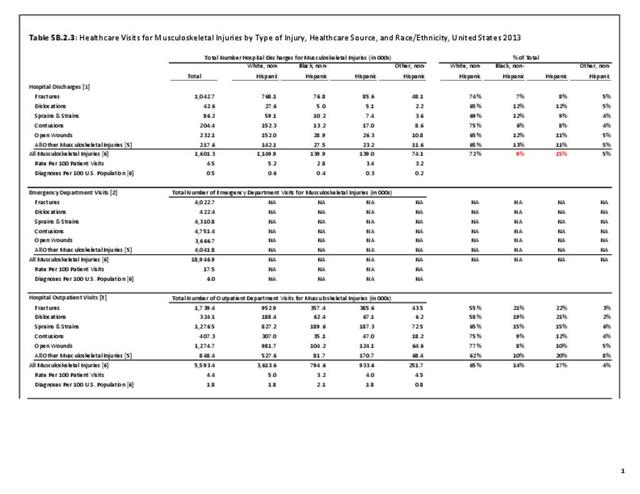
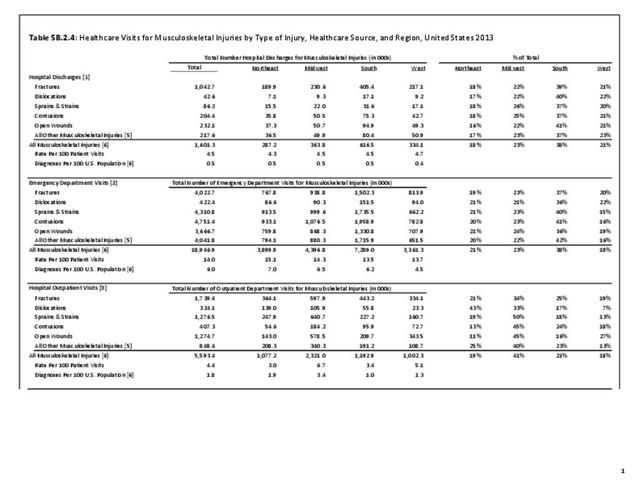
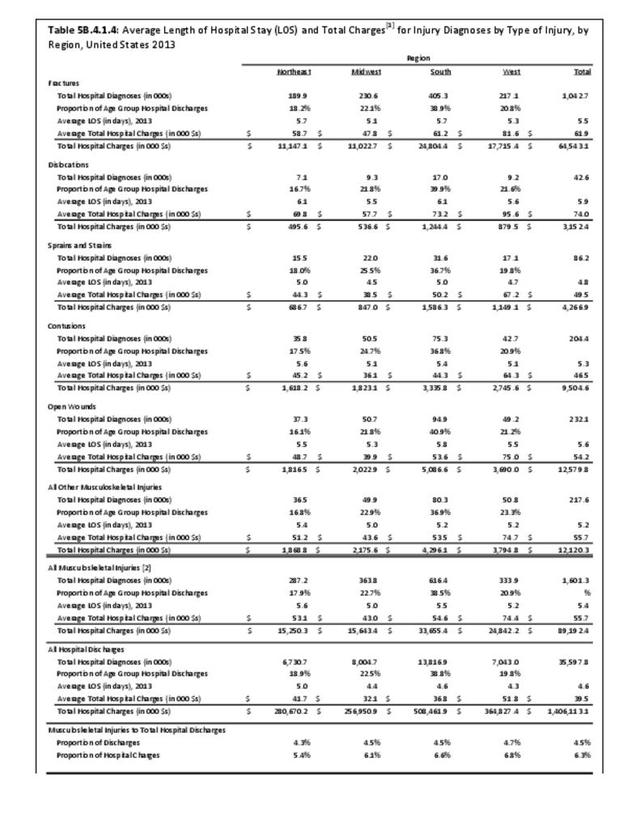
Self-reported injuries are reported by male and female individuals in the same proportion they are found in the population. Using age as the comparison variable, older people report more injuries than younger. Among racial/ethnic groups, non-Hispanic whites report more injuries while non-Hispanic others report fewer. Using the four geographic regions of the US, injuries are reported higher in the Midwest region. (Reference Table 5A.1.1 PDF CSV; Table 5A.1.2 PDF CSV; Table 5A.1.3 PDF CSV; Table 5A.1.4 PDF CSV)

Edition:
- Fourth Edition