Musculoskeletal diseases affect the US economy through direct medical costs and through lost wages. Changes in the organization of medical care, new methods of treatment, new drugs, and rising prices for existing services and medications, as well as changes in the employment situation of persons with musculoskeletal diseases, all affect the economic impact these diseases have on the economy. The result is a major economic burden from musculoskeletal diseases.
Overall Change in Healthcare Costs of Musculoskeletal Conditions
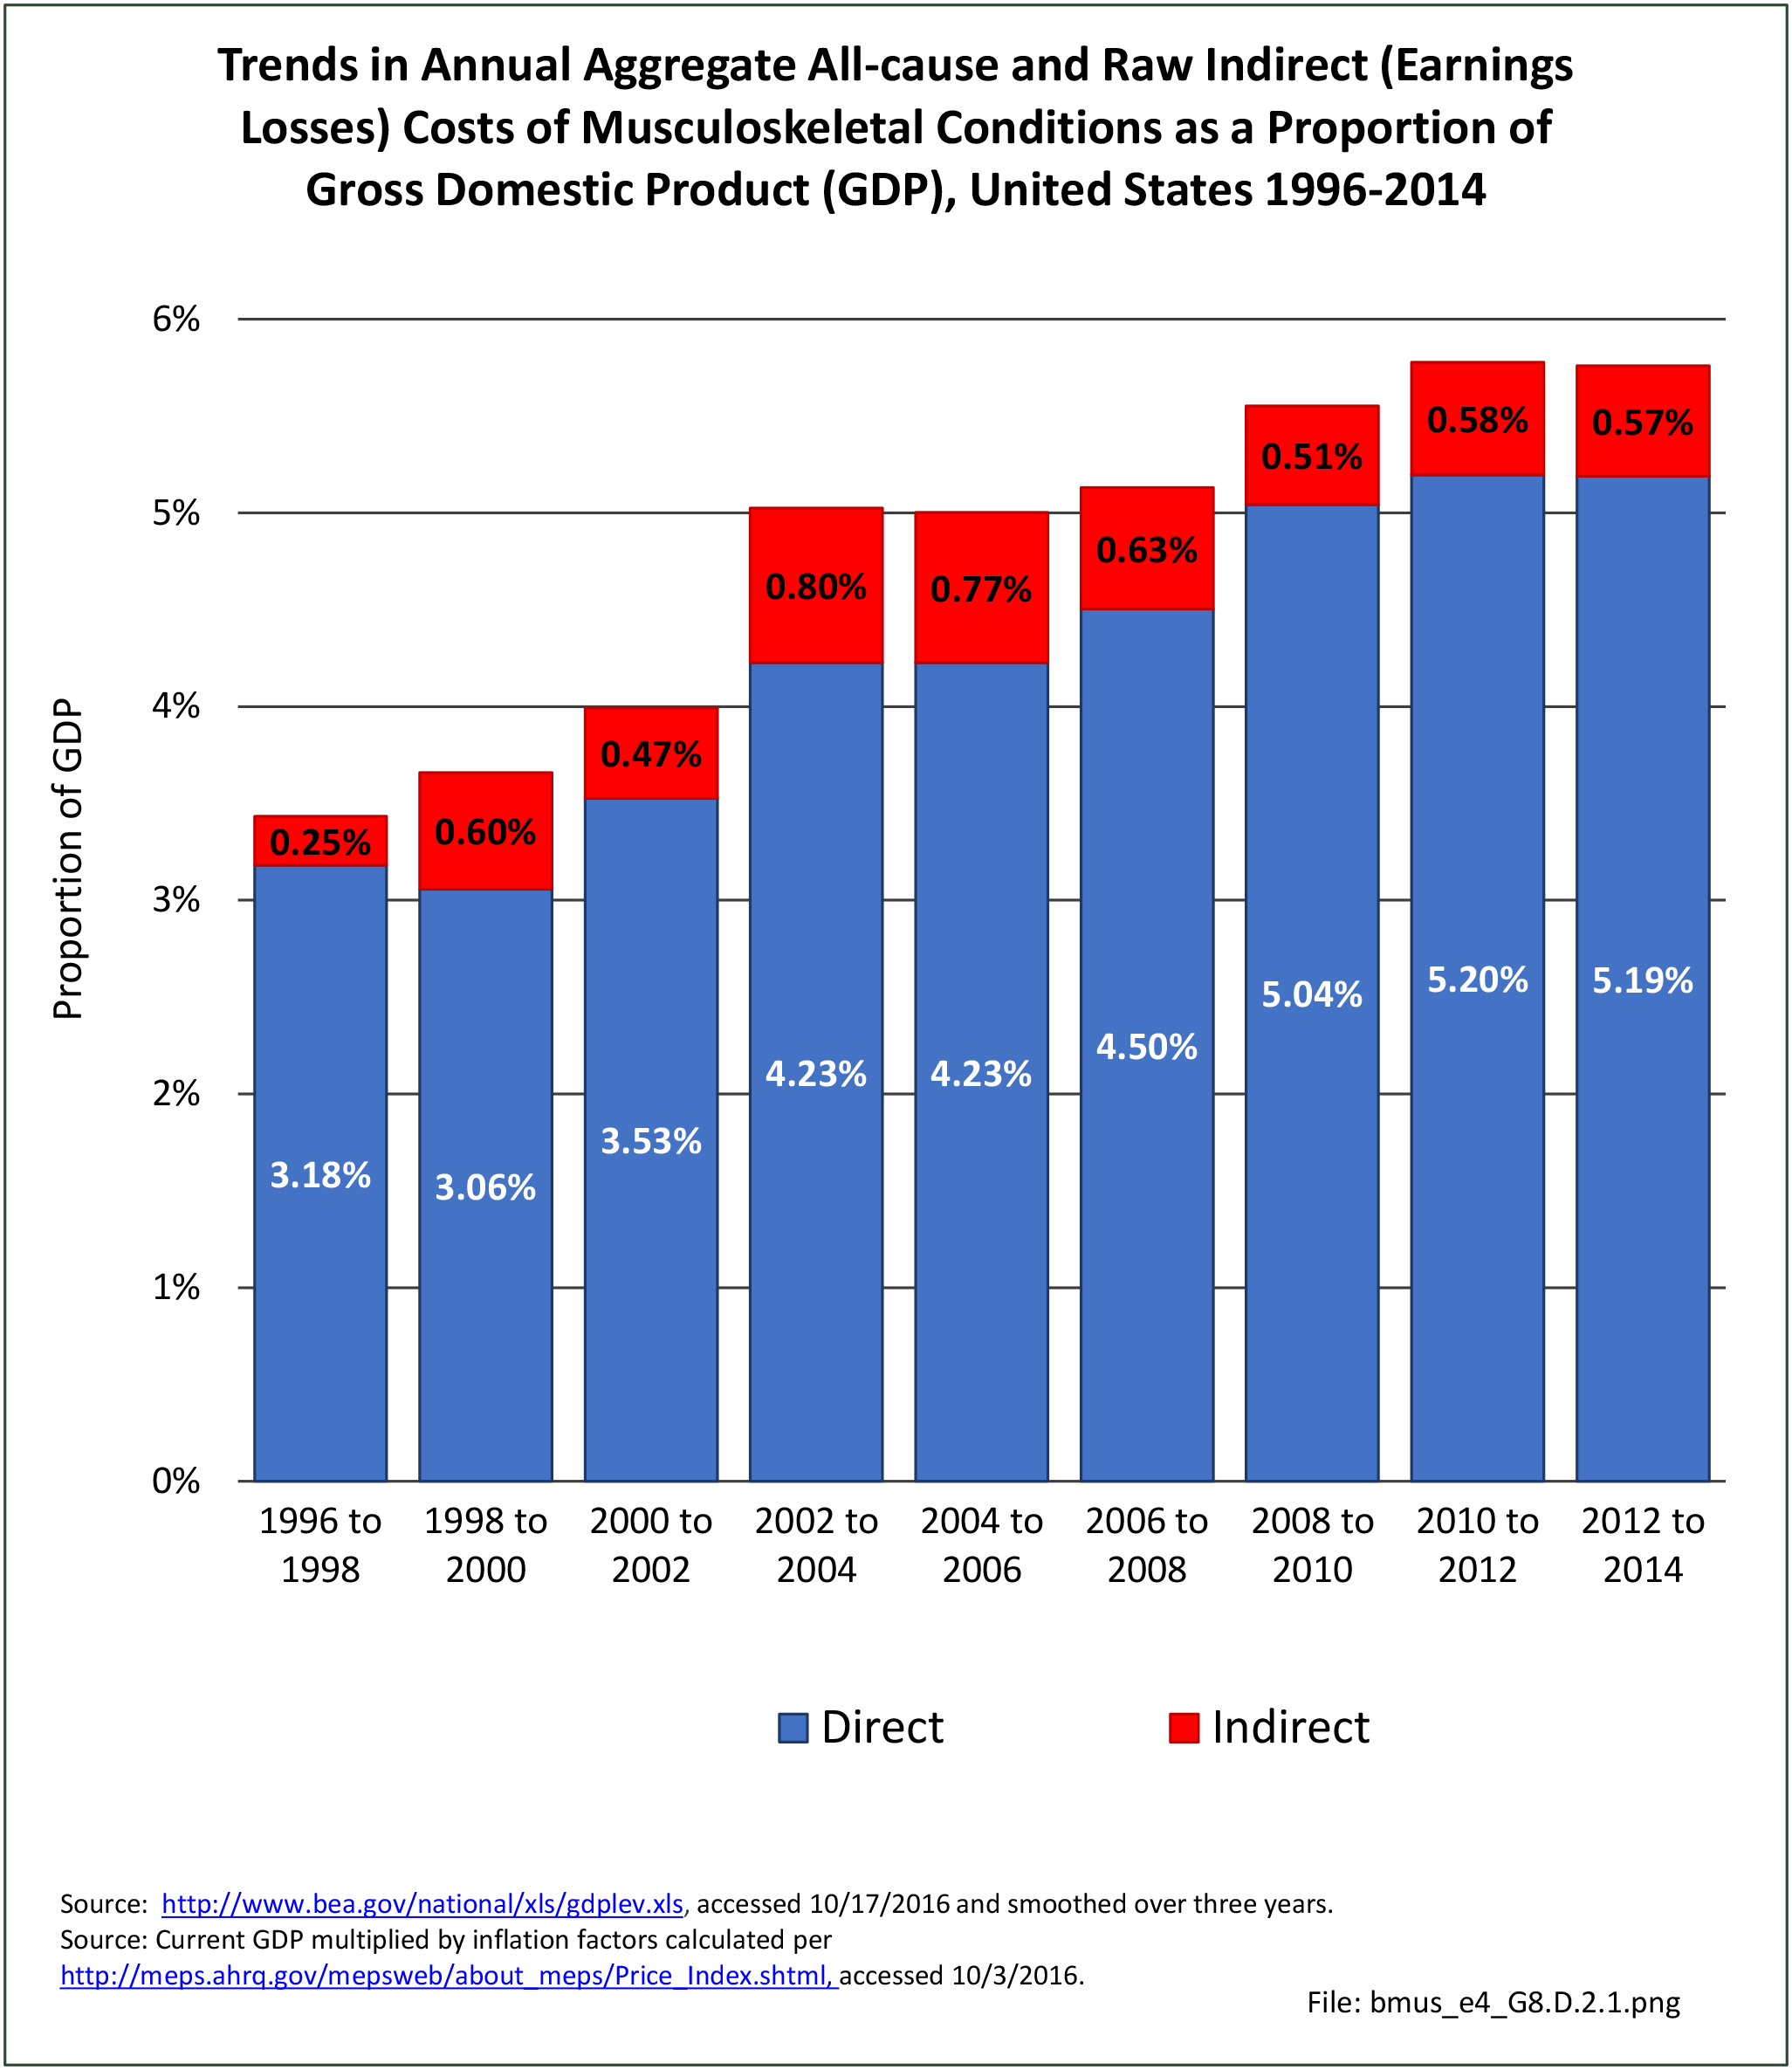
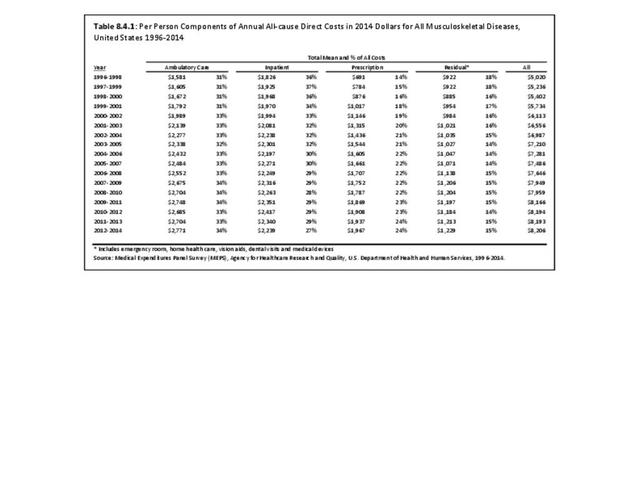
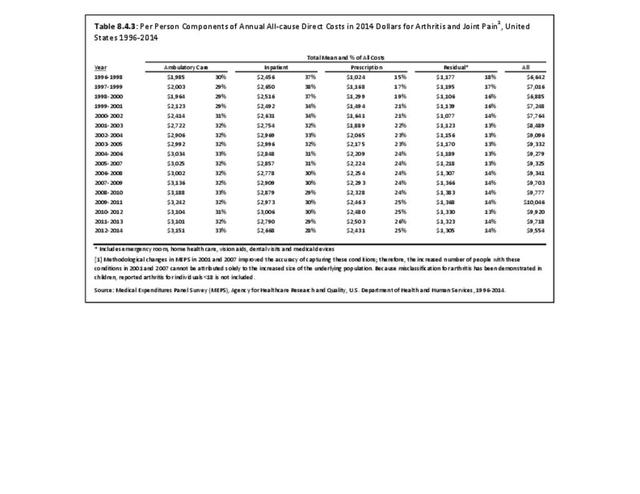
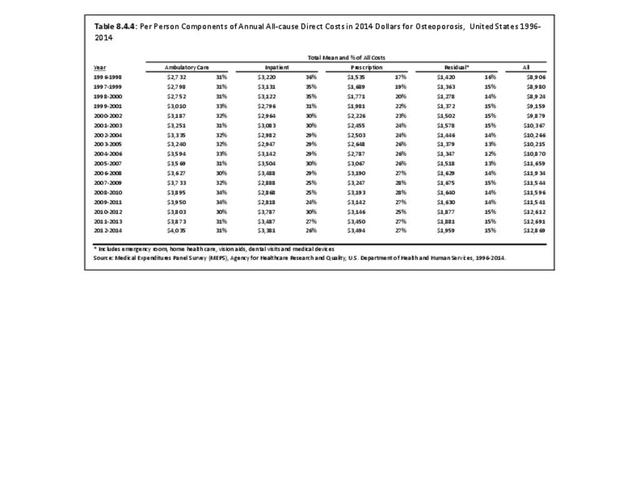
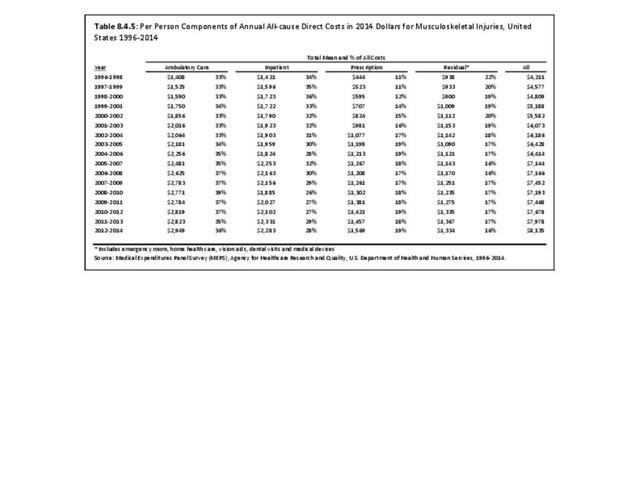
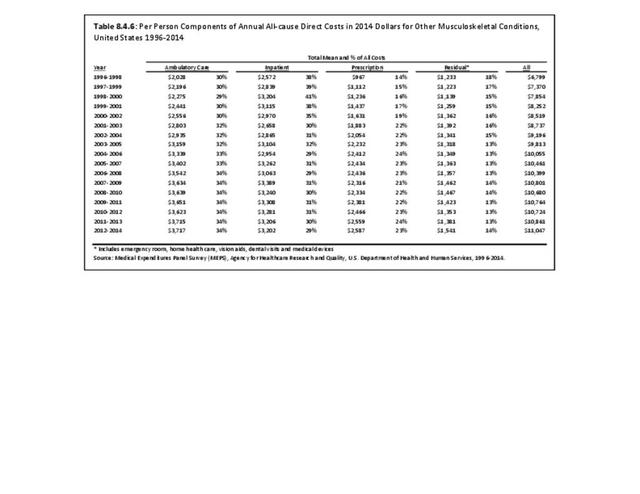
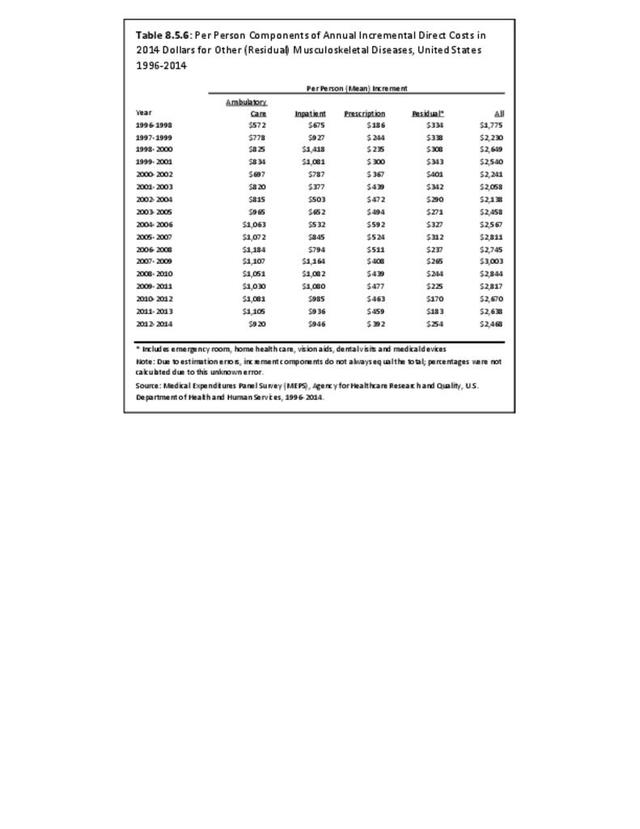
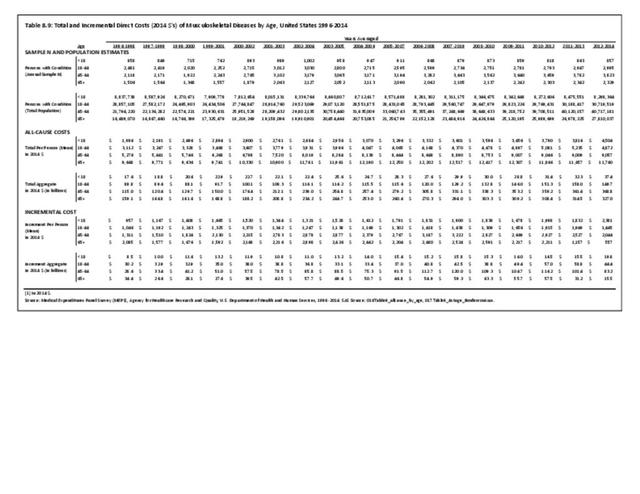
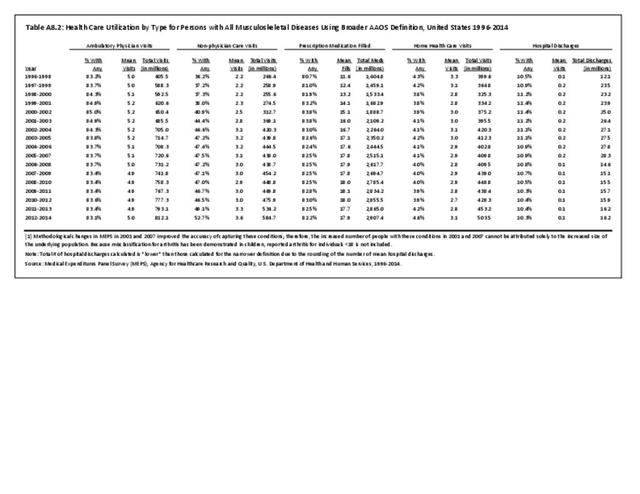
Over the period 1996-1998 through 2012-2014, the share of per person all-cause direct costs for musculoskeletal diseases shifted between healthcare sources only slightly. Ambulatory care and prescription drugs both increased in share of total cost, while inpatient and residual care both decreased. The change in mean per person costs followed a similar pattern. Although costs increased for all care sources, it was greatest for prescription and ambulatory care costs.
The share of musculoskeletal healthcare costs devoted to prescription medications increased the most, growing by more than 70%, from 14% to 24% of total cost. Computed in 2014 dollars, the mean annual prescription cost per person increased approximately 185%, from $691 to $1,967. During this time, development of biologic agents for several inflammatory conditions, particularly rheumatoid arthritis, occurred, as well as the widespread use of the cox-2 inhibitors (coxibs) for musculoskeletal pain, and may have accounted for some of the rapid increase. (Reference Table 8.4.1 PDF CSV)

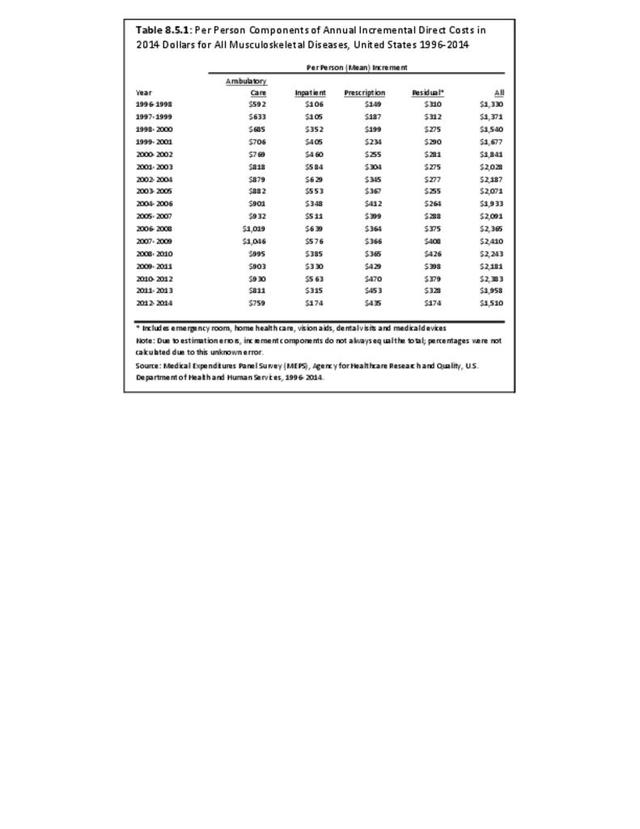
The importance of prescription drugs is not confined to just all-cause expenditures. In 2014 dollars, the increment in musculoskeletal diseases costs associated with prescription drugs rose even faster, increasing from a mean of $149 per person in 1996-1998 to a mean of $435 in 2012-2014, an increase of nearly 200%. (Reference Table 8.5.1 PDF CSV).
Indirect Costs Related to Musculoskeletal Diseases
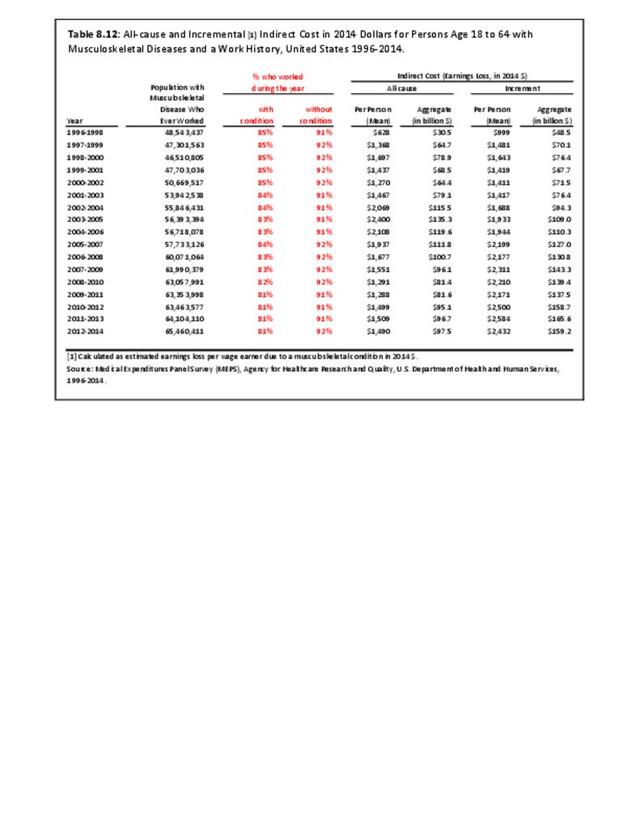
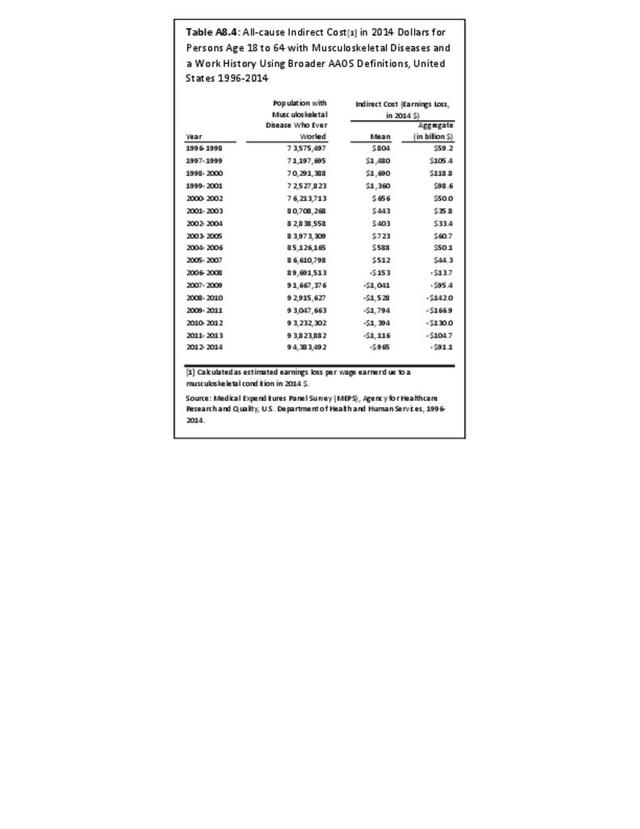
The amount of all-cause indirect costs associated with wage losses among persons with musculoskeletal conditions fluctuated from a low of $628 per person with a work history in 1996-1998 to a high of $2,400 per person in 2003-2005, and was $1,490 per person as of 2012-2014. The increment in wage losses, however, has risen steadily over time, from $999 per person in 1996-1998 to about $2,500 per person in the three most recent three-year time periods. The latter finding suggests that persons with musculoskeletal conditions experience a greater loss of wages than would be expected based on their characteristics other than work history.
In 1996-1998, about 48.5 million persons with a musculoskeletal disease had established a work history. On average, these individuals earned $628 in 2014 dollars less than those without musculoskeletal conditions; their earnings losses aggregated to $30.5 billion. By 2012-2014, the number of persons with musculoskeletal diseases and a work history had grown to about 65.5 million. On average, these workers had earnings losses of $1,490 each, resulting in aggregate all-cause earnings losses of $97.5 billion. The $67 billion increase in aggregate indirect costs of lost wages was the result of growing population numbers with musculoskeletal disease and increases in wages.
Estimates of incremental indirect costs grew from an aggregate of $48.5 billion in 1996-1998 to $159.2 billion in 2012-2014. While the rate of growth was similar for both, actual costs associated with musculoskeletal diseases is much greater. This highlights the extent to which persons with musculoskeletal disease characteristics earn less than would be expected of persons with similar characteristics but no musculoskeletal disease. (Reference Table 8.12 PDF CSV)

Edition:
- Fourth Edition