The economic burden of bone cancers can be great. The more advanced the disease, the worse the prognosis and, accordingly, the more expensive the treatments. It is likely that early detection, and, certainly, prevention if possible, could drastically reduce costs. Several expensive treatments are required to address these tumors. In the 2007 report by Damron, Ward, and Stewart,1 it was noted that the most frequent initial treatments varied widely based on the type of sarcoma and, although not reported, also on the stage of the disease as well.
Collectively, they reported surgery alone was the most common initial treatment for chondrosarcomas (69%), whereas Ewing sarcoma treatments were divided between surgery and chemotherapy (24% of cases), radiation and chemotherapy (23%), and chemotherapy alone (18%). With osteosarcoma, when initial treatment was known, the largest group received surgery and chemotherapy (46%). Surgery was reported as part of the initial treatment in 71% of osteosarcoma patients, 83% of chondrosarcoma patients, and 47% of Ewing sarcoma patients. The most frequent operations performed were limb-sparing radical resections and excisions. When the type of surgery was defined and known, limb-preservation surgery was performed in 69% of osteosarcomas, 79% of chondrosarcomas, and 81% of Ewing sarcomas.1
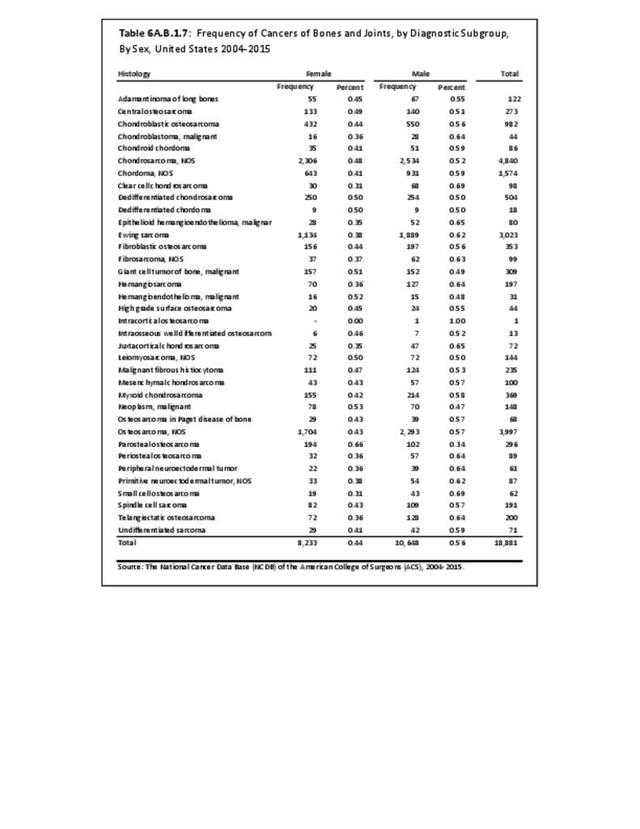
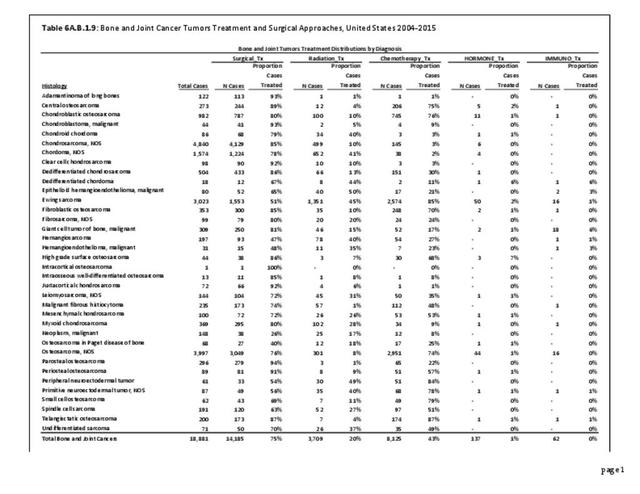
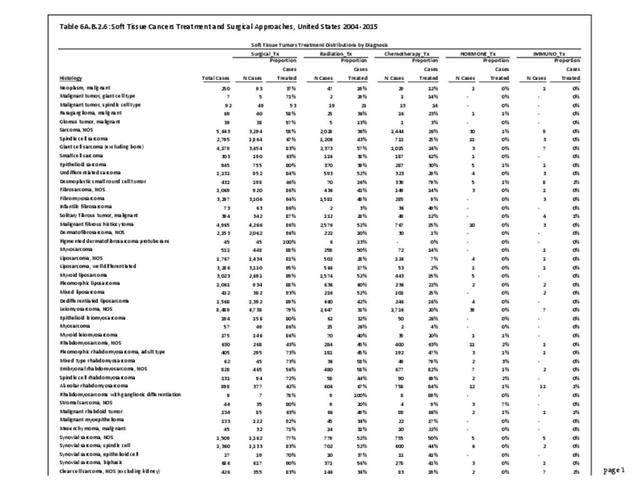
The frequencies of the various treatment modalities employed in the latest reported (2004-2015) NCDB cohort are shown in the data tables attached to this section for bone and joint cancers and soft tissue cancers. As shown in the table, for Osteosarcoma NOS 76% had surgery, 74% had chemotherapy, and only 8% had radiation. For Ewing Sarcoma, the numbers were 51%, 85%, and 45%, respectively. For Chondrosarcoma NOS, the numbers were 85%, 3%, and 10%. These distributions reflect the widely different treatments of these three major categories of bone and joint cancers. (Reference Table 6A.B.1.9 PDF CSV and Table 6A.B.2.6 PDF CSV)

In Dr. Ward's personal series of more than 100 osteosarcomas, amputation has been required in only 17% of patients, but almost all remaining patients have had surgical resection, limb reconstruction, and chemotherapy.1 The authors believe Dr Ward’s series is a reasonable approximation of treatments employed by most orthopedic oncologists in the US today.
Multiple therapies may be needed throughout the course of the patient's disease, especially in more advanced cases. In later stages of the disease for those not cured with surgery alone, significant costs will accumulate as patients develop pulmonary disease and ultimately die. Hormone therapy, immunotherapy, bone marrow transplant, and endocrine treatments each accounted for 1% or less of initial treatments. However, in severely affected individuals in whom standard treatments fail, these alternative treatments may be tried more frequently. Currently, the authors are not aware of any data source that reports the rate of utilization of such late treatments.
All these treatments are costly to administer. Per-patient cost will vary widely depending on the treatments utilized, and the number and intensity of treatments. Overall, treatment for bone and joint cancers can easily exceed $100,000 for a single patient. This is particularly true if a patient receives surgery, chemotherapy, and radiation therapy. If one includes bone-replacing endoprostheses or artificial limbs used in cases requiring amputation, the cost will be much higher. In addition to the direct medical cost, there are extensive indirect and social costs from lost work time and disability. For some patients, healthcare costs associated with their bone and joint cancers will be ongoing.
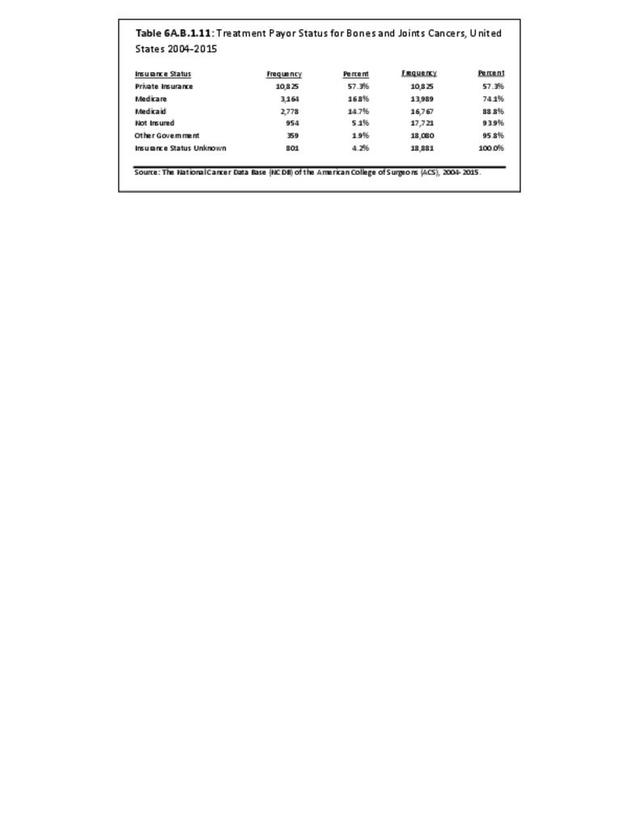
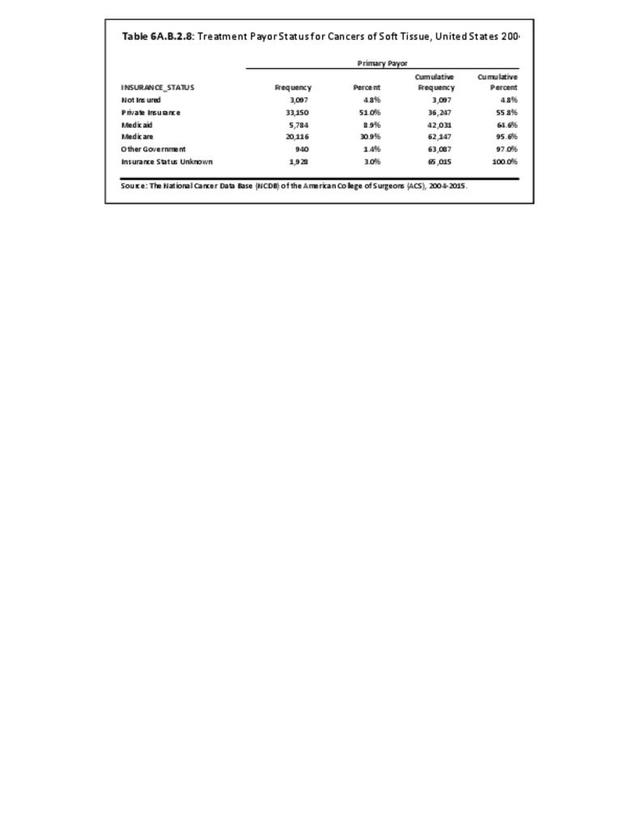
Analysis of the most recent NCDB insurance data, which covers all ages and covers the years 2004-2015 inclusive, available for 18,881 reported bone and joint cancer cases show Medicare and Medicaid covering 16.76% and 14.71%, respectively, with private insurance covering 57.33%, other government payors covering 1.9% with 5.05% uninsured and 4.24% with unknown insurance status. (Reference Table 6A.B.1.11 PDF CSV)

Edition:
- Fourth Edition